Development of a Statistical Approach to Determining Background Groundwater Conditions at Contaminated Sites in Alberta
|
|
|
- Mariah Strickland
- 5 years ago
- Views:
Transcription

1 Development of a Statistical Approach to Determining Background Groundwater Conditions at Contaminated Sites in Alberta Liza Flemming and Court SANDAU, TRIUM ENVIRONMENTAL SOLUTIONS. April 30, 2009
2 OVERVIEW 1. Defining the Problem Background Groundwater Conditions 2. Current Regulatory Framework 3. Developing a Method for Background Groundwater Characterization 4. Real world Application Produced Water Spill 5. Real world Application Battery Facility 6. Conclusions
3 Defining the Problem: Background Conditions
4 Background Conditions what are They? Background Concentration: Concentration of a substance in an environmental medium in a geographic area, does not include any contribution from man made sources (BC Ministry of Water, Land, and Air Protection, Protocol 9) Natural background conditions exist when there is no measurable difference between the quality of water now and the quality of water that would exist if there were no human caused changes (Idaho Department of Environmental Quality, Clean Water Act)
5 Background Conditions Conventional Wisdom Background concentrations should remain relatively constant over time, given seasonal variability Expect similar data sets from year to year Background concentrations should be similar in all wells across the site installed at the same stratigraphic interval Given soil heterogeneity, variations in flow, etc.
6 WHAT s the Problem? How should background concentrations be determined, and compared to other wells on site? What are the regulatory requirements? How many data points are needed? Is there a method that works for all sites? What is a measureable difference how different is different? What analytes represent background conditions?
7 CURRENT REGULATORY FRAMEWORK
 (section 5.2, p.")
8 ALBERTA: DRAFT ENVIRONMENTAL SITE ASSESSMENT GUIDELINES (June 2008) Groundwater characterization is part of Phase II Environmental Site Assessment process Groundwater assessment recommendation: an upgradient monitoring well to characterize background groundwater quality (preferably at the property boundary) (section 5.2, p. 73) The actual number, depth, and location of wells required to support the conclusions will depend on site conditions (section 5.2, p. 73)
9 ALBERTA: DRAFT ENVIRONMENTAL SITE ASSESSMENT GUIDELINES (June 2008) What s Missing? How to account for seasonal variations in water quality, if any? How many sampling events are required, and what frequency? Can this procedure be applied to more complex sites?
10 Saskatchewan: Environmental Site assessment procedures for upstream petroleum sites (March 1999) Adequate numbers of background samples should be obtained in all cases (Section 3.2, p. 6) To ensure representative samples, proper placement of groundwater monitoring wells is vital (Section 3.2.2, p. 7)
11 Saskatchewan: Environmental Site assessment procedures for upstream petroleum sites (March 1999) What s Missing? What is the proper placement of monitoring wells? How to account for seasonal variations in water quality, if any? How many sampling events are required, and what frequency? What is an adequate number? Can this procedure be applied to more complex sites?
12 BRITISH COLUMBIA: Protocol 9 for Contaminated sites- Determining Background Groundwater Quality Part of the Contaminated Sites assessment process Background concentration: the concentration...in an environmental medium that does not include any contribution from human made point sources (Section 2.0, p. 2) A site is not a contaminated site... If the site does not contain any substance with a concentration greater than the local background concentration of that substance (Section 2.0, p. 2)
13 BRITISH COLUMBIA: Protocol 9 for Contaminated sites- Determining Background Groundwater Quality A minimum of three wells should be installed Cross gradient or up gradient Off site natural areas, parks, or residential Larger sites, greater contamination more wells may be required Sample all wells a minimum of 2 times Provide a robust data set Sampling strategy should address seasonal variability
14 BRITISH COLUMBIA: Protocol 9 for Contaminated sites- Determining Background Groundwater Quality Statistical determination of local background concentration (for a given substance) If background data fall into a single statistical population: background concentration is 95 th percentile concentration of data set Large data variability/no distinct population: use conservative estimates, or install additional wells and collect more samples More statistical tools Technical Guidance 12
15 BRITISH COLUMBIA: Protocol 9 for Contaminated sites- Determining Background Groundwater Quality What s Missing? Procedures for addressing seasonal variations in water quality, if any? Can this procedure be applied to oil and gas sites? Are two sampling events from three wells enough to ensure confidence that background conditions have been characterized?
16 procedures IN ALBERTA (AND SASKATCHEWAN)? Adopt the BC Regulations? 95 th percentile concentrations? Rely solely on judgement and conservative estimates? Develop an approach that uses site evaluation and statistical tools Multiple lines of evidence Increase confidence in professional opinions help clients and regulators make informed decisions
17 method for background characterization
18 What Should be Included? Assembling evidence drives the site evaluation process Hypothesis to conclusion Preference for stronger evidence in regulatory environment Multiple lines/sources are stronger than a single source make the Best Case Possible confidence Requires a multi step process Quantitative evidence is stronger than qualitative evidence
19 What Should be Included? Methods should be defensible and reproducible Process developed should meet the regulatory requirements, if any
20 FIRST Proposed STEP: EVALUATE SITE CONDITIONS Numerical Analysis Table Trends Graphs Physical Properties of the Site Apply Professional Experience and Expertise

21 SECOND PROPOSED STEP: Apply QUANTITATIVE STATISTICS Possible options Box Whisker Plots 2 Dimensional comparison of numerical distribution among data sets

22 Apply QUANTITATIVE STATISTICS Possible OPTIONS 3 Dimensional Plots 3D Scatterplot (Watertech data 40.sta 14v*16c) MW1 MW1 MW1 MW1 MW6 MW5 MW5 MW6 MW6 MW5 MW5 MW4 MW4 MW4
23 Apply QUANTITATIVE STATISTICS Possible OPTIONS Analysis of Variance T test for 2 sample locations ANOVA Single Factor Effect of a factor on the variance of means Multi Factor ANOVA and COVANOVA One or more factors may control variance Co variance may also exist among data set/s
24 GROUNDWATER Evaluation Roadmap Characterization! Apply professional expertise T-TEST ANOVA Physical site conditions Graphs Statistical Analysis Box-whisker plots TABLE TRENDS Site Investigation
25 Apply QUANTITATIVE STATISTICS BENEFITS TO SITE EVALUATION Support initial Site Evaluation Cases where no clear relationship between impacts and background can be inferred Increase confidence in professional expertise Apply qualitative methods that can be defended and reproduced
26 REAL-WORLD GROUNDWATER EVALUATION: BATTERY FACILITY
27 Groundwater EValuation: Battery Facility OBJECTIVE: Compare concentrations in wells outside of soil impact area to concentrations within impact area can background concentrations be seen in wells across the site? Characterize background conditions for select individual analytes across the site, not just for concentrations in one well
28 FIRST LEVEL OF EVIDENCE: Qualitative Evaluation Physical Properties of the Site
 Leaking tank")
29 groundwater flow Excavated flare lines and infrastructure (2006) Leaking tank (2007)
30 ???
31 FIRST LEVEL OF EVIDENCE: Qualitative Evaluation Physical Properties of the Site Graphs Look for trends and patterns
32
33
34
35 TDS Concentrations look similar to the Background well
36
37 FIRST LEVEL OF EVIDENCE: Qualitative Evaluation Physical Properties of the Site Graphs Look for trends and patterns Table trends compare known Background well to other wells on site
38 Chloride Concentrations in Groundwater Battery Facility Site 06MW01 06MW02 06MW04 06MW06 06MW07 06MW08 06MW11 28-Sep ns ns 10-Dec Feb ns ns 18-May Oct May-08 ns Oct MW12 06MW15 06MW16 07MW17 GWMW1 GWMW2 GWMW3 28-Sep-06 ns ns ns ns ns ns ns 10-Dec ns ns Feb ns May Oct May ns Oct What trends do the data suggest? Do areas with concentrations below the guidelines represent background conditions or impacted areas?
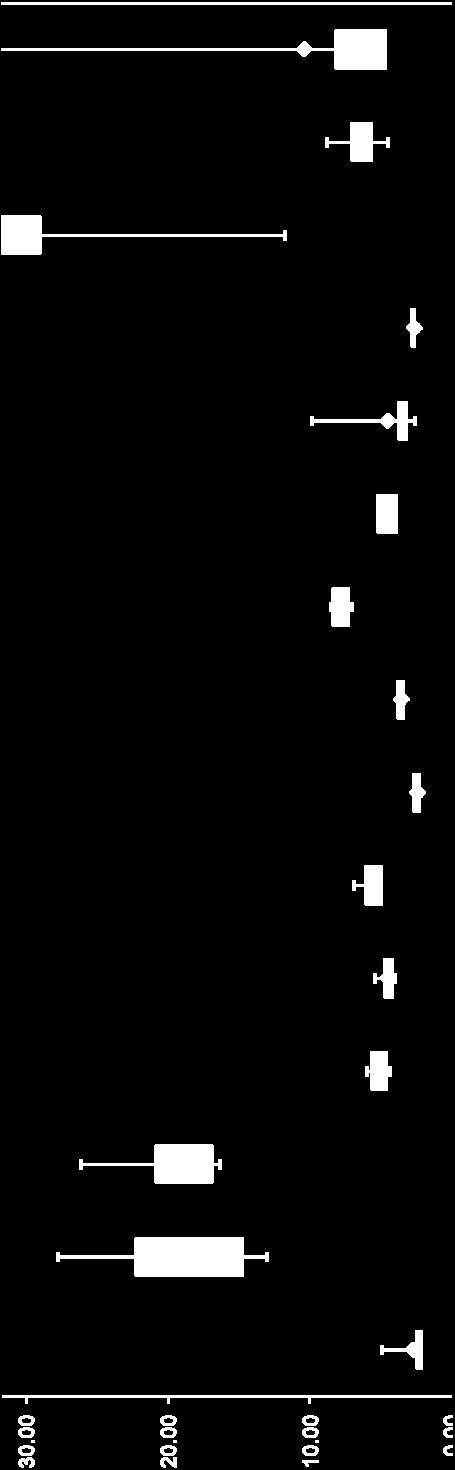
39 Second LEVEL OF EVIDENCE: Statistical Evaluation Box Whisker Plots

40
41 ??? This was the first guess based on site conditions
42 Chloride Boxwhisker plot suggests impacts may be differently distributed
43 Chloride Concentrations in Groundwater Battery Facility Site 06MW01 06MW02 06MW04 06MW06 06MW07 06MW08 06MW11 28-Sep ns ns 10-Dec Feb ns ns 18-May Oct May-08 ns Oct MW12 06MW15 06MW16 07MW17 GWMW1 GWMW2 GWMW3 28-Sep-06 ns ns ns ns ns ns ns 10-Dec ns ns Feb ns May Oct May ns Oct Box whisker plots suggest the concentrations in these wells do not resemble background concentrations (MW01, MW11) for chloride exclude from analysis of background concentrations Should the remaining wells be included?


44 Box Whisker Plot Potassium Outlier Outlier


45 Can any wells be excluded? Can calcium background be characterized? Outlier?? Outlier?? Outlier??
46 What about Metals?
47 Dissolved Metals Concentrations in Groundwater Battery Facility Site (selected analytes) 06MW1 06MW4 06MW7 06MW10 06MW15 MANGANESE 28-Sep-06 ns 1.05 ns ns ns 10-Dec Feb May Oct May Oct MW1 06MW4 06MW7 06MW10 06MW15 URANIUM 28-Sep-06 ns ns ns ns 10-Dec Feb May Oct May Oct What trends do the data suggest? Do areas with concentrations above the guidelines represent background conditions or impacted areas?


48 Box Whisker Plot Manganese Exclude 06MW04, 06MW7 from background calculations of manganese concentrations?


49 Exclude 06MW15 from background calculations of uranium concentrations?
50


51 Second LEVEL OF EVIDENCE: Statistical Evaluation - VAriance T Test Compare difference between means among 2 well data sets
52 Second LEVEL OF EVIDENCE: Statistical Evaluation - VAriance Analysis of Variance (ANOVA) Single Factor Evaluation Compare variance among several well data sets Multiple T Tests and factor influence Test a hypothesis (H 1 ) about differences between means there is a factor (i.e. sample location ) that explains the variation in means that we see If the variance is not significant, the factor does not apply Assumes that the population is normally distributed and that variance is relatively homogeneous
53 Second LEVEL OF EVIDENCE: Statistical Evaluation - VAriance Battery Facility T Test: Perform T test with each analyte using two wells believed to represent background conditions Evaluate the hypothesis (H 1 ) that the variance of the means is significant means are not similar If the variance of the means is not significant, H 0 is true the means of the data sets are similar Concentrations in the selected wells represent background conditions
54 Second LEVEL OF EVIDENCE: Statistical Evaluation - VAriance Battery Facility ANOVA: Perform an ANOVA on each analyte using the accumulated data sets from selected wells outside impact area Evaluate the hypothesis (H 1 ) that the variance in the means is significant and that the location of the well explains the variance of the means If the variance of the means is not significant, H 0 is true the well location must not be a factor Background conditions may be represented in all of these wells
55 BATTERY FACILITY ANALYSIS: CHLORIDE T-Test And ANOVA Paired, 2 tailed T Test (α=0.05): Two upgradient wells (06MW01 and 06MW11) P = 3.16E 5, the means are different the samples are from different populations 06MW11 and well outside the plume (07MW17) P = 0.43 the samples are from the same population 06MW11 and 07MW17 may represent background concentrations
56 BATTERY FACILITY ANALYSIS: CHLORIDE T-Test And ANOVA SUMMARY Groups Count Sum Average Variance 06MW MW MW MW MW ANOVA Source of Variation SS df MS F P-value F crit Between Groups E Within Groups Total Exclude all wells believed to be within impacted area F value indicates that H 1 is true location is a factor variation is significant these wells do not collectively represent background for chloride
57 BATTERY FACILITY ANALYSIS: Potassium T-Test And ANOVA Paired, 2 tailed T Test (α=0.05): Two upgradient wells (06MW01 and 06MW11) P = 0.641, the means are similar the samples are from the same population 06MW11 and well outside the plume (07MW17) P = the samples are from the same population 06MW01, 06MW11 and 07MW17 may represent background concentrations
58 BATTERY FACILITY ANALYSIS: Potassium T-Test And ANOVA SUMMARY Groups Count Sum Average Variance 06MW MW MW MW ANOVA Source of Variation SS df MS F P-value F crit Between Groups Within Groups Total Exclude all wells believed to be within impacted area F value indicates that H 1 is false location is not a factor these wells represent background for potassium concentrations
59 BATTERY FACILITY ANALYSIS: Manganese T-Test And ANOVA Paired, 2 tailed T Test (α=0.05): Two wells outside plume (06MW01, 06MW10) P = 0.159, the means are similar the samples are from the same population 06MW01, 06MW10 may represent background concentrations for manganese
60 BATTERY FACILITY ANALYSIS: Manganese T-Test And ANOVA SUMMARY Groups Count Sum Average Variance 06MW E-05 06MW MW MW MW ANOVA Box-whisker plot indicated MW4, MW7, MW15 should be excluded Source of Variation SS df MS F P-value F crit Between Groups E Within Groups Total All wells (set of values above MDL is too small) F value indicates that H 1 is true location is a factor these wells collectively do not represent background for manganese concentrations
61 BATTERY FACILITY ANALYSIS: Zinc T-Test And ANOVA Paired, 2 tailed T Test (α=0.05): Two wells outside plume (06MW01, 06MW10) P = , the means are similar the samples are from the same population 06MW01, 06MW10 may represent background concentrations for manganese
62 SUMMARY BATTERY FACILITY ANALYSIS: Zinc T-Test And ANOVA Groups Count Sum Average Variance 06MW MW MW MW MW ANOVA Source of Variation SS df MS F P-value F crit Between Groups Within Groups Total All wells (set of values above MDL is too small) F value indicates that H 1 is false location is not a factor these wells may collectively represent background for zinc concentrations
63 BATTERY FACILITY ANALYSIS: FINDINGS Statistical tests are enlightening Analysis of table trends and graphs didn t yield enough confidence in background characterization Box whisker plots revealed several outliers within impacted areas for multiple analytes Showed that further analysis on calcium concentrations not productive T tests showed that pairs of wells that were upgradient or outside plume appear to represent background for potassium, magnesium, chloride, manganese, zinc
64 BATTERY FACILITY ANALYSIS: FINDINGS ANOVA Background concentrations not accurately characterized across the site for chloride, manganese Background concentrations may be accurately characterized across the site for potassium, zinc Reminder Seasonal variation has not been examined in single factor ANOVA
65 Groundwater EVALUATION: PRODUCED WATER SPILL
66 Groundwater EValuation: Produced Water Spill OBJECTIVE: Compare concentrations in wells outside of soil impact area to concentrations within impact area can background concentrations or produced water impacts be seen in wells across the site? Characterize background conditions for select individual analytes across the site, not just for concentrations in one well
67 FIRST LEVEL OF EVIDENCE: Qualitative Evaluation Physical Properties of the Site Table trends compare known Background well to other wells on site

68
69
70 FIRST LEVEL OF EVIDENCE: Qualitative Evaluation Physical Properties of the Site
71 Analyte Concentrations in Groundwater Produced Water Site 07MW1 07MW4 07MW5 07MW6 CHLORIDE 07MW1 07MW4 07MW5 07MW6 SULFATE MW1 07MW4 07MW5 07MW6 SODIUM What trends do the routine water data suggest? Do areas with concentrations below the guidelines represent background conditions or impacted areas?
72 Dissolved Metals Concentrations in Groundwater Produced Water Site 07MW1 07MW4 07MW5 07MW6 IRON 07MW1 07MW4 07MW5 07MW6 ZINC 25-Oct Oct-07 ns ns ns ns Mar Mar May May Aug Aug Sep Sep MW1 07MW4 07MW5 07MW6 BARIUM 25-Oct-07 ns ns Mar May Aug Sep What trends do the metals data suggest? Do areas with concentrations below the guidelines represent background conditions or impacted areas?
73 Spill Site ANALYSIS: CHLORIDE T-Test And ANOVA Paired, 2 tailed T Test (α=0.05): Background and spill wells (07MW01, 07MW5) P = 6.37E 7, the means are different the samples are from different populations Background and spill wells (07MW01, 07MW6) 5.99E 6, the means are different the samples are from different populations Chloride concentrations may not be comparable inside and outside the spill
74 SPILL SITE ANALYSIS: CHLORIDE T-Test And ANOVA SUMMARY Groups Count Sum Average Variance 07MW MW MW MW ANOVA Source of Variation SS df MS F P-value F crit Between Groups Within Groups Total Include all wells data set is small F value indicates that H 1 is true location is a factor variation in means is significant these wells do not collectively represent background for chloride
75 Spill Site ANALYSIS: SULPHATE T-Test And ANOVA Paired, 2 tailed T Test (α=0.05): Background and spill wells (07MW01, 07MW5) P = 0.004, the means are different the samples are from different populations Background and spill wells (07MW01, 07MW6) 0.001, the means are different the samples are from different populations Chloride concentrations may not be comparable inside and outside the spill
76 Spill Site ANALYSIS: PoTASSIUM T-Test And ANOVA Paired, 2 tailed T Test (α=0.05): Background and spill wells (07MW01, 07MW5) P = 0.848, the means are similar the samples are from the same populations Background and spill wells (07MW01, 07MW6) 0.065, the means are similar the samples are from the same populations Potassium concentrations may be comparable inside and outside the spill
77 SPILL SITE ANALYSIS: SUMMARY OF Sulfate and Potassium ANOVA Sulfate: F = 99.50, F CRIT = 3.24 F value indicates that H 1 is true location is a factor variation in means is significant these wells may not collectively represent background for sulfate Potassium: F = 46.30, F CRIT = 3.24 F value indicates that H 1 is true location is a factor variation in means is significant these wells may not collectively represent background for potassium
78 Spill Site ANALYSIS: METALS T-Test And ANOVA Paired, 2 tailed T Test (α=0.05): Iron: Background and spill wells 07MW01, 07MW5 and 07MW1, 07MW6 P = 0.12 and 0.06, background iron concentrations may be in both locations Zinc: Background and spill wells 07MW01, 07MW5 and 07MW1, 07MW6 P = 0.35 and 0.06, background iron concentrations may be in both locations
79 SPILL SITE ANALYSIS: SUMMARY OF METALS ANOVA Iron: F = 3.87, F CRIT = 3.34 F value indicates that H 1 is true location is a factor variation in means is significant these wells may not collectively represent background for iron Zinc: F = 0.75, F CRIT = 3.24 F value indicates that H 1 is false location is not factor variation in means is not significant these wells may collectively represent background for zinc
80 SPILL SITE ANALYSIS: FINDINGS Statistical tests are enlightening Analysis of table trends added more uncertainty in characterizing background concentrations T tests showed that analyte concentrations in background well were not comparable to those within spill area for chloride, sulfate T tests showed that analyte concentrations in background well were comparable to those within spill area for potassium, iron, zinc
81 BATTERY FACILITY ANALYSIS: FINDINGS ANOVA Background concentrations not represented inside and outside the spill for chloride, sulfate, and potassium Background concentrations may be accurately characterized across the site for zinc Reminder Seasonal variation has not been examined in single factor ANOVA Reminder 2 the data set for this spill site is extremely small 4 wells, 4 5 samples per well
82 Conclusions
83 THE statistical MEthod: ADVANTAGES Useful when combined with the initial site evaluation Multiple lines of evidence for observations Reveals relationships that manual analysis (tables and graphs) cannot determine Increased confidence when data are not clear cut Defensible and reproducible Methods to update the analysis when new data come in
84 THE statistical MEthod: Drawbacks Time consuming potentially expensive Requires a large, robust data set with detectable concentrations Requires normal, homogeneous sample populations Multiple tests may be required to account for seasonal variablity QAQC and Data Verification is incredibly important must have confidence in the data set small differences in reported values can be crucial
85 GROUNDWATER EVALUATION: RECOMMENDATIONS Combine site observations with statistical analytical tools Use a multi step approach Box Whisker plots then analysis of variance to characterize groundwater concentrations Design sample plans to collect enough data, from enough wells, for statistical analysis
86 GROUNDWATER EVALUATION: STATISTICAL METHODS - What else is Needed? Procedures for incorporating seasonal variations in groundwater? Different procedures for evaluating small and large sites, and various families of analytes? Additional regulatory input and guidance
87 Q u e s t i o n s?