Impacts of Rainfall Events on Water Quality in the Houston Metro Area
|
|
|
- Horace Martin
- 5 years ago
- Views:
Transcription
1 Impacts of Rainfall Events on Water Quality in the Houston Metro Area Hanadi Rifai and Anuradha Desai Civil and Environmental Engineering University of Houston, Houston, TX
2 Acknowledgments TCEQ EPA Houston Endowment My graduate students
3 Rainfall and Water Quality Tremendous growth in Houston Metro since 80s Metro area is mostly covered with impervious surfaces Complex water sanitary storm network Leaks, bypasses, overflows not uncommon Houston receives > 48 in precipitation annually Rain on average once a week Storm water network includes pipes, ditches and bayous


4 Effects of Urbanization on Aquatic Resources Hydrology Geomorphology Water Quality Habitat

5 Development & Imperviousness Imperviousness = Fundamental changes in characteristics of land cover Change in physical structure of streams Change in diversity and abundance of aquatic life More pollutants in streams >10% channel erosion >25% habitat degradation & poor water quality

6 Brays Land Use/Land Cover

7 Hydrologic Effects Disruption of natural water balance Increased flood peaks More storm water runoff More frequent flooding Increased bank full flows Lower dry weather flows (not counting effluent)

8 Increased Runoff
9 Cumulative Flow Frequency Curves for Buffalo Bayou at West Belt Flow (cfs) % 20% 40% 60% 80% 100% Percentage not exceeding flow 1983 to to to 1999
10 Brays at Houston Flow (cfs) Cumulative Flow Frequency at USGS Station Brays Houston Entire record Up to and after 0% 10% 20% 30% 40% 50% 60% 70% 80% 90% 100% Percentage Not Exceeding Flow

11 More flooding


12 Effects on Water Quality Increased stream temperature Increased pollutants Increased risk of shellfish/beach closure
13 Typical Pollutants Suspended solids/sediments Nutrients (nitrogen & phosphorus) Metals (copper, zinc, lead, and cadmium) Oil & greases (PAHs) Bacteria Pesticides and Herbicides Temperature POPs (persistent, bioaccumulative, organic pollutants) Pharmaceuticals etc.

14 Buffalo Bayou at Westcott

15 White Oak Bayou at Heights

16 Bacteria and Bacteria Indicators Disease causing bacteria and viruses Associated with fecal matter E.coli Ref:
17 Coliform Bacteria Total Coliform (many environmental sources) Fecal Coliform (mostly fecal but some other sources) E. coli (good fecal indicator) Pathogenic E. coli
18 Bacterial Pollution Leading cause of impairment in coastal shorelines (275 miles impaired) and the second leading cause of violations in rivers and streams (82,100 miles impaired) (US EPA 2007) 46% of 240 impaired water bodies in Texas do not meet contact recreation standards (TCEQ 2002) Bayous in and around Houston, TX are on the 303(d) list for water quality exceedances of indicator bacteria
19 Freshwater Standards in Texas (TCEQ) E. coli Fecal Coliform Geometric mean Single Sample Criteria Geometric mean Single Sample Criteria 126 MPN/dL 394 MPN/dL 200 MPN/dL 400 MPN/dL


20 Sources of Indicator Bacteria End-of-Pipe Diffuse
21 WWTP in BB/WO Sampled WWTP (< 1 MGD) WWTP not Sampled (> 1 MGD) n73; 8am and 10am Sampling

22 Comparison of Daily Flows (MGD) - TVF Predictions to Observed Flows Results presented for TCEQ Permit # WQ

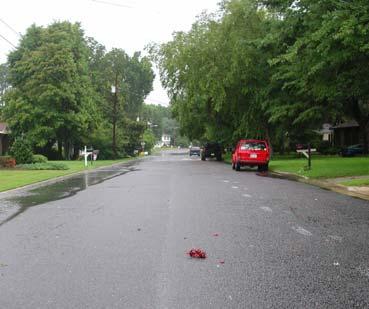
23 Sanitary Sewer Overflows
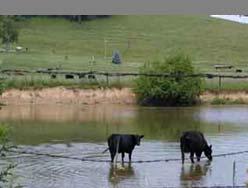
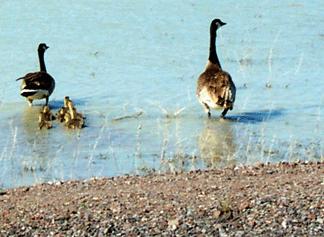
24 Pathogens in Urban and Less Urban Watersheds Urban watersheds Higher imperviousness Low flow maintained by WWTP Extensive sewer infrastructure Modified channels Piped surface runoff Less Urban watersheds Natural streams More pervious land Dispersed mammalian and avian populations Not effluent dominated Urban watersheds exhibit frequent and severe exceedances at all flow levels. Less urban watersheds exhibit localized and limited WQ violations.


25 Houston Area Pathogen Impairments #S (X Upper Oyster Creek #S (X (X #S (X (X #S (X #S (X (X #S (X #S (X #S (X #S (X (X #S #S#S #S #S #S (X (X(X (X (X #S #S (X(X (X Scott Bay (X Tabbs Bay Trinity Bay #S (X #S (X Upper Galveston Bay #S (X Cypress Creek Whiteoak Bayou Above Tidal Buffalo Bayou Above Tidal Oyster Creek Spring Creek Greens Bayou Clear Creek Lake Houston San Jacinto River Armand Bayou Clear Lake Dickinson Bayou Cedar Bayou Trinity River East Bay Lower Galveston Bay Gulf of Mexico

26 Houston Metro Watersheds Greens Buffalo White Oak Halls Brays Sims
27 Bacteria Indicator Concentrations As a Function of Development EC Geomean MPN/dL Greens WQ std Sims 37% 51% 59% 76% 79% % Low to High Intensity Developed Landuse Halls Eastern Houston Brays
28 E. Coli Concentration Range Single sample standard Geomean standard
29 E. Coli Exceedances in Brays 1E+06 1E Brays Bayou E.coli (MPN/dL 1E+04 1E+03 1E+02 Geomean Standard: 126 MPN/dL 1E+01 1E+00 0 km is at boundary of Segment 1007B with Segment 1007 Legend Maximum River km Geometric mean Minimum

30 E. Coli Geomeans BB/WO
31 Time Series - BB Shepherd Dr., Buffalo Bayou Fecal Coliform (cfu/100 ml) 1e+6 1e+5 1e+4 1e+3 1e+2 1e+1 1e+0 1/1/76 1/1/84 1/1/92 1/1/00 Water Quality Standard (400 cfu/100 ml) Whiteoak Bayou Buffalo Bayou
32 E. coli Time series Greens Bayou Station MPN/dL Std Station MPN/dL Std E. coli MPN/dL E. coli MPN/dL /12/00 01/29/03 07/17/05 01/03/08 Date 10 08/12/00 01/29/03 07/17/05 01/03/08 Date Regression analysis of log transformed E. coli data vs. time showed significant trends (p < 0.05) at 18 % of total 85 stations analyzed
33 Indicator Bacteria Concentrations Influenced by seasons and rainfall: About 22% of Metro stations (n = 60) exhibited statistical differences (p<0.05) between warmer and cooler months About 60% of stations had a higher geomean during warmer seasons About 50% of stations (n = 25) exhibited a significant negative correlation (p value < 0.05) between number of days after rain and E. coli Rainfall raises E. coli concentrations beyond their background levels
34 Correlation between E. coli and Flow E. coli MPN/dL Station Eastern Houston E. coli Flow Flow cfs R 2 = 0.78 R 2 = 0.74 E. coli MPN/dL Station Halls Bayou E.coli Flow Flow (cfs) 10 5/15/06 5/18/06 6/20/06 7/17/06 7/20/ /15/06 5/19/06 6/20/06 7/17/06 7/20/06 0 Date Date
35 Correlation between E. coli and Rainfall y = e x R 2 = 0.84 E. coli MPN/dL Previous 24 Hr Rainfall (inch)
36 Summer Heights 1000 Observed Flow Modeled Flow Rain 0 Flow (acre-ft/hour) Precipitation (in) 1 7/1/01 7/11/01 7/21/01 7/31/01 8/10/01 8/20/01 8/30/01 6
37 Summer Heights 1E+7 Observed EC 1E+6 1E+5 1E+4 1E+3 1E+2 1E+1 7/1/01 7/16/01 7/31/01 8/15/01 8/30/01
38 Sampling after June 2004 Rains Reservoir Storage (/10, acre-ft) /1/04 6/8/04 6/15/04 6/22/04 6/29/04 7/6/04 7/13/04 7/20/04 Reservoirs Closed Addicks Storage Barker Storage
39 Sampling after June 2004 Rains EC (MPN/dL) 1E+6 1E+5 1E+4 1E+3 1E+2 1E+1 1E+0 Pools Present 7/1/04 7/4/04 7/7/04 7/10/04 7/13/04 7/16/04 7/19/04 7/22/04 Addicks Discharge EC (MPN/dL) 1E+6 1E+5 1E+4 1E+3 1E+2 1E+1 1E+0 Pools Gone 7/1/04 7/4/04 7/7/04 7/10/04 7/13/04 7/16/04 7/19/04 7/22/04 Barker Discharge EC Standard (126 MPN/dL) Pools Present EC Standard Pools Gone (a) (c) Precipitation (in) Precipitation (in)
40 Sampling after June 2004 Rains EC Geometric Mean (MPN/dL) TSS Average (mg/l) EC Standard (126 MPN/dL) 0 Pools No Pools Excludes wet weather sampling data; average includes TBD1, TBD2, TBD3, 11142, and 11362

41 The Future Houston is expected to double its population by 2035 Current development practices not sustainable Development + global warming can be devastating Need to attenuate imperviousness Need to manage diffuse sources of pollution (BMPs)