Sustainable Manufacturing
|
|
|
- Lee Adams
- 5 years ago
- Views:
Transcription

1 Sustainable Manufacturing A Comprehensive Strategy Sabine Klages-Buechner Manager, International Government Affairs OECD Workshop, Copenhagen, Denmark June 21, 2007

2 2 DuPont in 1802 DuPont in employees 1 site 1 country 1 product 12 customers 60,000 employees 210 sites > 75 countries ~ 500,000 SKU s > 400,000 customers $36 billion investment $1.3 billion investment in R&D $27 billion revenue
3 3 Our Mission The creation of shareholder and societal value while we reduce the environmental footprint along the value chains in which we operate. Our Vision To be the world s most dynamic science company, creating sustainable solutions essential to a better, safer, healthier life for people everywhere. Core Values Safety and Health Environmental Stewardship Highest Ethical Behavior Respect for People
4 4 Supply Chain Societal Issues Manufacturing Climate Change Markets Population Growth Don t do the wrong thing just more efficiently but do the right thing more sustainably! Food Energy Health Environmental Degradation Biodiversity
5 The key to start with : Goals, Planning, Measurement, Reporting and Continuous Improvement
6 6 First Goal: 1990 s for 2000 Footprint Reduction Parameter Goal Air Toxics (60%) Air Carcinogens (90%) Hazardous Waste (Dry) (35%) Energy Flat GHG Emissions (40%)

7 Progress toward Goals Global Planning, Measurement and Reporting 7 Businesses prepare annual Environmental Plan Sites provide waste and emissions data to Corporate database Step 1: Define Plan Measure - Improve Reports due by May 1 of each year to web-based system Corporate team conducts quality assurance of data Data is compiled to meet external reporting commitments 80/20 Analysis
8 8 80/20 Cost Benefit Analysis Project costs, savings and environmental benefits are reviewed and compiled in the corporate environmental plan Experience: 80% of the waste and emissions reductions can be accomplished for 20% of the total cost Most cost effective projects are recommended for implementation Less efficient projects are held for future review and potential improvements Percent of total waste reduced Efficient Marginal 80/20 Point Environmental Index = Percent of total implementation cost
9 9 Commitment to Continuous Improvement DuPont is a strong believer in the Continuous Improvement of existing manufacturing practices and evolution of the design of new facilities to reduce environmental footprint US Toxic Release Inventory 100 Global Greenhouse Gases Millions of Pounds/Yr Billions of Pounds of CO2 Equivalents HFCs, PFCs, CH4 10 CO
10 10 Continuous Improvement Processes Senior leadership selects focus areas and identifies targets Regions and businesses can add to these goals Accounting systems are defined to track progress Competency Centers and specialists are made available to provide specialized technical assistance and to create best practices Projects and programs are typically funded within operating budgets Progress is reviewed by senior leadership quarterly and annually Tools Management Practices Energy Efficiency Best Practices for Pollution Prevention
11 and don t forget your most valuable asset: People
12 12 Reward Employee Initiatives Annual Sustainable Growth Excellence Award Nomination period open March 15 to May 1 Categories include: Reducing DuPont s Footprint Goal of Zero Injuries, Illnesses, and Incidents- Goal of Zero Waste and Emissions- Reduced Use of Depletable Raw Materials and Energy Serving the Marketplace Products that reduce greenhouse gas emissions- Revenues from non-depletable resources Products that protect people Stakeholder Engagement
13 The early years achievements
14 14 First Goal: 1990 s for 2000 Footprint Reduction Parameter Goal Air Toxics (60%) Achieved all goals ahead of time Air Carcinogens (90%) Hazardous Waste (Dry) (35%) Energy Flat GHG Emissions (40%)
15 15 Supply Chain Societal Issues Manufacturing Climate Change Markets Population Growth Food Energy Health Environmental Degradation Biodiversity
16 16 Cradle-to-Grave LCA LCA System Raw Materials Energy Recycle MS clip art style 592 Transport Transport Transport Raw Material Extraction Product Manufacturing Product Use Waste Management Co-Products Air Emissions Waterborne Wastes => environmental impacts, e.g. energy consumption, greenhouse gases, etc. Solid Wastes
17 Environmental Footprint along the Value Chain 17 Raw Materials Intermediates Products Use & Maintenance End of Life Cradle-to-Gate Process Cradle-to-Grave
18 18 Set New 2010 Goals More Site Footprint Reduction Energy in 2010 flat with 1990 Down 7% in % reduction in CO2-equivalent greenhouse gas emissions from global operations versus 1990 base Down 72% in % renewable energy at costs competitive with best available fossil fuels Almost 6% in 2005, saving $10 million per year 25% of revenues from non-depletable feedstocks 17% in 2005
19 19 Carried Forward Goals Footprint Reduction Parameter Goal Air Toxics (60%) Air Carcinogens (90%) Hazardous Waste (Dry) (35%) U. S. TRI Releases Energy Flat GHG Emissions (40%) 2005 Actual (76%) (92%) (51%) (80%) (7%) (72%) Note: Production increased 40% during this period.

20 20 Supply Chain Societal Issues Manufacturing Climate Change Markets Population Growth Food Energy Health Environmental Degradation Biodiversity
21 DuPont s new 2015 Sustainability Goals We are reducing DuPont s footprint Greenhouse Gas Emissions Water Conservation Fleet Fuel Efficiency Air Carcinogens Independent third-party environmental management systems verification 21 We help others to reduce their footprint Environmentally Smart Market Opportunities from R&D Efforts Products that Reduce Greenhouse Gas Emissions Revenues from Non-Depletable Resources Products that Protect People


22 22 Broad Range of Opportunities Refrigerants with lower greenhouse warming potential Automotive finishes with lower VOC content Coatings and engineering polymers based on renewable materials


23 DuPont Refrigerants Vision The Science of Cool 23 We will use our science and technology, market knowledge and global reach to provide sustainable materials and solutions to enhance personal comfort; enable food preservation; improve industrial processing and reduce environmental footprints. Next Generation Refrigerants & Cooling Technologies Mobile A / C Stationary A / C Stationary Refrigeration Refrigerant Fluids Emission Reducing Seal Technologies & System Monitoring Lubricants & Secondary Fluids Not in Kind Cooling Technologies


24 24 Reducing reliance on fossil fuels through bio-based materials DuPont has nearly a dozen business opportunities for bio-based materials using renewable resources. Applications Fibers, fabrics and carpeting made from DuPont Sorona, a polymer derived in part from corn Biobutanol, an advanced biofuel being developed in partnership with BP More under :


25 25 DuPont Biorefinery Value Chain Carbohydrates to Fuels & Chemicals Agricultural Inputs Plant Feedstocks Conversion to Sugars Fermentation Processes Biofuels Biochemicals Seed Crop Protection CO 2 Sugar Starch Ethanol Biobutanol Biochemicals Bio-PDO TM Cellulose Differentiated Products Biofuels


26 26 Bio-PDO and Sorona Commercialization Loudon Site Feb TATE & LYLE


27 DuPont - BP Biofuels Partnership Biobutanol Development & Launch 27 RENEWABLE FEEDSTOCKS WORLDWIDE FUEL MARKETS BIOBUTANOL Powerful partnership Shared commitment Global reach Complementary capabilities

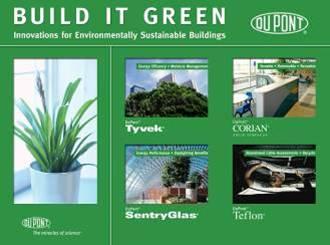
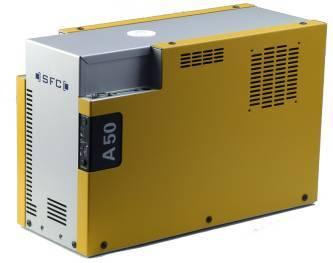
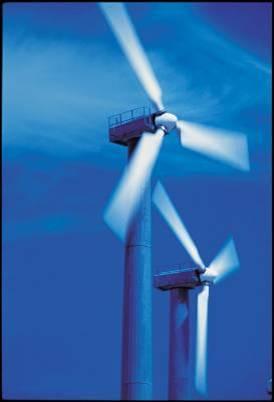
28 Other Market Opportunities 28 Tyvek Housewrap Nomex in windmills Fuel Cells
29 Other Technological Opportunities, e.g. Green Chemistry Need Development of new formulations Design of new chemical processes Predictable regulatory environment that allows for flexibility in solutions Available capital and time Expected Outcome Inherently safer products and / or processes Less waste / pollution / energy use (balance) More cost efficiency 29
30 30 Current Barriers Investment Infrastructure and integration Tax code treatment of investment and depreciation Short compliance time lines Environmental regulations often geared toward control equipment rather than emissions Technology gaps
31 But most importantly: It all makes economic sense..
32 32 Flat Energy has Saved Real Money Since 1990, production volume grew by 40% while energy use remained flat Cumulative $20-60/bl of oil = $3.0B Production 20 MM barrels of oil Baseline = ¼ Quad Btu Energy Use $800 MM or 60 cents per share Energy efficiency improved due to portfolio changes, cogeneration, yield improvements, capacity utilization, better uptime and conservation measures.
33 Sustainable Manufacturing is Good for Business Energy costs saved > $3.0 Billion 33 Renewable energy saves more than $10 Million/yr. Total Environmental costs reduced >$250 Million per year Hidden Capacity = hundreds of $ Millions in reduced investment (1 st pass yield improvement) Waste reduced = product sold Improved Operational Excellence Green House Gas Credits sold on Chicago Climate Exchange DuPont reputation transformed Don t do the wrong things just more efficiently, but do the right things more sustainably!
34 34