Estimating Solar Radiation and Photovoltaic System Performance, the PVGIS Approach
|
|
|
- Laurence Murphy
- 5 years ago
- Views:
Transcription
1 AFRETEP 1 ST Regional Workshop Kampala, Uganda Estimating Solar Radiation and Photovoltaic System Performance, the PVGIS Approach Thomas Huld European Commission, Joint Research Centre Ispra, Italy
2 Overview of talk Introduction: why solar energy Estimates of solar radiation over wide areas, data and methods Methods for estimating the performance of photovoltaic systems Introduction to PVGIS Hands-on experience with PVGIS
3 Why (sometimes) Solar Energy? Rising cost of fossil fuels Falling cost of solar energy Reduced dependence on energy imports Less dependent on extensive grid infrastructure Suitable for decentralized deployment Climate change! Of course, most of this goes for other renewables

4 Comparison Diesel vs. PV minigrids Blue: diesel is cheaper Yellow: PV is cheaper Calculation from 2010 Since then: Effects of Diesel Subsidies! Diesel prices increased PV prices decreased Source: Szabo, Bodis, Huld, Moner Girona, Env.Res.Lett. (2011)
5 Solar radiation estimates Solar radiation quantities Estimates based on ground station measurements Types of measurements (see also talk by W. Zaaiman) Available data sets Interpolation methods Satellite-based estimates Methods


 onto a plane that is normal to the direction of the")
6 Solar radiation quantities Global horizontal irradiation (GHI) All the light that arrives on a horizontal plane, from sun, sky, clouds Diffuse horizontal irradiation (DHI) All the light arriving from sky and clouds, but NOT directly from the sun Direct normal irradiation (DNI) The light that arrives directly from the sun (and the bright patch around it) onto a plane that is normal to the direction of the sun
7 Solar radiation measurement databases Baseline Surface Radiation Network (BSRN) Generally very high quality Around 40 stations around the world Measurements of GHI, DHI and DNI + other meteorological parameters, including long-wave infrared radiation Data periods not the same for all stations Geographical coverage rather unequal Widely used for validating satellite-based solar radiation estimates
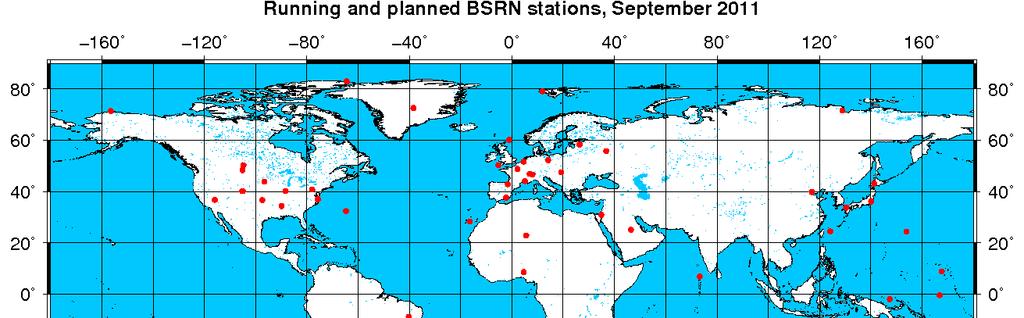

8
9 Solar radiation measurement databases (2) World Radiation Data Center Large number of ground stations Normally only GHI available Some stations with decadal time series Quality less certain than BSRN European Solar Radiation Atlas Large number of stations,coverage limited to Europe Data somewhat old, Used for first version of PVGIS (European database)
10 Ground station interpolation Interpolation allows you to estimate the solar radiation in areas lying between the ground station locations. A number of GIS systems can perform such an interpolation (kriging, interpolation by spline functions, etc.) Interpolation accuracy decreases with increasing distance between stations, stations must be representative of the climates in the area. Data must be homogeneous (same time period) Interpolation used for first European PVGIS version, largely using the open-source GRASS GIS
11 Satellite-based solar radiation estimates Advantages: Coverage of large areas with almost uniform resolution Continuous data collection over many years Raw data quality consistency Few sources of data, often free for non-commercial use Disadvantages: Not a direct measurement of ground-level radiation Models needed for the calculation of solar radiation Quality of model varies with location Very large amounts of data (terabytes)
12 Ground stations or satellites? At the site of the measurement, ground station data are superior to satellite estimates More than 30km from station, satellite methods are generally better than station data + interpolation Satellite data may have particular problems, for instance in the presence of snow Both methods have problems in very complex terrain such as mountains Measurements can validate satellite data
13 Types of satellite data Geostationary satellites High time resolution minutes Reasonable spatial resolution (few km) Quality of solar radiation estimate varies, lower at the edge of the images Polar-orbiting satellites Low time resolution (1-2 images per day) Higher spatial resolution (1km or less) Global coverage Modelling less advanced, still more uncertain

14 Meteo image example (Meteosat East)

15 What we re trying to calculate What the satellite sees
16 Overview of models used in CMSAF The raw data are taken from two different classes of satellites, Meteosat First Generation (MFG) and Meteosat Second Generation (MSG). These have different instruments measuring different types of radiation, so different algorithms must be used for the solar radiation estimates.
17 Clear-sky radiation calculation First step is a calculation of the radiation without the influence of clouds. This gives the clear-sky irradiance Calculation based on radiative transfer calculations. Very accurate but very time-consuming. Requires knowledge of time-varying components of the atmosphere, such as water vapour, aerosols and ozone. MAGIC algorithm used for both MFG and MSG (Müller et al., 2009)
18 Calculation of the effects of clouds (MFG) MFG: Heliosat method to estimate the effects of clouds using the actual albedo of a pixel in the image, relative to the reference albedo for the given pixel. Reference albedo is assumed to correspond to near-clear-sky conditions. Information from visible channel of MFG instruments
19 Calculation of the effects of clouds (MSG) Use of several instruments on board MSG, such as the Global Earth Radiation Budget (GERB). Radiative transfer calculations for improved accuracy. Better detection of clouds. More accurate treatment of irradiance on very bright ground (deserts).
20 Validation against ground station measurements Full station list in the lecture notes MSG results (global horizontal irradiation) have almost no overall bias, MFG shows positive bias of ~2%. Standard deviation of individual station bias values give values of 5.3% for MSG and 5.5% for MFG (European stations). The combined value is 4.9%. Excluding high mountains, the value is ~3.8%. These uncertainties are larger than that of most other effects influencing PV performance.
21 PVGIS solar radiation databases Europe: Classic database from ESRA ground station data and interpolation, 1km resolution over Europe to the Urals. Africa: Helioclim database,based on MFG satellite data , original resolution 15 30km, downscaled to 2km Most of Europe and Northern Africa: new CM-SAF database from CM-SAF based calculations of solar radiation from MFG and MSG. Spatial resolution of km

22 Relative difference (%), PVGIS-classic PVGIS-CMSAF


23 Relative difference (%), PVGIS-classic PVGIS-CMSAF


24 Global optimum angle irradiation Direct normal irradiation

25 Optimum angle for solar irradiation Note: optimum angle for solar radiation and grid-connected PV, not for off-grid applications
26 Effects of shadows from terrain By calculating the height of the horizon around your location it is possible to estimate the effect this has on the total solar irradiation (and hence PV output) PVGIS uses the SRTM-3 digital elevation model, with 3 arc-second (~90m) resolution between 60 S and 60 N. Importance of shadows depends also on the latitude, generally less important near equator

")
27 Example from Norway (59 N) Example from Kenya (1 N)
28 Other solar radiation databases The free NASA-SSE, global coverage, long-term averages of global horizontal irradiation, low resolution (1 lat/lon) ECMWF, global coverage, weather model reanalysis, 3- hourly values of global horizontal irradiance, freely available version has low resolution (1.5 lat/lon) SWERA, coverage for selected regions and countries, generally long-term average values, varying spatial resolution. CMSAF: daily or hourly irradiance maps free for download, at least for non-commercial use. Full Meteosat resolution (~3km)
29 Other solar radiation databases Selected commercial products Meteonorm, global coverage, generally long-term averages, runs as a PC software SOLEMI, data available from Meteosat satellites (Europe and Africa), maps and time series available, global and direct irradiance SolarGIS, data from Meteosat satellites (Europe, Africa and India), maps and time series, global and direct irradiance, downscaling to very high spatial resolution.
30 Summary of this presentation Solar radiation is (by far) the most important factor in estimating the performance of solar energy systems Maps of solar radiation may be made using ground station data or with satellite data. Generally, for large geographical areas, the satellite data are better PVGIS offers a free database of solar radiation data for Europe and Africa, based on satellite data. Uncertainty in solar radiation estimates is probably the largest source of uncertainty in solar energy.
31 PV systems and their performance Types of PV systems Grid-connected PV systems Off-grid PV systems Models for performance of grid-connected PV systems Models for performance of off-grid systems


32 PV systems come in different sizes Large Medium Small 11 orders of magnitude range in power
33 Grid-connected PV systems PV systems with inverters that convert DC current from the PV modules into AC current for the grid Inverter optimizes the power output of the PV modules Dependent on the presence of the grid current (usually) Power that is not used locally is sent to the grid Normally no local electrical energy storage Fixed mounting or tracking systems Could also use concentrating PV
34 Off-grid PV systems Independent of the electricity grid Mostly small installations (<1kWp) Often has local battery storage May have an inverter but could also have just a simple charge controller, output normally DC Used for telecommunications, street lighting, power for single households or buildings, water pumping, etc.
35 A half-way house: minigrids Independent of the general electricity grid but serves a small local grid Size from a few kwp to a few tens of kwp Normally has an inverter, nearly always has battery storage, output normally AC May be made in combination with diesel generators or other renewable energy sources (wind, small hydro)
36 PV system performance The output of a PV system is of course mainly influenced by the amount of solar radiation that arrives at the surface of the PV modules of the system. But there are a number of other effects that can be important.
37 The amount of solar radiation itself depends on the way the system is made. For fixed PV systems the incident solar radiation depends on inclination and orientation PV systems can also be mounted on a tracking system. The incident solar radiation depends on type of tracker Concentrating PV systems make use only of the direct normal irradiation
38 PV power, a few definitions The power of a PV module/array is given as the nominal or peak power, defined as the maximum output power under the following conditions: In-plane irradiance of 1000W/m 2 Module temperature T=25 C Peak power is measured in W p (watt-peak), kwp or MWp for larger systems
39 The theoretical power is then: P = P nom G /1000 where G is the received solar irradiance (W/m 2 ) and P nom is the peak power, in kw p. The ratio between actual power and the theoretical power is called Performance Ratio (PR). We can talk of module PR (PR m ) or system PR (PR s ).
40 Effects that influence PV performance (1) Shadows, also partial, reduce the PV performance(*) Dust, dirt, frost and snow on modules. Depends on location and also on rainfall and module inclination Reflectance of module surface. Depends on module type and inclination (and geographical location) (*) PV conversion efficiency depends on temperature and irradiance (more about this later) (*) For some PV technologies, efficiency depends on the sunlight spectrum
41 Effects that influence PV performance (2) Grid-connected systems Losses in the DC/AC conversion by the inverter (may depend on the power level) Losses in cables, connecters etc. Grid outage, causing the PV system to shut off
42 Effects that influence PV performance (3) Off-grid systems Mismatch between PV module and battery voltages, or Mismatch between PV module and load voltages Losses in charging and discharging battery Losses in cables, connectors etc. Losses when battery is full and not all power can be used (*)
43 Effects that influence PV performance (4) Minigrid systems Losses in the DC/AC conversion by the inverter (may depend on the power level) Losses in cables, connecters etc. Losses in charging and discharging battery Losses when battery is full and not all power can be used (*)
44 A bit of PV cell theory (not too much, promise!) Electrical characteristics of a PV module Short-circuit current, I sc Power is the area of the rectangle Open-circuit voltage, V oc
45 Electrical characteristics, contd. P=V I Maximum power point (MPP)
46 PV power depends on module temperature Temperature coefficient is normally negative
47 Model for PV performance at MPP Instantaneous PV power is described as P = P( G, T mod) where G is the received irradiance and T mod is the module temperature: T mod = T air + k T G
48 Module performance for different PV types Models included in PVGIS
49 PVGIS calculations of grid-connected PV Shadows from hills and mountains Model for shallow-angle reflectivity at module surface Model for PV power as function of irradiance and temperature (as just described) All other losses are lumped in a single user-defined system loss.
50 Performance of off-grid PV systems For small PV systems that are connected directly to a battery with a simple charge controller but no inverter, the interaction between the module and the battery becomes important. If there is a mismatch between the module voltage and the battery voltage, the system performance may suffer.
51 PV batteries in a nutshell Batteries for PV systems are normally lead-acid batteries like car batteries Special construction for improved deep discharging Full discharge damages the battery, good solar batteries can be ~70% discharged Typical battery voltage 12V or multiples (24, 48 ) Size normally measured in Ampere-hours (Ah) for a given voltage
52 Battery electrical characteristics 12V battery Capacity 50Ah
53 Electrical characteristics of PV-battery systems Module: c-si 36 cells P nom =72W Battery: 12V 50Ah
54 Effect of cable resistance If there is a non-zero resistance between the module and battery, the relation between module and battery voltage is: V mod = Vbat + RI This can seriously affect the performance of the system.
55 Effect of a 1Ohm resistance
56 Models for off-grid PV system performance To estimate the actual performance of an off-grid PV system, real time series of solar radiation and power consumption values should be used. The actual simulation of the system state can be done with varying level of complexity.
57 General model outline For each time interval (hour or day): Add energy produced by PV module Subtract energy consumed If battery becomes full, cut off PV power production If battery becomes empty (lower charge state limit), cut off consumption
58 Different model features 1. Hourly data for production and consumption. Detailed model for PV-battery interaction. 2. Hourly data for production and consumption. Simple model for PV-battery interaction. 3. Daily data for production. Consumption divided into day and night. Simple model for PV-battery interaction. This is the model used in PVGIS.
59 Model comparison Model output results given in the lecture notes Conclusion: daily model gives reasonable results with an overall performance ratio of ~65% considering other system losses (cable losses, dirt on modules, etc.) This conclusion is for a well-designed system with a good good balance between PV module and battery, and not too high resistive losses.
60 Effect of resistive losses If there is a significant resistance between module and battery, there will be losses in the resistor (cable, connectors), but also a loss due to non-optimal performance of the module
61 Example: Location in Algeria, 75W PV, 50Ah battery, 300Wh daily consumption, simulation with full model for 360 days. Total desired consumption: 108kWh R (Ohm) E (kwh) Apart from the resistive losses themselves, the total energy output decreases with increasing series resistance
62 Summary of this presentation PV energy output depends on a number of different factors. Methods for estimating PV output are different for gridconnected and off-grid systems PVGIS contains models for a number of different factors affecting grid-connected PV performance Simple off-grid model can be tuned for good performance by comparison with more detailed models (but experimental data would be nice)
63 What is it? The PVGIS web application What can it do (and not do)? How is it used?
64 The PVGIS web application (2) PVGIS is a web application (runs in a web browser) which allows users to get information about solar radiation and PV system performance at any place in Europe and Africa

65 Click here Then click here
66 PVGIS features overview Calculation of grid-connected PV energy yield Monthly solar radiation and ancillary data values Average daily profile of solar radiation Calculation of off-grid PV system performance All solar radiation estimates (and solar radiation used for PV estimates) downscaled using horizon information with 30 90m resolution.
67 Grid-connected PV energy yield Calculation takes into account shadows from hills and mountains Calculation for arbitrary slope and orientation Finds optimum slope and orientation Calculation for fixed systems and various tracking options Models for effects of reflection, temperature and low irradiance, for a number of PV technologies Output as tables and graphs

68 Interface for grid-connected PV energy yield estimation Useful help link!

69 Grid-connected PV estimator, sample output As table values As a graph
70 Monthly average of solar radiation Values of radiation are long-term monthly averages, given in Wh/m 2 /day Other values of interest can be chosen as well: Diffuse to global ratio, showing the importance of the diffuse light at the chosen location Linke turbidity, an indication of the clearness of the atmosphere Monthly optimum angle (Europe only so far): monthly averages of temperature
.")
71 Interface for monthly radiation estimates (Africa). Temperatures are not available here.

72 Sample output from monthly radiation estimates Negative optimum angle means north-facing!
73 Average daily irradiance profile Options to get values for the average irradiance during a typical day in each month Fixed angle or 2-axis tracking Shows also average temperature variation during the day (for Europe) Includes the effects of shadows

74 Interface for daily irradiance profile. Version for Africa without temperatures


75 Output as table (part) Output as graph

76 Horizon output from daily irradiance option
77 Real vs. average daily profile The average clear-sky profile from PVGIS is similar to the irradiance on a clear day. But the average real-sky profile looks nothing like a real day! Clear day Not so clear day!
78 Off-grid PV system estimation Calculations for simple off-grid PV systems with battery but no inverter (simple charge controller) Uses daily irradiation data and assumes a constant daytime and nighttime consumption (entered by the user) Gives average monthly energy output Gives occurrence of battery full (so no further charging possible) and battery empty (so no power available)
79 Estimating PV minigrid performance. is not available yet (but I m working on it)

80 Optimal inclination is for annual irradiation, not necessarily for off-grid output!


81 Off-grid output tables Energy output, battery full/empty Battery charge statistics
82 Other PV system design tools (selected) PVSyst, PC application for designing grid-connected PV systems ( RetSCREEN, PV design tool that runs in Excel, free ( HOMER, PC application to design minigrid systems, including PV, wind, hydro, diesel generators, etc. (homerenergy.com) SolarGIS, online tool like PVGIS, but with extra bells and whistles, commercial (solargis.info)
83 Quick comparison with PVGIS Advantages of other tools: Generally have lots more options, for instance HOMER can combine PV with other electricity generators Some cover geographical areas that PVGIS don t Let you calculate costs of PV systems Should definitely be consulted when designing larger systems Disadvantages: More complicated to use, could be overkill for simple systems Data quality uncertain for Africa in particular Some are not free
84 Summary of this presentation PVGIS allows you to perform estimates of PV system performance with your web browser Grid-connected system estimates include a number of effects influencing performance, including temperature and terrain shadowing Solar radiation data available for Europe and Africa Off-grid calculator for design of small stand-alone PV systems, with simulation using long time-series of solar radiation data.