Using Compact Combined Constructed Wetland as Post Treatment for Biogas Wastewater
|
|
|
- Barrie O’Neal’
- 5 years ago
- Views:
Transcription


1 Using Compact Combined Constructed Wetland as Post Treatment for Biogas Wastewater Somanat Somprasert The Joint Graduate School of Energy and Environment King Mongkut s University of Technology Thonburi Assoc. Prof. Dr. Suwasa Kantawanichkul Department of Environmental EngineeringChiang Mai University

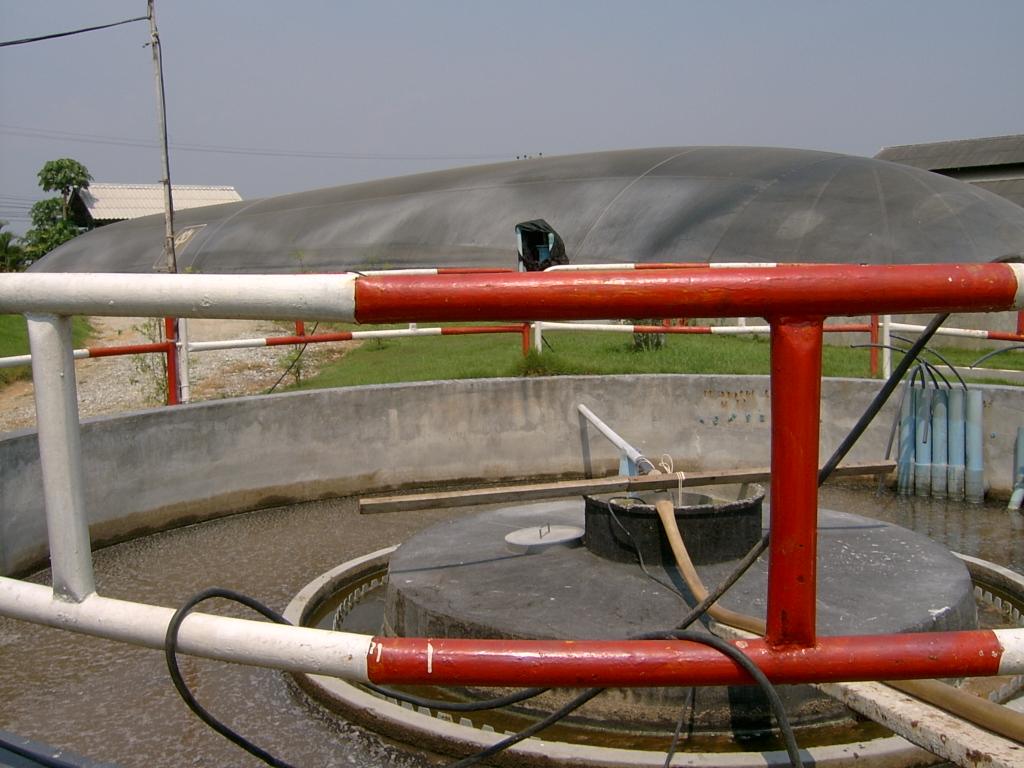
2 Biogas System in Pig Farm
3 Pig Farm Problems Pig manure Wastewater Noxious Odors Mosquito and other insects
4
5
6
7
8 Benefit of the Biogas system Advantage Wastewater treatment Biogas Energy Fertilizer from sludge Disadvantage! Can not remove Nitrogen and Phosphorus COD still higher than the pig farm wastewater standard of Thailand ( <400 mg COD L -1 )
9 Combined Constructed Wetland Constructed wetland Engineered systems designed and constructed to utilize the natural processes Combined constructed wetland Horizontal flow bed Vertical flow bed Design for nutrient removal
10 Horizontal Flow Bed Vertical Flow Bed
11 Compact Combined Constructed Wetland Vertical flow vegetated bed laid over horizontal flow sand bed Small area required
12 Methodology

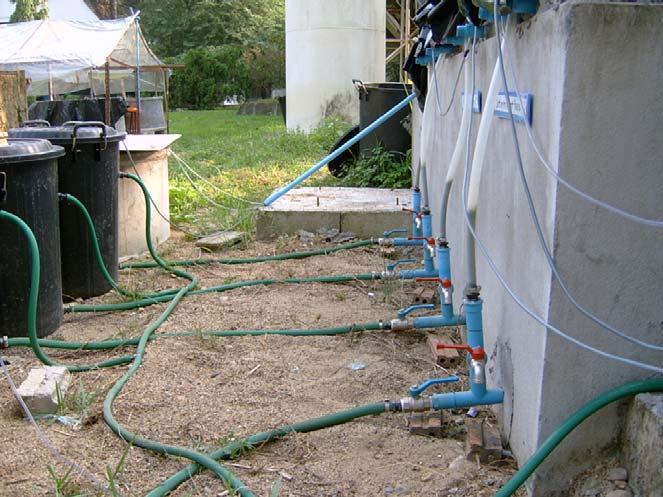
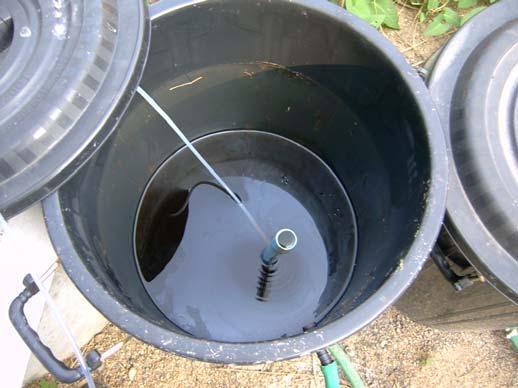
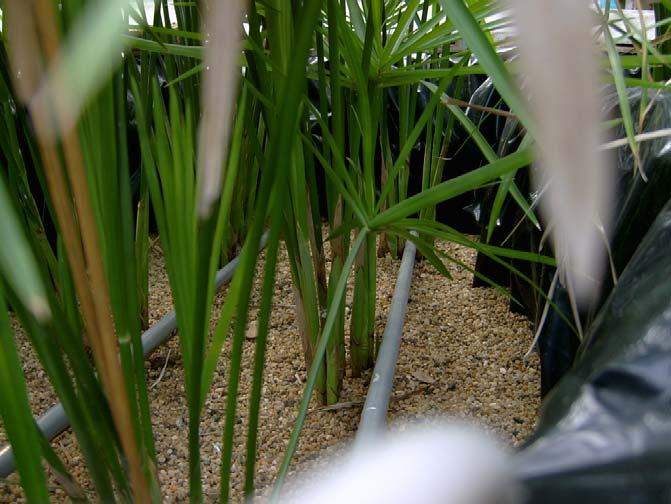
13 Reactor Four concrete tanks, 0.5x x1.0 m 3 Each tank was separated into two parts by a plastic PVC sheet Umbrella sedge 0.25 m interval 16 plants per square meter

14 Cyperus flabelliformis Rottb. Vertical flow Sampling point Sampling points Gravel Sand Stand pipe Wastewater storage tank with mixer Effluent storage bucket Horizontal flow Sand Effluent storage bucket Effluent to municipal sewer Sampling point 0.125m 0.75m 0.125m
15 Recirculation ratio 1:1 Intermittent feeding ( 4 hrs on 4 hrs off) Hydraulic Loading Rates, HLRs 4, 6, 8, 10, 12, 16 and 20 cm d -1 Hydraulic retention times Vertical flow bed 1 to 25 hours Horizontal flow bed hours


16 H-V H Effluent V Effluent
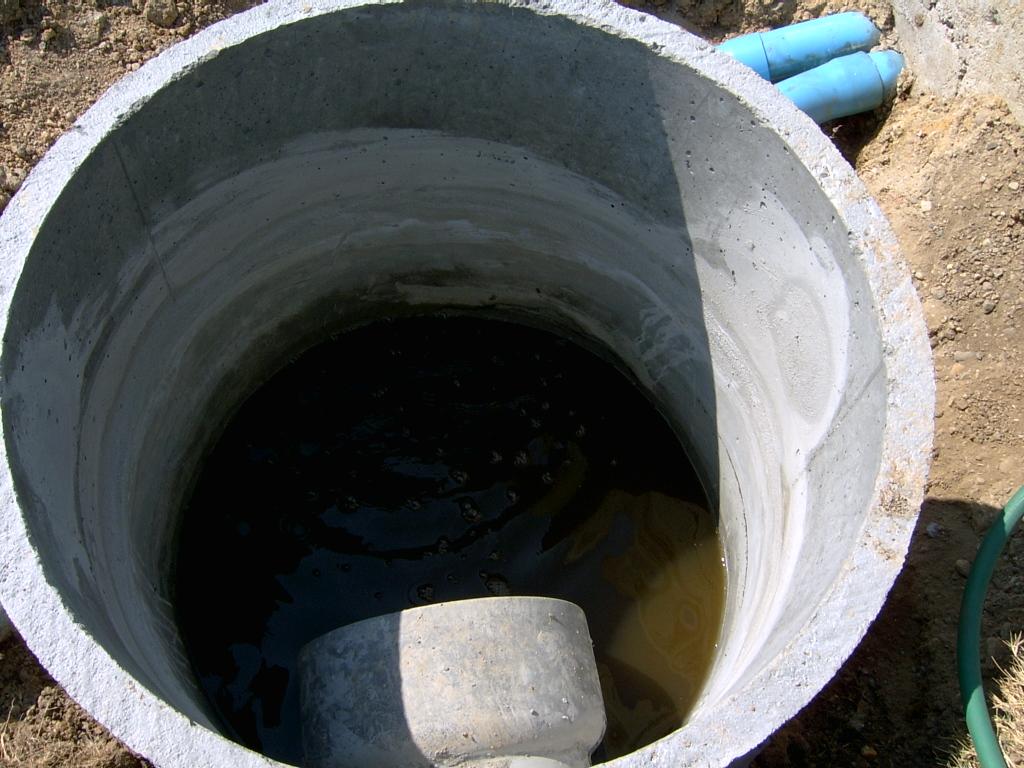
17 Wastewater Pig farm wastewater : effluent from anaerobic channel digester followed by UASB COD : 870 to 1,070 mg L -1 TN : 450 to 560 mg L -1 Nitrogen loading rate* 102 to 456 kgn ha -1 d -1 COD loading rate* 214 to 856 kgcod ha -1 d -1 * based on raw wastewater concentration
18 HLR 4 cm d - 1 and 16 cm d -1 November to March (winter) HLR 8 cm d - 1 and 12 cm d -1 April to June (summer) HLR 6 cm d - 1 and 10 cm d -1 April to August (summer and rainy season) Temperature : 21 to 32 C

19 At the beginning of the experiment
20
21 Removal Efficiency Nitrogen removal COD removal
22 Nitrogen removal Nitrogen removal rates was 323 kgn ha -1 d - 1 High nitrogen removal rate compare to the experiments in Taiwan (14-30 kg ha -1 d -1 ) Nitrogen removal efficiency were in the range of 52-83% Decrease when HLR increase
23 Nitrogen removal TN Removal efficiency (%) HLR, cm/d All Horizontal flow bed Vertical flow bed
24 Nitrogen removal TKN Removal efficiency (%) HLR, cm /d All Horizontal flow bed Vertical flow bed
25 Nitrogen removal Horizontal flow bed o Remove nitrogen in form of oxidized nitrogen o o NO 2,3 -N Denitrification o Denitrifier bacteria o 2.3 x 10 3 to 5.7 x 10 4 MPN
26 Nitrogen removal Vertical flow bed o Remove nitrogen in form of NH 3 -N N and organic N o Nitrification o Nitrifier bacteria 1.2 x 10 4 to 5.6 x 10 5 MPN o Plant uptake
27 Nitrogen removal Most of nitrogen was loss by volatilization, Accumulated in microbial cell and adsorb in sand and/or by Anammox process Nitrogen uptake by plant was in the range of 1-14% 1 14% highest at HLR 4 cm d -1
28 COD removal COD:BOD 5 COD removal rates 179 to 735 kgcod ha -1 d -1 COD removal efficiencies 79 to 97%
29 COD removal Removal efficiency, % HLR, cm/d All Horizontal flow bed Vertical flow bed
30 COD removal Similar COD removal efficiency in all hydraulic loading rates HLR 6 cm d -1 shows the highest COD removal efficiency Achieve the national effluent standard of COD for medium scale pig farm
31 COD removal Horizontal flow bed Denitrification occurred Large amount of denitrifier bacteria MPN Most COD was used in denitrification reaction Filtration Half of the influent COD was in the suspended form At HLR 8 cm d -1 Removal efficiency dropped FCOD closely to total COD
32 COD removal Vertical flow bed Input COD was already utilized in the denitrification process Left only COD in the difficult to degrade form Low COD removal efficiency in vertical flow bed

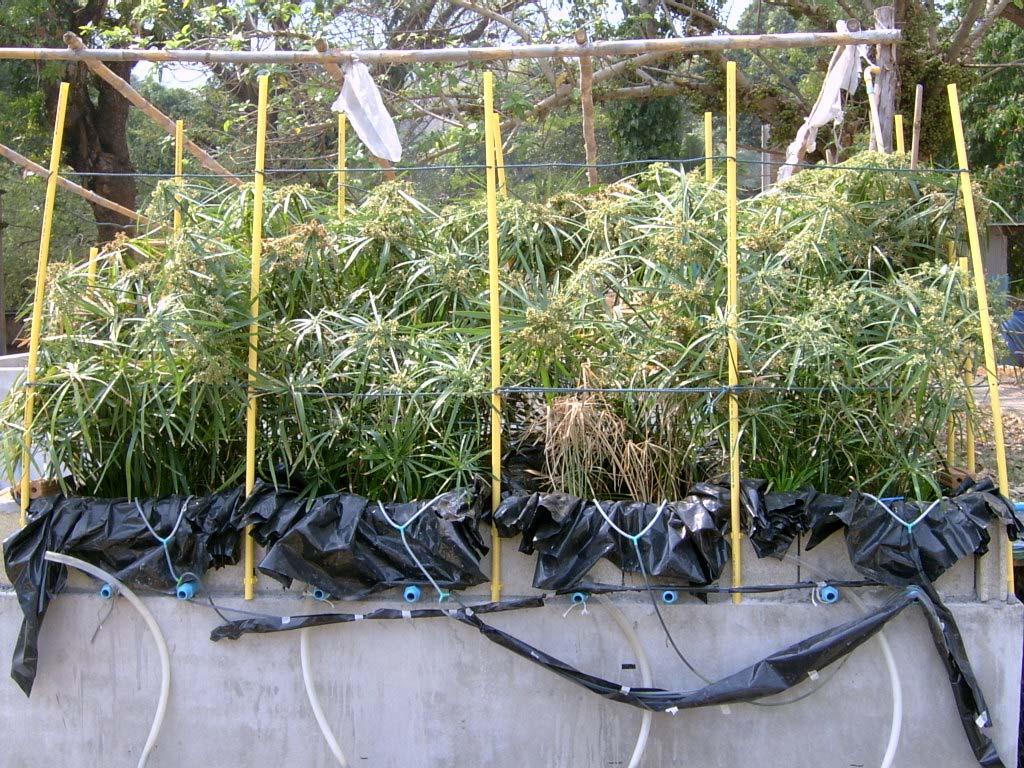
33 Dry season Plants

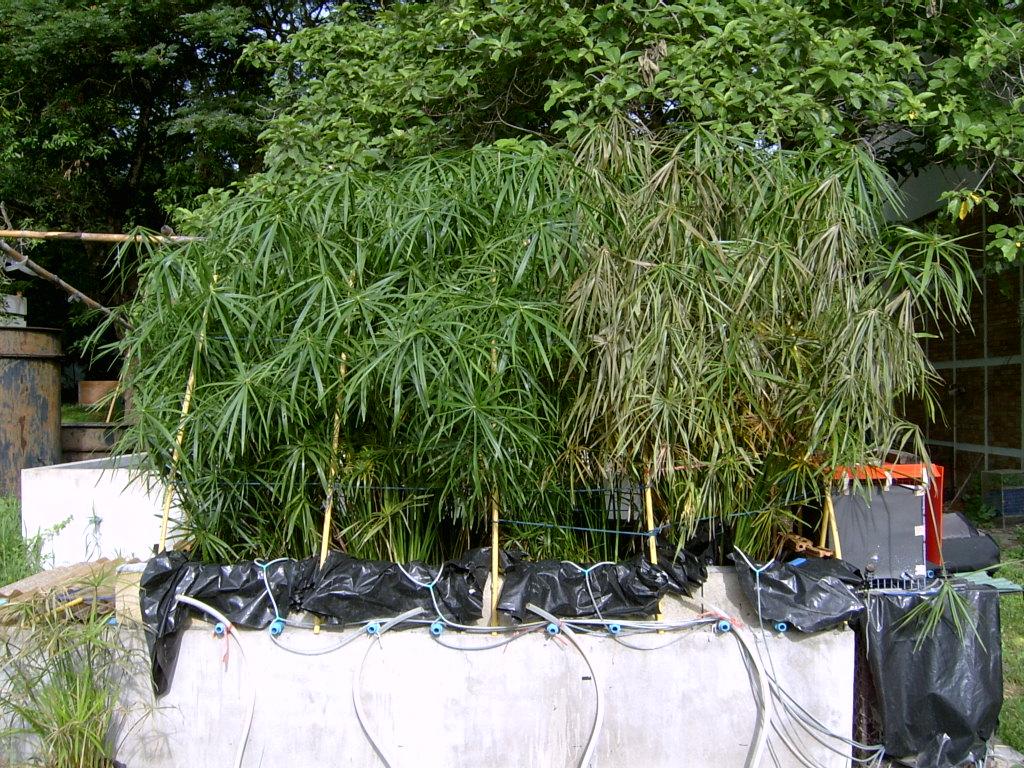
34 Wet season Plants


35 Plants Above ground : approximately cm (after 3 months) Below ground approximately cm (after 3 months)
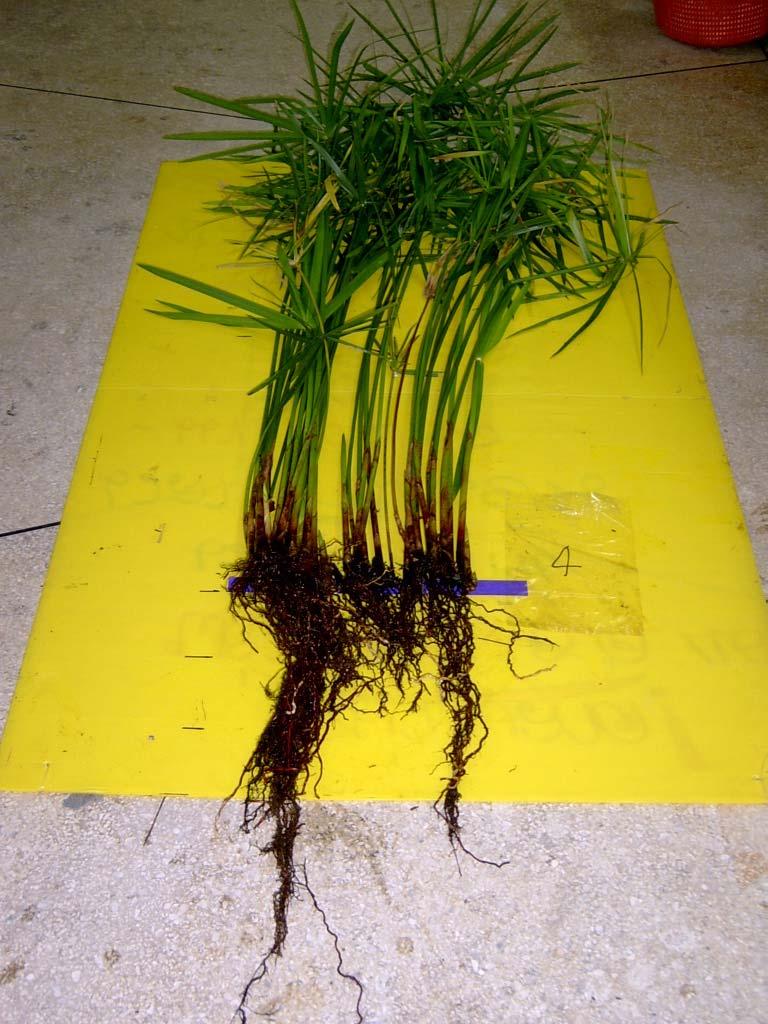
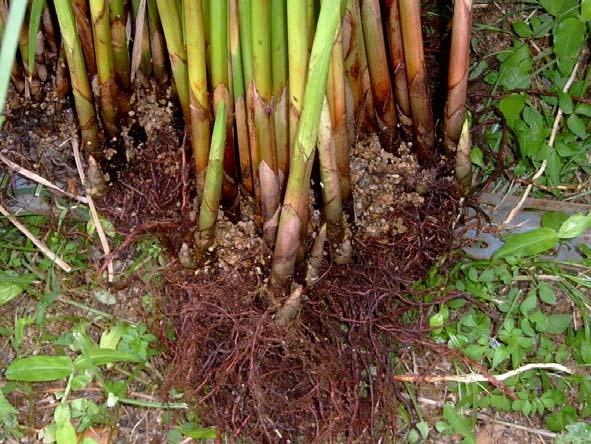
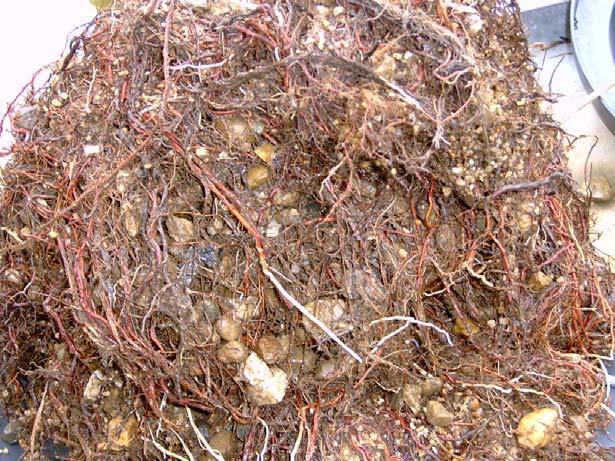
36 Plants
37 Conclusion High removal efficiency for COD and nitrogen The COD and nitrogen effluent achieve the national standard except in the high flow rate For COD < 400 mg L -1 For TKN < 200 mg L -1 Suitable to use as secondary treatment for
38 Acknowledgement Thailand Research Fund (RGJ. Program) The Joint Graduate School of Energy and Environment, King Mongkut s University of Technology Thonburi (JGSEE) Department of Environmental Engineering, Chiang Mai University CP Chomthong farm