Landfill NMOC Emission. LFG Header Samples and Corrective Measures. As Observed in Tier 2 NSPS Sampling Brad Albrinck AUTHORS NAME
|
|
|
- Lawrence Gallagher
- 5 years ago
- Views:
Transcription


1 Landfill NMOC Emission Positive PRESENTATION Bias Observed TITLE in LFG Header Samples and Corrective Measures As Observed in Tier 2 NSPS Sampling Brad Albrinck AUTHORS NAME
2 Discussion Outline Tier 2 NMOC sampling and why it is done Sampling Methodology Traditional geoprobe LFG header samples EPA LandGEM Model and how it evaluates NMOC emissions from landfills Case studies showing bias in header samples and corrective actions Conclusion
3 Tier 2 NMOC Sampling Performed in accordance with 40 CFR Part 60, Subpart WWW (being replaced by Subpart XXX) Landfills with a design capacity over 2.5 million MG must either install and operate a GCCS in accordance with 40 CFR (b)(2) OR demonstrate emissions under 34 MG/yr with Tier 1, 2, or 3 testing or pass Tier 4 Surface Scan Tier 2 is most common assuming Tier 1 exceeds 34 MG/yr
4 40 CFR Tests Equation Used in LandGEM Model Tier 1, C NMOC = 4000 ppmv NMOC as hexane Tier 2, C NMOC is determined by field tests via EPA Method 25c (local geoprobe or header samples) Tier 3, C NMOC is determined by field tests via EPA Method 2e (24in diameter 3 well cluster installed to 75% waste depth) Tier 4, does not use this equation. Emissions evaluated with quarterly surface scan, no CH 4 hits over 500ppm allowed
5 Tier 2 Testing Tier 2 testing 40 CFR (a)(3) Performed according to EPA Method 25c NMOC = Non Methane Organic Compounds» Hazardous Air pollutants (HAPs)» Volatile Organic Compounds (VOCs) NMOC concentration used to calculate NMOC emissions rate Results updated annually based on landfill waste intake. Field test performed every 5 years.
6 Sampling Methodology 1. Local Samples (geoprobe, LFG well, passive vent, leachate cleanout etc.) 2 samples per hectare up to 50 maximum 2. LFG Header Samples Sampled from common header pipe containing gas from the combined wellfield Take average of 3 samples, counts for the coverage area of the wellfield
7 Local Samples

8 Geoprobe Sampling
9 Header Samples

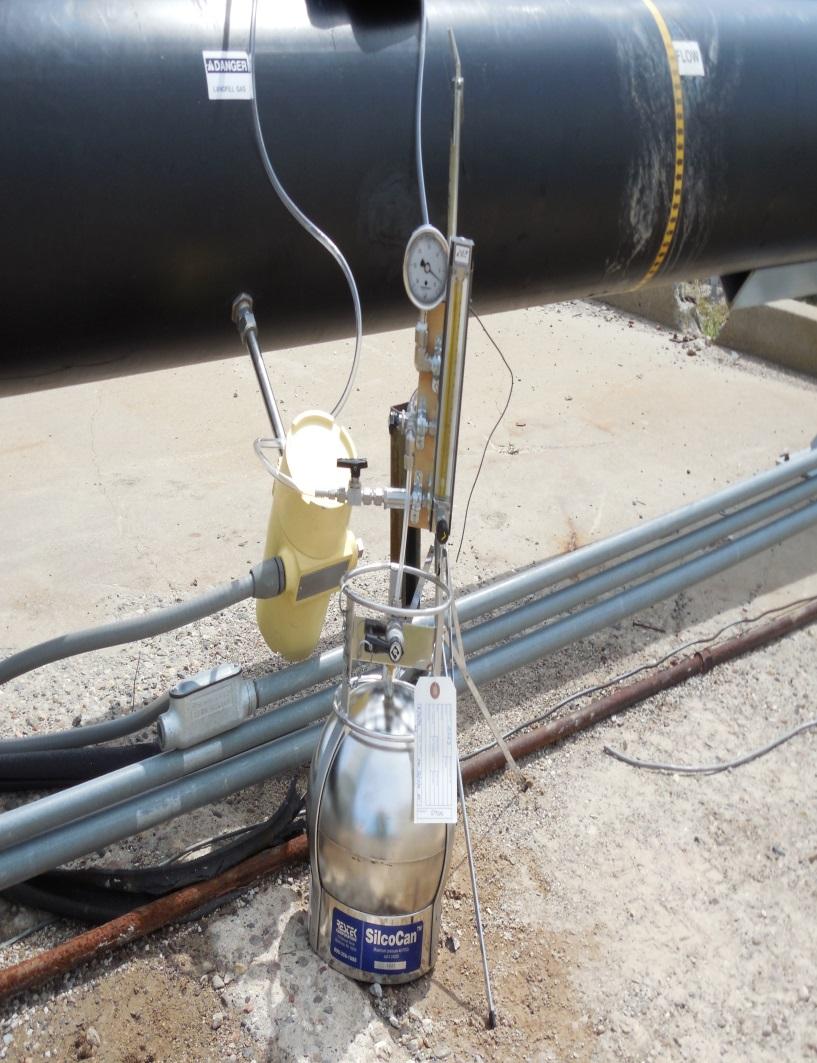
10 Sampling Train

11 LandGEM Model
12 NMOC Emissions from One Section of Waste USEPA LandGEM Model V3.02 Standard Tier 2 Inputs k = 0.05 y -1, Lo = 170m 3 /MG Hypothetical Site Specific NMOC Concentration 100 ppmv as hexane
13 NMOC Emissions from Entire Landfill Landfills accept waste over decades or longer The overall emissions of the landfill are added together The emissions from waste placed at day 1 are added to those placed on day 2 and so forth Cumulative emissions generally increase with time even if the waste amount does not change
14 Cumulative NMOC Emissions for a Landfill Accepting 100K TPY Over 50 Years USEPA LandGEM Model V3.02 Standard Tier 2 Inputs k = 0.05 y -1, Lo = 170m 3 /MG Hypothetical Site Specific NMOC Concentration 100 ppmv as hexane
15 Case Study 1 Landfill in Eastern Ohio 82% coverage by existing gas system 3 header samples taken to represent this 82% NMOC as carbon results: 1900, 2400, 1800 ppmv 9 geoprobe samples taken to represent the other 18%, 3 samples per can NMOC as carbon results: 820, 560, 1000 ppmv

16 Case Study 1 (Cont)
17 Case Study 1 (Cont) Landfill exceeded the 50 MG/Yr threshold The landfill decided to resample 1 year later using 50 local samples Combination of geoprobes and individual wells
18 Case Study 1 (Cont)
19 Case Study 1 (Cont) Eighteen canisters were analyzed containing 3 local samples each (1 can had 2 samples) Average concentration of ppmv as Carbon On par, and actually below the local samples from one year earlier Landfill was able to put off NSPS applicability
20 Positive Bias in Header Samples Landfill gas collection system header gas can be more heavily weighted to areas of higher gas production Landfill gas wells have individual flow rates that vary depending on Gas production in the area of the well Age and type of waste Flow control valve setting Vacuum applied to the well from the system Type and thickness of cover Spacing of surrounding wells Liquid levels within the well casing
21 Corrective Measures Sample from only local sampling points (more expensive) Attempt to normalize the wellfield so that each collector in the system is providing the same amount of flow during sampling. Generally this requires tuning the flow in the higher producing areas to match the lower producing areas.
22 Case Study 2 Landfill in Central Ohio Existing gas system coverage of entire landfill 3 samples taken from header to represent the entire landfill
23 Case Study 2 (Cont)
24 Case Study 2 (Cont) A preliminary sample was taken in May 2015 with a result of 2200 ppmv NMOC as carbon LandGEM analysis revealed this result would result in landfill exceeding 50 MG/yr threshold October 2015 two more cans sampled Wellfield was tuned to level out flows from each collector one day prior to sampling Two cans were analyzed at 1200 and 1500 ppmv NMOC as carbon
25 Case Study 2 (Cont) October 2015 (two weeks later) 3 cans analyzed for Tier 2 using same wellfield tuning method Results of 1100, 1300 and 1500 ppmv NMOC as carbon observed Landfill was able to put off NSPS applicability
26 Conclusions Positive bias can be observed in NMOC header samples when trying to do a weighted average by area such as in a Tier 2 Most at risk are sites with LFG collectors in newer waste placement areas Theoretically applicable to other compounds as well Corrective actions include doing only local samples or adjusting the wellfield to level out the flow from each collector Limited data on wellfield adjustment effectiveness Historical Tier 2 Sampling data and annual waste intake data should be considered when planning a Tier 2 Test
27 Questions?