Figure 1. Platte River Sub-Watersheds and Monitoring Locations.
|
|
|
- Paula Leonard
- 5 years ago
- Views:
Transcription

1 Figure 1. Platte River Sub-Watersheds and Monitoring Locations.
2 BL Pond 8 Hatchery Platte River at Fewins Rd 6 B. Creek to Hatchery Spring 2 Platte River at Stone Bridge 7 Platte River to Hatchery 3 Brundage Cr at Old Residence 8 Inlet to Pond 4 Stanley Creek 9 Pond Outlet 5 B. Spring to Hatchery 10 Platte River at Vets Park Figure 2. Hatchery Sampling Stations
3 16 17 Platte Lake Honor Platte River at Vets Park 14 Platte River at USGS 11 Carter Creek at mouth 15 North Branch at Deadstream 12 Platte River at Pioneer Rd 16 Lake Outlet at M - 22 Collison Creek 13 Platte Lake at Center - Deep 17 Figure 3. Lake and Tributary Sampling Stations for 2004.
4 Parameter Sampling List Frequency List S List L List C Hatchery Flow Dissolved Oxygen Count Brundage Spring to Hatchery S 2 per Week Phosphorus Temperature Weight Brundage Creek to Hatchery S 2 per Week Turbidity ph Platte River to Hatchery S 2 per Week ORP Inlet to Pond S 2 per Week Conductivity Discharge from Pond S 2 per Week Phosphorus Construction Bypass S 2 per Week Chlorophyll Storage Tank S 1 per Month Phytoplankton Weather Station S Event Zooplankton Production Data C 1 per Month Turbidity Weir Data C Seasonal Light Stream Secchi Depth Platte River at Fewins Road S 1 per Month Alkalinity Platte River at Stone Bridge S 1 per Month + Event TDS Brundage Creek at Old Residence S 1 per Month + Event Calcium Stanley Creek at Carmean Road S 1 per Month Reactive Silica Platte River at Vets Park S 1 per Month + Event Nitrate Carter Creek near mouth S 1 per Month TKN Platte River Pioneer Road S 1 per Month Weather Collison Creek near mouth S 1 per Month Platte River at USGS S 2 per Month North Branch at Deadstream Road S 2 per Month Lake Outlet at M-22 S 2 per Month Lake Platte Lake at center-deep Station L 2 per Month Sediments Special Special Macrophytes Special Special Shoreline Special Special Figure 4. Sampling Stations, Sampling Frequency, and Parameters.
5 CMU MDNR YSI Field Database Bottle Numbers & Instructions [ Text Files ] [ Hard Copy ] Laboratory Results & Bottle Numbers [ EXCEL Files ] [ Data Entry ] Bottle Numbers & Field Data Data Report Viewer!! [ Text Files ]?? Data Manager Master Data [ Database File ] Figure 5. Database Components.
6 Annual Food Fed (Lbs) Food Fed Year Figure 6. Long-Term Trend of Food Fed at Hatchery.
7 Annual Fish Production (Lbs) Fish Produced Year Figure 7. Long-Term Trend Fish Production at Hatchery.
8 Net Phosphorus Loading (Lbs) TP Load Year Figure 8. Long-Term Trend of Hatchery Net Total Phosphorus Load.
9 Hatchery Net Total Phosphorus Load (Lbs) TP Load Year Figure 9. Hatchery Net Total Phosphorus Load.
10 Hatchery Effluent Flow (Billion Gallons per Year) 8 6 Flow Year Figure 10. Water Use at Hatchery.
11 Figure 11.
12 Figure 12.
13 Figure 13.
14 Figure 14.
15 Figure 15.
16 Figure 16.
17 Figure 17.
18 Figure 18.
19 Figure 19.
20 Production = 23, , , = 53,095 kg P/F = 53,095/38,822 = 1.37 P in Feed = 38,822 x x = lbs Start Fish P = 43,972 x x = lbs End Fish P = 23,075 x x = lbs Mort Fish P = 1,436 x x = 14.1 lbs Total Shipped Fish P = 72,556 x x = lbs Egg P = ( ) x x 1.3% = lbs lbs shipped outside lbs planted to PR coho chinook Figure 20.
21 91 x 1500 x x 523 x / 1,000,000 = 0.60 lbs trips gal/trip m3/gal mg/m3 lbs/kg mg/kg Storage Tank Liquid 168,922 x 90% x x 523 x / 1,000,000 = 0.66 lbs Sludge 168,922 x 10% x x 15,000 x / 1,000,000 = 2.1 lbs Total Waste Solids = 3.4 lbs Figure 21.
22 Figure 22.
23 Platte River Outfall = 455 lbs By-Pass = 167 lbs Planted = 187 lbs 189 lbs Brundage Creek Eggs = 109 lbs 216 lbs Hatchery Pond 94 lbs Loss = 71 lbs Start Fish = 433 lbs End Fish = 227 lbs Fish Food = 670 lbs Backwash Spring Storage Tank Overall 2003 Mass Balance Total Inputs = 1737 lbs Solids Waste = 1 lb Morts = 14 lbs Figure 23. Shipped = 527 lbs Total Outputs = 1649 lbs
24 USGS Flow of Platte River at US-31 (cfs) Flow Year Figure 24.
25 USGS Flow of Platte River at US-31 (cfs) Flow Sampled Flow Day Figure 25.
26 USGS Flow at US-31 (cfs) and Rainfall at Hatchery (inches) Flow Rain Flow Rainfall Day Figure 26.
27 Figure 27.
28 Figure 28.
29 Turbidity (NTU) vs Suspended Solids (mg/l) Full Range 1000 SS y = x R 2 = y = x R 2 = Lab Meter Field Meter Linear (Field Meter) Linear (Lab Meter) Turbidity Figure 29.
30 Turbidity (NTU) vs Suspended Solids (mg/l) Lower Range ss (mg/l) = * Turbidity (NTU) SS Lab Meter Field Meter Linear (Field Meter) Linear (Lab Meter) Turbidity Figure 30.
31 Figure 31.
32 Figure 32.
33 Figure 33.
34 Figure 34.
35 Figure 35.
36 Figure 36.
37 Lake Volume-Weighted Total Phosphorus (mg/m3) TP Year Figure 37.
38 Percent of Time TP exceeds 8 mg/m Percent Year Figure 38.
39 Figure 39.
40 Figure 40.
41 Figure 41.
42 Figure 42.
43 Figure 43.
44 Figure 44.
45 Secchi Depth (Feet) Secchi Depth Min Ave Max Year Figure 45.
46 Figure 46.
47 Figure 47.
48 Figure 48.
49 Figure 49.
50 Figure 50.
51 Figure 51.
52 Figure 52.
53 Figure 53.
54 Figure 54.
55 Figure 55.
56 Figure 56.
57 Figure 57.
58 Figure 58.
59 Figure 59.

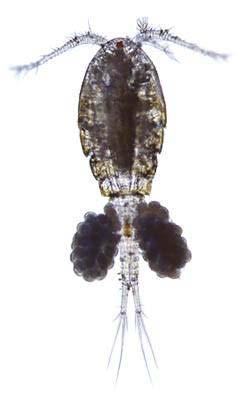
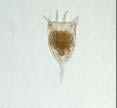
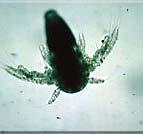
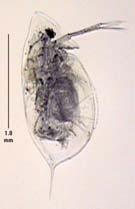
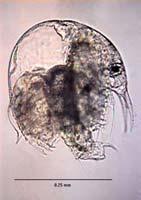
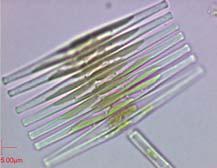
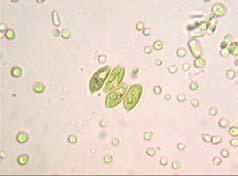
60 Copepods Fish Cyclops Cladocerans Small Herbivores Rotifer Nauplii Bosmina Daphnia Green & Golden Algae Diatoms Flagilaria Figure 60.
61 Figure 61.
62 < All hydroacoustic pings along transect Pings where submerged plants detected Big Platte Lake Hydroacoustic data Figure 62. <
63 Big Platte Lake 2003 Relative plant density (dry g/m 2 ) Estimated from acoustic survey Figure
64 Comparison of Nichols, Clifford, and Big Platte lakes Percent of Percent of Percent of Platte Lake total vol. Clifford Lake total vol. Nichols Lake total vol. Surface acres 2, Total volume (m 3 ) 79,993,664 3,638,849 14,619,562 Volume of littoral (4.7m extent) 7,237, , , Volume of littoral (8m extent) 13,620, ,182, ,194, Surface acres in 8m littoral zone 1, Within 8m littoral zone Relative acoustic density dry wt. g/m Plant biomass (relative) lbs/acre Mean bottom coverage by plants (%) Mean bio-volume (%) Est. biomass (lbs) dry wt. of plants 2,014 3,003 2,944 Dry weight Station Measured Acoustic T3grid Figure 64. T5grid T6grid

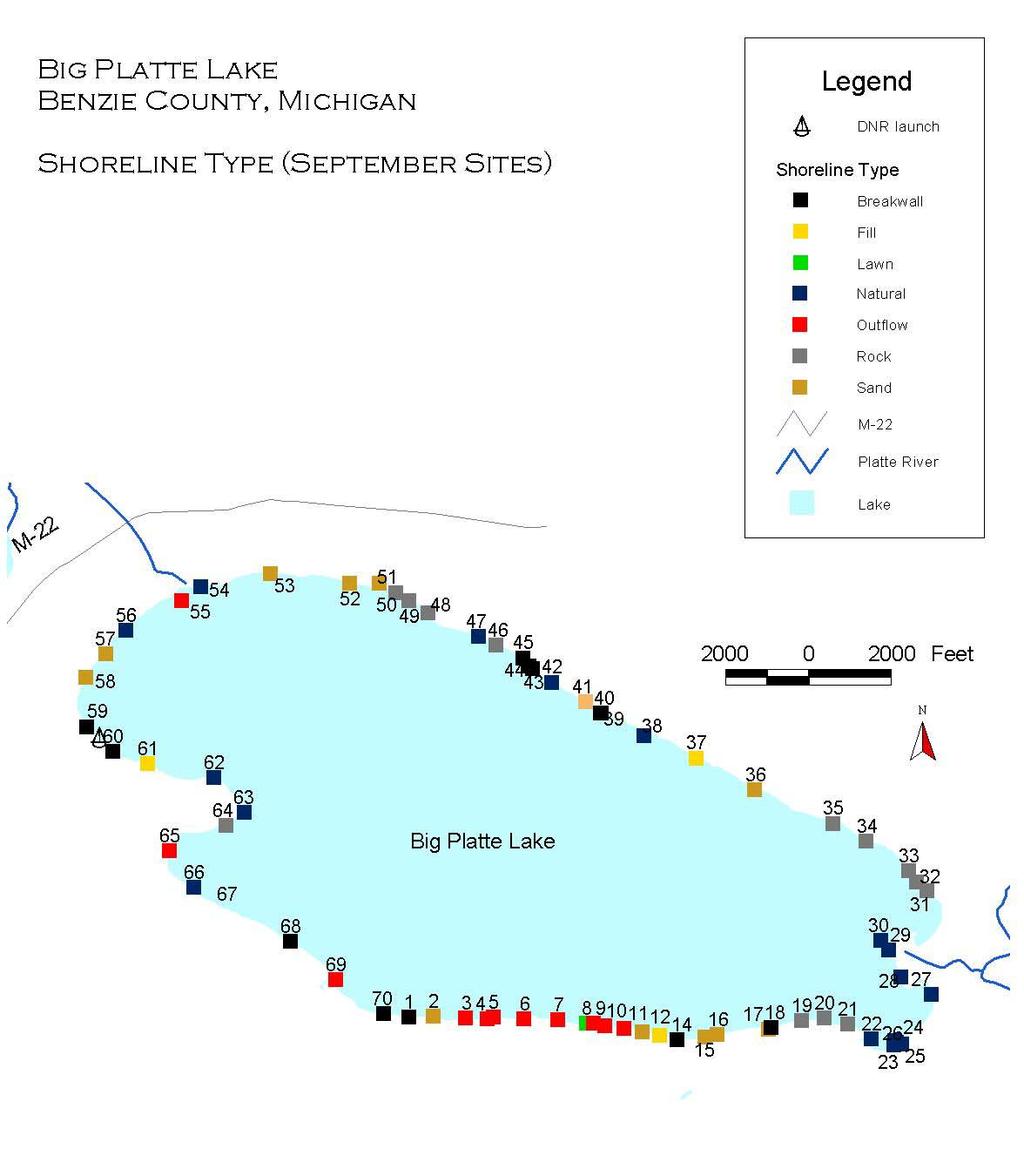
65 T1 T3 T2 Figure 65. Sediment Sampling Sites.
66 TP (mg/g dry) COD (mg/kg dry) 300, , , , ,000 50, Depth (M) Depth (M) Figure 66. Sediment Characteristics vs. Lake Depth.
67 Water/Gas OUT Dissolved Oxygen Air In Air/Nitrogen IN Water Time 64 cm Soluble P N2 In Time Sediment Figure 67. Laboratory Apparatus for Sediment Studies. 6.4 cm
68 Sediment Oxygen Uptake (g O 2 /m/day) T1-5 T3-10 T3-5 T1-12 Site T2-22 T2-5 T3-2 TDP release (ug P/m 2 /day) T3-10 T3-5 T1-28 T1-5 Site -27 Oxic Anoxic -12 Figure 68. Preliminary Sediment Oxygen Demand and Phosphorus Release Rates.
69 Figure 69.
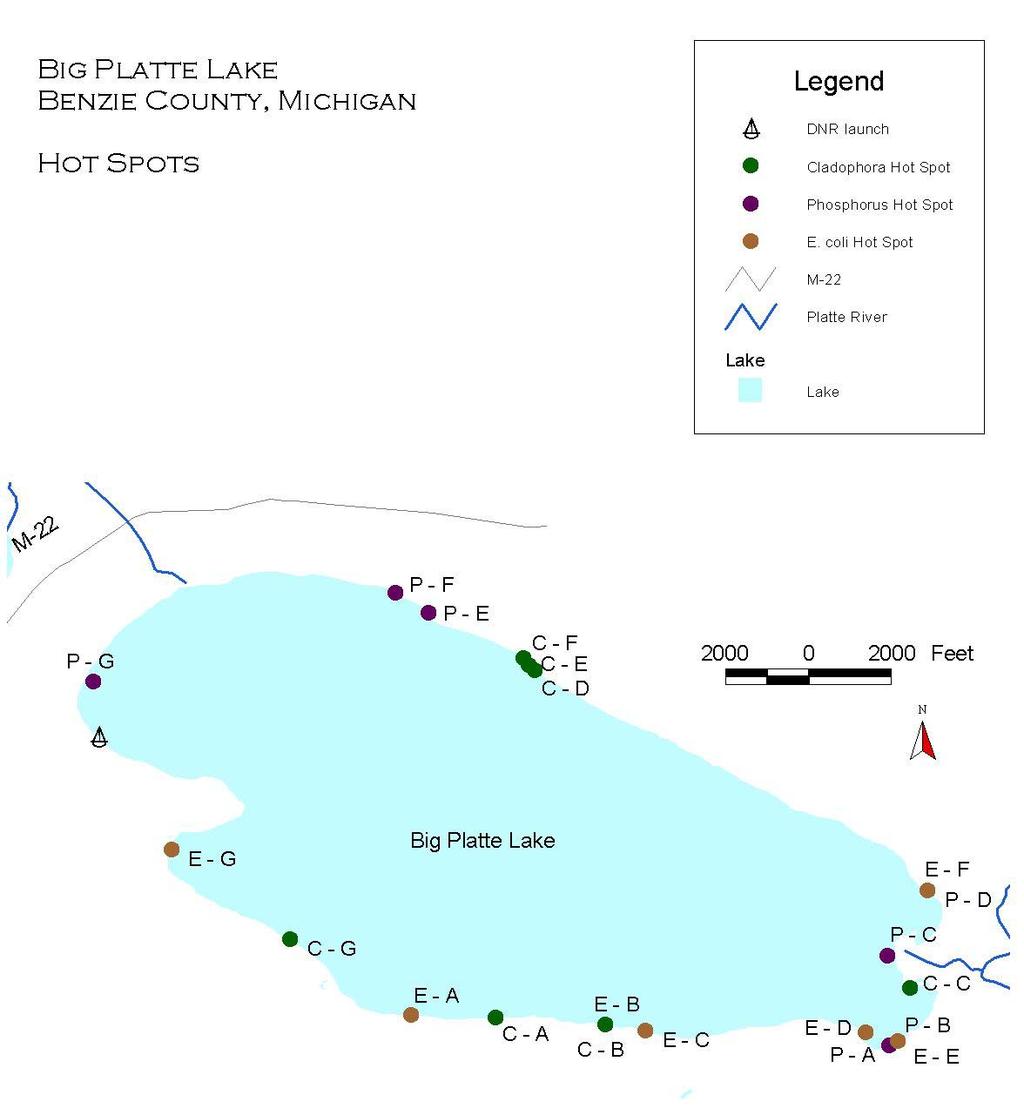
70 E - G E - F E. Coli Hot Spots in Platte Lake (2003) E - A E - B E - C E - D E - E Figure 70. June September Natural E. Coli Counts (/dl)
71 P - G P - F Phosphorus Hot Spots in Platte Lake (2003) P - A P - B P - C P - D P - E Figure 71. June September Natural Phosphorus (ug/l)
72 C - G C - F Cladophora Hot Spots in Platte Lake (2003) C - A C - B C - C C - D C - E Figure 72. June September Natural Cladophora Area (ft 2 )
73 Figure 73.
74 Hatchery Point Source Non-Point Source Lake Water Quality Phosphorus Chlorophyll Dissolved Oxygen Water Clarity Lake Model Flow TP Loading BASINS Watershed Model Based on Land Use Climate Soil Type Land Slope Management Practices Figure 74. Components of BASINS and Lake Water Quality Model.
75 Figure 75. Platte River Watershed Land Use.

76 Figure 76. Platte River Watershed Soil Types.
77 Figure 77. Platte River Watershed Land Elevations.
78 Accumulative Flow at USGS USGS Measured Model 18,000 15,000 m3/sec 12,000 9,000 6,000 3,000 0 Jan Jan Jan Dec Dec Jan Jan Dec Dec Dec Jan Year Figure 78. USGS and Model Accumulative Flow ( ).
79 Monthly Average Flow ( ) Preliminary Calibration USGS Data 5 4 m3/sec Jan Feb Mar Apr May Jun Jul Aug Sep Oct Nov Dec Year Figure 79. USGS and Model Monthly Average Flow ( ).
80 Total Annual Flow Preliminary Calibration USGS Data 160 Million m Year Figure 80. USGS and Model Total Annual Flow ( ).
81 USGS and Model Percent Exceedance Flow USGS Data Preliminary Calibration 12 9 m3/sec % 20% 40% 60% 80% 100% Percent Exceedance Figure 81. Percent Exceedance of Daily Average Flow ( ).
82 Measured and Model Total Phosphorus at USGS Preliminary Calibration Measured Data mg/m Year Figure 82. Measured and Model Total Phosphorus at USGS Station.
83 Figure 83. Hypothetical Application of BASINS Model for Urban Development.
84 Annual Average Flows (cfs) Non-Point = 3.0 Direct = 8.8 Rainfall = 11.7 Non-Point = 2.2 Non-Point = 10.1 Non-Point = 0.74 North Branch = 31.1 Collision = 6.4 Outlet = Evaporation = 15.9 USGS = Upstream = 72.9 Honor Carter = 9.7 Brundage Cr = 6.5 Non-Point = 2.9 Hatchery = 20.1 PR = 8.8 Brundage Cr = 7.9 Hatchery Spring = 3.4 Figure 84. Watershed and Lake Flow Balance for 2003.
85 Non-Point = 475 Non-Point = 577 Outlet = 2461 Atmosphere = 267 North Branch = 459 Collision = 171 USGS = 4837 Upstream = 3079 Macrophytes = 85 Honor Carter = 253 Brundage Cr = 324 Settling = 3921 Sediment Release = 120 Hatchery = 622 PR = 189 Fish Loss = 120 Planted = 19 Brundage Cr = 216 Hatchery Spring = 94 Figure 85. Watershed and Lake Phosphorus Balance (lbs/yr) for 2003.
86 Outflow Epilimnion Atmospheric P Load Point and Non-Point Exchange Settling P Loads Metalimnion Exchange Settling Hypolimnion Sediment P Release Sediment Settling Figure 86. Components of Lake Water Quality Model.
87 Particulate Phosphorus Temperature Soluble Phosphorus Sediments Secchi Depth Algae Dissolved Oxygen Zooplankton Figure 87. Kinetic Components of Lake Water Quality Model.
88 Temperature (F) Day Top Temp Input Data Temperature (F) Day Mid Temp Model Temperature (F) Day Bot Temp Model Figure 88: Three Layer Model Results for Temperature for 2000.
89 DO (mg/l) Day Top Oxy Model DO (mg/l) Day Mid Oxy Model DO (mg/l) Day Bot Oxy Model Figure 89: Three Layer Model Results for Dissolved Oxygen for 2000.
90 Total P (mg/m3) Day Top TP Model Chlorophyll (mg/m3) Day Top Chl Model Secchi Depth (m) Day Secchi Model Figure 90: Model Results for Total Phosphorus, Chlorophyll, and Secchi Depth for 2000.