Centre Wellington Scoped Tier Three Water Budget Assessment
|
|
|
- Margaret Lindsey Bruce
- 5 years ago
- Views:
Transcription
1 Centre Wellington Scoped Tier Three Water Budget Assessment Community Liaison Group Meeting #3 Aboyne Hall, Wellington County Museum Tuesday, May 15, 2018, 7:00 9:30 pm 1
2 MEETING PURPOSE Provide a refresh of the study process, scope and key participants Provide an overview of the groundwater flow model development Receive feedback on the Groundwater Flow Model Development and Calibration Report Provide an update on the Long Term Water Supply Master Plan Address any questions about the process overall 2
3 ROLES & RESPONSIBILITIES Tier 3 Water Budget Project Team: leads the Tier 3 Water Budget responsible for all decisions related to this project Provincial Peer Review Team: provides an external, independent, third party peer review of the technical findings at each major milestone Project Consultant Team: responsible for conducting the Tier 3 Water Budget with direction from the Project Team 3
4 ROLES & RESPONSIBILITIES Community Liaison Group (CLG): provides a forum for the community to be informed provide input on the Tier 3 Water Budget and its progress abide by Terms of Reference and the code of conduct Third Party Facilitator: chairs the CLG meetings provides facilitation and secretariat services General Public: informed about the Tier 3 Water Budget provide input on the Tier 3 Water Budget (via public representatives) observers at CLG meetings 4
5 AGENDA 7:00 pm Welcome 7:05 pm Agenda Review, Introductions and Roles 7:15 pm Context and Process Review 7:30 pm Groundwater Modelling Overview 8:00 pm Breakout Groups Discussion #1 8:30 pm Long Term Water Supply Master Plan Overview 8:45 pm Process Moving Forward Risk Assessment 9:00 pm Breakout Groups Discussion #2 9:25 pm Wrap up and Next Steps 9:30 pm Adjourn 5
6 PROJECT COMPONENTS 4. Risk Assessment 3. Groundwater Flow Model Development/ Calibration 2. Characterization/ Conceptualization 1. Data Collection & Review 6
7 CLG INPUT & PEER REVIEW 7
8 PEER REVIEW INPUT Dr. Rob Schincariol: The Peer Review meeting last week at Matrix was excellent - just what a collaborative effort should be to get the best report we can with the available resources. For me when I see how Patricia and Paul handled the presentation and discussion it gives me confidence in the work. I agree the groundwater flow model is suitably well calibrated to steady-state and transient conditions, and suitable for use in making predictions regarding the long-term sustainability of the water supplies in the Fergus and Elora area. Dr. David Rudolph: The document is very well-written and clearly presented. The work is excellent, it is hard to find much to comment on! Dr. Hugh Whiteley I judge the Groundwater Flow Model Development and Calibration Report to be fully satisfactory. 8
9 PEER REVIEW INPUT Matrix added the following sections and subsections to the report in response to Peer Review comments: Flow System and Water Budget Insights (Section 7) Data Gaps (Section 8) Discussion of Karst Features (Section 2.2.1) Model Verification (Section 5.1.4) Editorial suggestions to improve readability and clarity 9
10 REGULATORY PROCESSES Contaminated Sites MOECC Private Wells PHU MOECC SP-Quality GRCA Municipal MOECC SP-Quantity GRCA Municipal MOECC SDWA WSMP Municipal PTTW MOECC Planning Act / PPS Municipal Class EA Municipal Permit To Take Water (PTTW) Safe Drinking Water Act (SDWA) Water Supply Master Plan (WSMP) Provincial Policy Statement (PPS) Class Environmental Assessment (EA) Municipal MOECC 10
11 WSMP-TIER 3 Linkages Growth Plan Tier 3 Model Application WSMP Tier 3 SPP 12
12 NUMERICAL MODEL DEVELOPMENT AND CALIBRATION 13
13 PROJECT OVERVIEW Cumulative Assessment Assess the impact of long-term water takings on municipal wells and ecosystems (e.g., coldwater streams, Provincially Significant Wetlands) Assess impact of land development on municipal wells. Assess impact of drought on municipal wells. 4. Risk Assessment 3. Groundwater Flow Modelling 2. Characterization/ Conceptualization 1. Data Collection & Review 14

14 MODEL TRANSPARENCY For stakeholders to accept the output and results of our model, the inputs and assumptions should be clear Aim for transparency 15
15 WHY GENERATE MODELS? Tools that contain our knowledge and understanding Give us insight into groundwater flow conditions Help answer questions that cannot be tested in the field. What if we pumped all municipal wells at their highest rates for 20+ years coinciding with a long term drought? Municipal asset W N S E 16

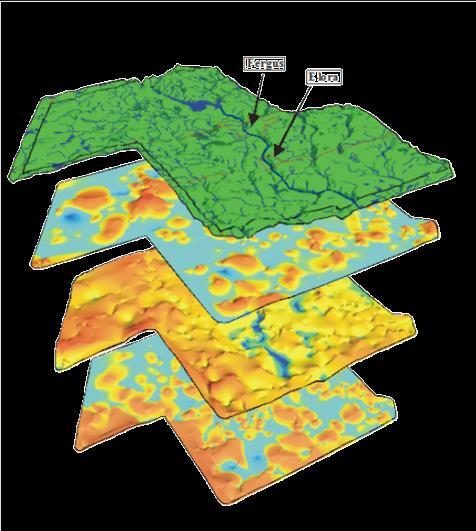
16 CHARACTERIZATION GW FLOW MODEL Layer interpretations Layer Property Interpretations Groundwater Flow Model Water Demand Water Level Data 17
 Save our Water (domestic water demand estimates) Many provided comments and feedback on reports and during meetings.")
17 CLG - THANK YOU Members shared data: Highland Pines/ Pine Meadows (water level data) Nestle Waters Canada (water level data) Save our Water (domestic water demand estimates) Many provided comments and feedback on reports and during meetings. 18


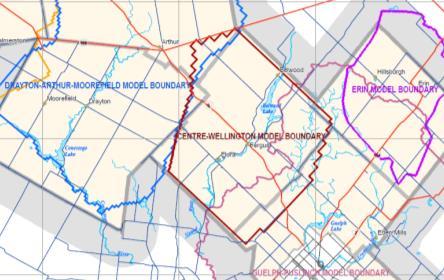
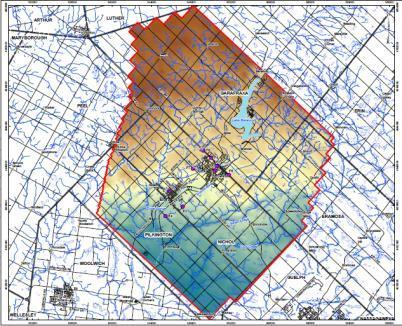
18 STUDY AREA 9 municipal water supply wells (bedrock) 2017 water taking ~ 5,500 m 3 /d 19
19 FINITE ELEMENT MODEL 3D numerical model Subdivided into millions of elements (3,383,898!) Aim: provide insight into where and how much groundwater is flowing through different aquifers W Area: 896 km 2 Volume: 138 km 3 Arthur N Fergus Elora Inverhaugh Belwood Lake Marsville E Typical Element S 20


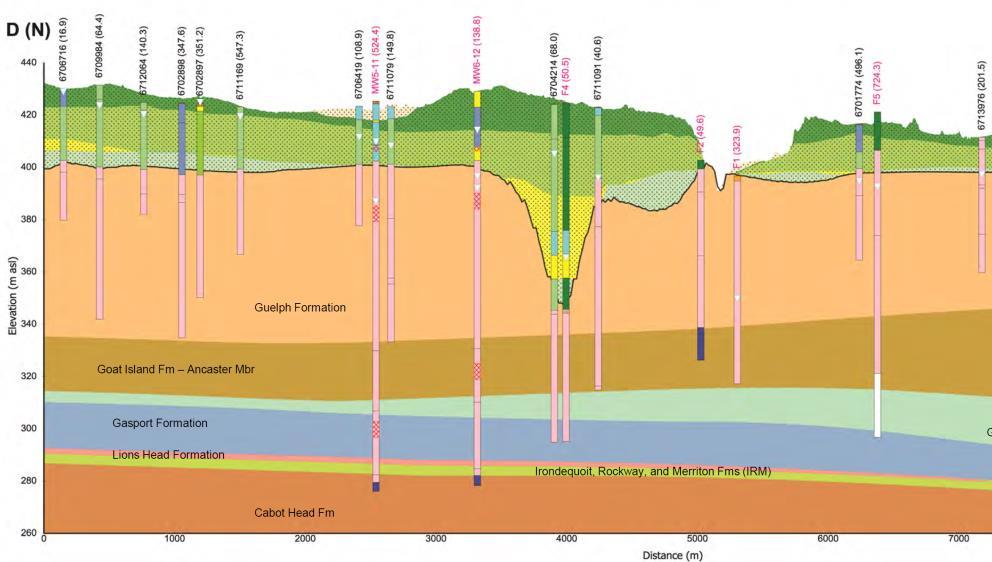
20 MODEL STRUCTURE Overburden and bedrock layers Bedrock aquifers: Lower Guelph, Goat Island, Gasport formations N F1 Upper Guelph F5 Aquitard E Bedrock aquitard: Upper Guelph formation 6 4 Aquifers W Vertical Exaggeration: S


21 HYDRAULIC CONDUCTIVITY Ease that water moves through subsurface Key values applied in the model Aquifers: Red, orange yellow, green Aquitards: Blue and purple W N Overburden Aquifers E S 22 Vertical Exaggeration: 50
22 CONCEPT OF CALIBRATION What is calibration? How does it work? Change values in the model and see how water levels respond; aim to see simulated water levels match observed water levels Over 400 unique runs developed to calibrate the model Observed Water Levels Simulated Water Levels Run Run 21 3 Conductivity = sand sand (1x10 (5x m/s) m/s) 23


23 WATER LEVEL DATASETS So many data points! > 4,100 water wells 48 monitoring wells Used all the available data 24
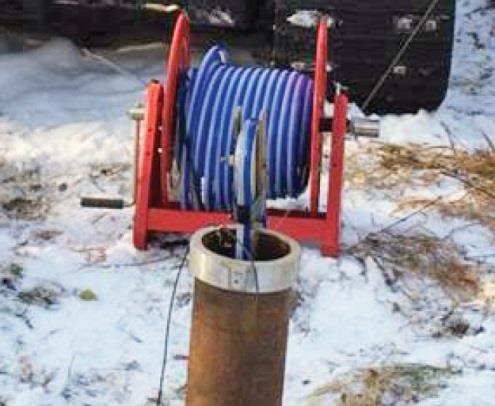
24 WELLS MONITORING 6 week pumping test Multi-level Wells Domestic Wells 25
25 TRANSIENT CALIBRATION 26
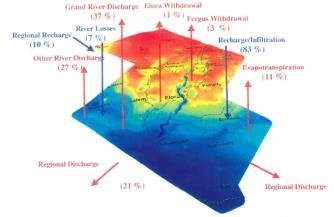
 water is removed from shallow and deeper aquifers via wells Some water leaves the area in upper aquifers (5%) and lower bedrock aquifers (3%) Typical Flow System")
26 GROUNDWATER FLOW Water infiltrates and moves to the water table in the upland areas Most (88%) of water moves from groundwater into nearby streams (local and intermediate) Some (4%) water is removed from shallow and deeper aquifers via wells Some water leaves the area in upper aquifers (5%) and lower bedrock aquifers (3%) Typical Flow System 27


27 SOURCES OF WATER FOR THE AQUIFERS WATER IN WATER OUT Recharge +98% WELLS +1% Overburden & Upper Bedrock Aquifers (6%) -2% -2% -5% Rivers, streams, wetlands (-88%) +1% Lower Bedrock Aquifer -3% 28

28 MODEL APPLICATION How can we use the model? Evaluate: Change in water levels due to new water wells Change in water levels due to land development Change in groundwater flow into rivers and streams due to increase/ decrease in pumping rates Others What do we change in the model when we apply it? Pumping rates (increase/ decrease) Add or remove pumping wells Change groundwater recharge rates to simulate impact of land development Change groundwater recharge rates to simulate drought/ changing climate 29

")


29 APPLICATION Where do we go from here? Water Supply Master Plan Physical Characterization A. Water Supply Master Plan (WSMP) Working with Township and AECOM Long Term Pumping Rate Model Development Source Protection B. Risk Assessment and Climate Change Scenarios Evaluate change in water levels in municipal wells, and change in groundwater flow into rivers, streams and wetlands under different scenarios Understand the range of potential model results Sustainable Peak Pumping Rate Optimization of Pumping Identify Potential New Well Sites Model Application Identify Potential Impacts to the Environment Risk Assessment Potential Effects of Climate 30


30 RANGE OF PREDICTIONS Model incorporates all data Model is calibrated Long term & time varying Predictions: Best Available cannot fully replicate nature Analysis: Range of predictions Enhances confidence Identify important data gaps 31


31 CONTINUOUS IMPROVEMENT Continuous Improvement Process 32
32 1 Draft Report Undergoes Provincial Peer Review 2 CLG INPUT & 3 PEER REVIEW 4 33
33 DISCUSSION # 1 Groundwater Flow What questions, issues, comments or concerns do you have relating to the model (or report)? 34
34 WSMP-TIER 3 Linkages Growth Plan Tier 3 Model Application WSMP Tier 3 SPP 35

35 CENTRE WELLINGTON WATER SUPPLY MASTER PLAN 36

36 MUNICIPAL CLASS EA PROCESS Follows the Municipal Class EA process Provides opportunities for public consultation 37

37 WSMP PROCESS OVERVIEW 38

38 WSMP PROCESS OVERVIEW 39

39 WORK COMPLETED TO DATE Phase 1 Phase 2 40

40 DEMAND PROJECTIONS (TASK #2) 41
41 DEMAND PROJECTIONS
: 4,742 to 5,688 m 3 /day Peak daily system pumping (2010-2017): 6,976 to 8,645 m 3")
42 EXISTING CAPACITY (TASK #3) Centre Wellington Water Supply Average daily system pumping ( ): 4,742 to 5,688 m 3 /day Peak daily system pumping ( ): 6,976 to 8,645 m 3 /day 43
43 EXISTING CAPACITY WSMP Desktop Review Existing water supply capacity assessment completed considering: Previous technical studies Municipal pumping volume data Municipal groundwater level data Groundwater quality data Potential pumping impacts: Interference drawdown Surface water baseflow reduction Effects on water quality Preliminary Assessment Results (DRAFT): Estimated average annual system capacity: 6,800 m 3 /d (approx.) Estimated peak system capacity (30 day period): 12,000 m 3 /d (approx.) 45
44 HOW MUCH MORE DO WE NEED? WSMP Desktop Review: Preliminary Assessment Results Estimated well supply capacity versus projected demand Year Total Population Average Demand (m 3 /d) Surplus/Deficit* (m 3 /d) Max Day Demand (m 3 /d) Surplus/Deficit* (m 3 /d) ,141 4,936 3,388 8,638 1, ,331 5,021 3,240 8,786 1, ,905 6,110 1,334 10, ,632 7, , ,970 8,523-2,890 14,916-1, ,429 9,969-5,419 17,445-3, ,698 11,104-7,407 19,433-4,319 *DRAFT FOR DISCUSSION 46
45 Centre Wellington WSMP Phase 1 Problem or Opportunity - Develop population & demand projections - Evaluate existing water supply capacity - Desktop assessment - Confirmation - Identify future water supply capacity needs Determine optimized well capacity - Replace wells F2 and F5 model scenario: Phase 2 Alternative Solutions - Develop alternatives - Do Nothing; Limit Growth - Water conservation & demand management - Existing groundwater supply optimization - New groundwater supply - Surface water supply - Identify & mitigate impacts to natural, social, cultural environments - Evaluate alternative solutions - Establish preferred solution - Develop implementation strategy Confirm existing water supply capacity - model scenarios: - Recommended sustainable rates long term - Peak rates short term duration (30 days) - Recommended sustainable rates long term Determine impacts & mitigation - model outputs: - Well locations - Baseflow estimates & reduction - PSW drawdown - Aquifer drawdown Tier 3 Model Determine new groundwater supply capacity - model scenario: - Recommended sustainable rates long term
46 DEVELOPMENT OF ALTERNATIVES Model Applications for the WSMP Scenario 1: Existing Municipal Well System Average annual pumping rates (average climate/drought) Peak demand pumping rates (average climate/drought) System performance with largest well out of service long term Scenario 2: Well Optimization / Replacement Average annual pumping rates at existing wells, replacement wells at F2 and F5 (average climate) Scenario 3: System Expansion Average annual pumping rates at existing wells, new wells to meet future demand (average climate) 48
47 DEVELOPMENT OF ALTERNATIVES Model Outputs for the WSMP Model outputs will inform the WSMP about available groundwater capacity to meet future demands and locating future wells to minimize potential impacts: 1) Potential Impacts to Municipal Supply System Locating future wells to minimize interference with existing and proposed municipal wells Locating future wells to avoid potential threats to water quality Change in water level in each pumping well under modeled scenarios Comparison of pumping water level to well Safe Drawdown Level 2) Potential Impacts to the Natural Environment Locating future wells to mitigate potential impacts to natural heritage features (e.g. Provincially Significant Wetlands) Estimate change in groundwater discharge contribution to stream flow Comparison under current pumping conditions and under future pumping conditions 49
48 DEVELOPMENT OF ALTERNATIVES Model Outputs for the WSMP Model outputs will inform the WSMP about available groundwater capacity to meet future demands and to locating future wells to minimize potential impacts: 3) Potential Impacts to the Social Environment Locating future wells to minimize interference with private wells Review of drawdown in aquifer water levels The groundwater model will also provide direction to future groundwater exploration programs & proposed Class EA undertakings 50
49 WSMP NEXT STEPS Confirm existing capacity Develop water supply alternatives Evaluate water supply alternatives Identify preliminary preferred water supply solution, consisting of a series of proposed projects with associated Class EA schedules, along with timeline and cost estimates Public and agency consultation & confirmation of preferred solution Document process and implementation strategy in a Water Supply Master Plan report Master planning is a process of continuous renewal the Master Plan will be updated to reflect new information e.g., population and water demand forecasts, groundwater model updates 52
50 WSMP PUBLIC CONSULTATION Opportunities for Participation 53
51 PROCESS MOVING FORWARD 54
 What are the impacts to cold water streams and Provincially Significant Wetlands? 55")
52 RISK ASSESSMENT Testing future scenarios Can the current well infrastructure supply enough water during a prolonged drought? with projected population growth (i.e., increased pumping rates)? with increased development (i.e., more impervious areas -> less groundwater recharge) What are the impacts to cold water streams and Provincially Significant Wetlands? 55
")
53 HOW IS RISK MEASURED Model predicts water level at each of the municipal wells for each scenario Risk is assessed based on water level in municipal wells and whether water can still be pumped Impacts to surface water features (coldwater streams, wetlands) 56

54 DISCUSSION #2 Process What questions do you have relating to the process going forward? 57

55 WSMP-TIER 3 Linkages Growth Plan Tier 3 Model Application WSMP Tier 3 SPP 58
56 REFLECTION Data contribution from CLG members water taking monitoring data, well records, water demand data from domestic wells CLG as forum for discussions and question/answer sessions CLG as vehicle to provide information to broader group of stakeholders Peer Review Process and Comments Emphasis: what is within the scope of the Tier Three Study 59
57 NEXT STEPS Administrative Circulate meeting summary CLG provide comments on meeting summary; finalize meeting summary with comments; post meeting summary and presentation on website Technical Start with Risk Assessment Document preliminary results Provincial Peer Review CLG Meeting 4. Risk Assessment 3. Groundwater Flow Model Development/ Calibration Source Protection Plan update- future 2. Characterization/ Conceptualization 1. Data Collection & Review 60