Upper Mississippi River Lake Pepin Modeling Lake Pepin Municipal Sector Meeting August 6, 2008
|
|
|
- Gregory Armstrong
- 5 years ago
- Views:
Transcription

1 Upper Mississippi River Lake Pepin Modeling Lake Pepin Municipal Sector Meeting August 6, 2008 Lake Pepin Photo by Guy Schmickle
2 Overview Fundamentals Why model? What is a model? Model Development How was this model developed? Can I trust this model? Model Application What does this model say about what needs to be done?
3 Why model? Inform management decisions Inform management decisions Answer questions, such as What conditions lead to impairment? How extensive is the impairment? What is contributing to the impairment? What are appropriate goals to attain? What changes are needed to attain goals? Where, when and how much???
4 Spring Lake Turbidity Impairment Nutrient Impairment Lake Pepin

5
6 Water quality models Use mathematical formulas to represent complex natural processes C = f (loads, physics, chemistry, biology) Are constructed by developing a mass balance relationship for each parameter of concern Load Upstream transport Transport downstream Concentration Processes

7 UMR-LP Domain Spring Lake Lake Pepin
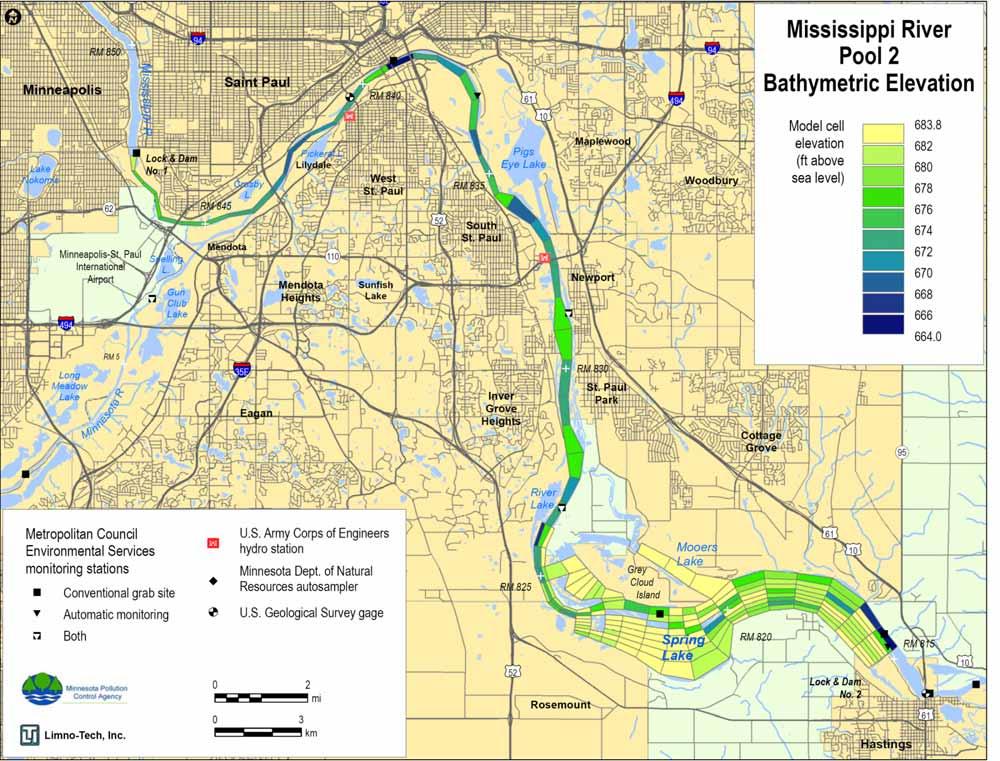
8 Pool 2

9 Model Domain and Grid Characteristics Pool 3

10 Model Domain Pool and 4 Grid Characteristics
11 Building a water quality model: Inputs The model is only as good as the information you put into it Loads of solids, phosphorus and algae are key inputs and can be based on data or other models Loads Upstream transport Concentration Processes Transport downstream
12 Loading Sources Represented in UMR-LP Tributary Sources: Upper Mississippi River (Lock & Dam 1) Minnesota River St. Croix River Cannon River Vermillion River Rush River Minor tributary loadings to Lake Pepin (MN/WI) Urban/suburban loadings for the Metro area Direct WWTP Sources: Pool 2: Metro Plant, Empire, Eagles Point Pool 3: Hastings, Prescott Pool 4: Red Wing, Lake City
13 WWTP Tributary Spring Lake Lake Pepin
14 Loading Sources Represented in UMR-LP All sources currently represented by data in UMR-LP Future work will use models to develop source loads to assess implementation of source reduction strategies, whether WWTP improvements or BMPs in urban and rural areas RCA Modeling Efforts in the Lake Pepin Basin CE-Qual-W2 Upper Mississippi Upper Mississippi Storm Water Crow River HSPF Minnesota River HSPF Miles
15 Building a water quality model: Processes Simple to complex physical, chemical, and biological processes are represented in the model with mathematical equations Loads Upstream transport Concentration Processes Transport downstream

16 Phytoplankton Modeling organic carbon is biomass currency Zooplankton Grazing
17 Carbon Kinetics and Cycling CO 2 Hydrolysis Deposition Dissolved Organic C (RDOC/LDOC) K H Particulate Organic C (RPOC/LPOC) V s V r Resuspension Grazing Algal Exudate Death/ Recycle DOC (ExDOC) D p V s Death Total Total Zoo C Algal C Grazing Deposition K M Reactive DOC (ReDOC) Mineralization Water Column Diagenesis of POC Sediment Bed
18 Phosphorus Kinetics and Cycling Total Dissolved Organic P (RDOP/LDOP) Mineralization K M Dissolved Inorganic P (DPO4) Adsorption Desorption Particulate Inorganic P (PO4SS1/PO4SS2) Hydrolysis Total Particulate Organic P Deposition K H (RPOP/LPOP) V s V r Resuspension Grazing Total Zoo P Death/ Recycle Death Grazing D p G p Total Algal P V s Deposition Growth Sediment Flux Deposition J V s V r p Water Column Resuspension Diagenesis of POP Sediment Bed
19 Algal Source/Sink Dynamics Three algal functional groups: winter diatoms, summer assemblage, blue-greens Growth rate for each group is a function of temperature (f T ), light intensity (f I ), and nutrient availability (f N ). Gp = Gp max ft ( T ) f I ( I ) f N ( N ) The change in algal biomass is calculated by UMR-LP at each time step and in each model grid. da dt V = [ G A R s P ] [ + + Gr] A z Growth Respiration Settling Grazing
20 The Model Development Process Clarify Objectives / Set Goals Review Available Data and Model Design Conceptual Modeling Strategy Recommend Additional Data Develop Model Evaluate Model Apply Model Ongoing Communication and Review MPCA Staff Stakeholder Advisory Committee Science Advisory Panel
21 Complexities and Challenges for UMR-LP Model Very large, complex site Both river-like and lake-like 3 separate Mississippi River pools, variable physical characteristics Very large watershed Multiple sources, both PS and NPS Subject to a wide range of hydrological conditions Complex biogeochemical interactions Multiple TMDL targets Turbidity & nutrients chlorophyll a Feedbacks between turbidity and nutrients Turbidity a problem at high flow and nutrients a problem at low flow Multiple jurisdictions
22 UMR-LP Model Ranks Among Most Complex Large Aquatic Ecosystem Models Other complex models we have worked on: Chesapeake Bay watershed and water quality and living resources modeling framework Green Bay and Lake Michigan and Lake Ontario toxic chemical linked hydrodynamic sediment transport chemical fate and transport bioaccumulation models Saginaw Bay Ecosystem Model: coupled nutrient lower food web dreissenid model Lake Erie linked watershed and coupled nutrient eutrophication hypoxia model Several other systems, including Gulf of Mexico, NY- NJ Harbor, Cooper River Charleston Harbor, Lake Okeechobee, Everglades, Delaware River, Fox River, Kalamazoo River
23 UMR-LP Chronology Initial calibration effort completed in June 2007 identified opportunities to improve calibration with additional data and model improvements (e.g., wind-wave resuspension). Bathymetry data collected and model refinements made in fall Revised calibration results presented to Scientific Advisory Panel (SAP) on February 14, 2008.
24 UMR-LP Chronology (cont.) Model applied to assess 15 load reduction scenarios. Results presented to SAP April 30 th. Additional questions raised by scenario results and more recently available data lead to additional assessment of model performance. Model-data comparisons for algal speciation and zooplankton in Lake Pepin Refinements to calibration completed and scenarios run again.
 flows temperature sediment transport")
 Nutrients Turbidity Suspended sediments Dissolved oxygen et cetera Two SAV Species Wild Celery Sago Pondweed Model Output Biomass Areal")
25 UMR-LP Model Framework Boundary conditions & loads: upstream tribs point source Boundary conditions & loads: upstream tribs point source Fine Scale Bathymetry Other Species-specific Parameters Hydrodynamic and Sediment Transport (revised ECOMSED) flows temperature sediment transport Water Quality (revised RCA) Water Level Light Extinction Water Temperature ERDC SAV 32 Water Quality State Variables Algal species (3 functional groups) Nutrients Turbidity Suspended sediments Dissolved oxygen et cetera Two SAV Species Wild Celery Sago Pondweed Model Output Biomass Areal Coverage
26 UMR-LP Approach to Assessing Model Performance/Calibration Three calibration/confirmation iterations Many time consuming model runs Exhaustive sensitivity analyses to understand feedback effects of parameter adjustments Best professional judgment used to assess model performance using a range of model-data comparisons Graphical time series comparisons 1-to-1 plots Cumulative distributions Statistical comparisons (RMSE, RAE, etc.) Comparisons using spatial and temporal averaging Process rate measurements vs. model (e.g. sediment flux) Mass balance comparisons (e.g. sediment accumulation rates) Comparing correlations between various measured parameters with model simulated correlations And more
27 UMR-LP Approach to Assessing Model Performance/Calibration 22 years of data for system: for calibration for confirmation Over 400,000 data points are available to compare to model results (80,000 samples) Ongoing peer review by: Science Advisory Panel Stakeholders Advisory Committee

28 NVSS LD
29 Model-Data Comparison for Lake Pepin Chlorophyll (Jun-Sept)
30 Median Absolute Relative Error between Model and Data Period Chl TP DIP VSS NVSS Lock & Dam Lake Pepin
31 The Model Development Process Clarify Objectives / Set Goals Review Available Data and Model Design Conceptual Modeling Strategy Recommend Additional Data Develop Model Evaluate Model Apply Model Ongoing Communication and Review MPCA Staff Stakeholder Advisory Committee Science Advisory Panel
32 Using the model to answer: What happens when we reduce loads? Developed 19 scenarios, including combinations of the following: Reduce Mississippi River loads at LD1 by 20% and 50% Reduce Minnesota River loads by 20%, 50%, and 80% Reduce Cannon River loads by 50% Reduce St. Croix River and other tributary loads by 20% Reduce Direct WWTP loads from 1 mg/l TP to 0.3 mg/l, maintain permitted flows Reduce resuspension in Pool 2 Reduce to natural background conditions 90% reductions
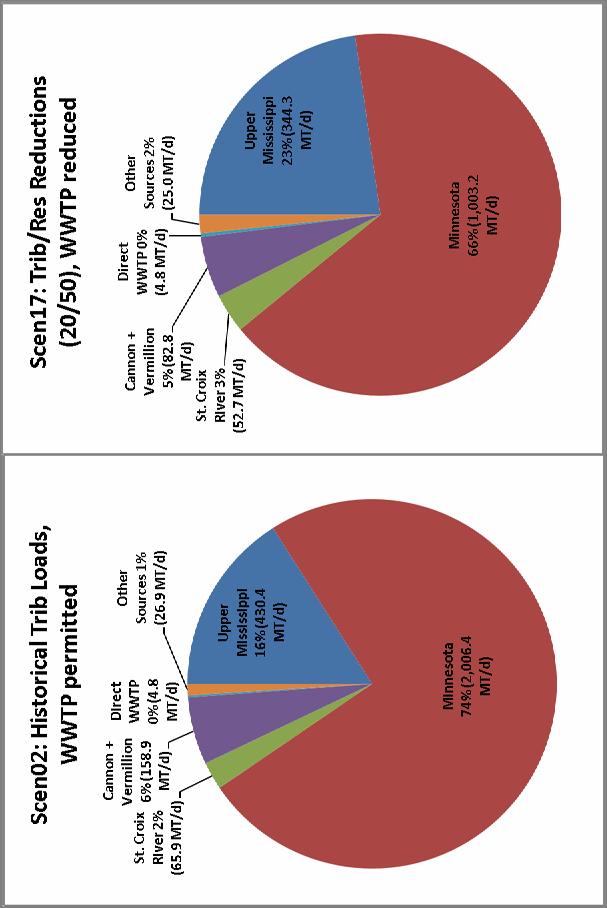
33 Comparing Model Scenarios Scenario 02: All tributaries at historical loads Metro WWTPs at permitted loads (typically 1 mg/l TP) Scenario 17 reductions: 20% in Upper Miss. River 50% in Minnesota River 20% in St. Croix River 50% in Cannon River 20% in other tributaries Metro WWTPs at permitted flows and 0.3 mg/l TP Reduced resuspension in Pool 2
34 Mississippi River Flow at Prescott 2002 ~90 th percentile flow year 2006 ~10 th percentile flow year
35 TSS Load Comparison
 LD2:")
36 90 th Percentile Turbidity (Apr-Oct) LD2: MCES Meter
37 TP Load Comparison

38 TP Lake Pepin (June-Sept)

39 TP Lake Pepin (June-Sept)
40 CHL Lake Pepin (June-Sept)
41 CHL Lake Pepin (June-Sept)
42 Lake Pepin 2006 TP vs. Chl: All Scenario Results

43 Lake Pepin Avg. Phosphorus for 2006

44 Lake Pepin Avg. Chlorophyll for 2006

45 Phosphorus Mass Balance In Lake Pepin, June - Sept. 2006, Base Case, Scenario 2 No Tributary Reductions, Direct WWTPs at Permitted Loads

46 Phosphorus Mass Balance In LP, June Sept. 2006, Scenario 4 20/50/Permitted

47 Phosphorus Mass Balance In Lake Pepin, Jun-Sept 2006, Scen.. 11, 20/50/Reduced

48 Phosphorus Mass Balance In Lake Pepin, Jun-Sept 2006, Scen.. 17, 20/50/0.3 Red. Resp
49 Findings to date Reductions in solids and phosphorus loads on the order of: 20% in the Mississippi River 50% in the Minnesota River 20% in the St. Croix River 50% in the Cannon River 20% in other tributaries 70% from permitted levels at direct WWTPs (phosphorus only) are about sufficient to meet current turbidity and nutrient goals
50 Next Steps Further assessment of model scenarios and goals Develop modeling report (final by September 30 th ) Further apply model and integrate with other modeling efforts in watershed to inform TMDL
51 Questions?