Redefining the Middle East: a game-changing energy alternative from the eastern Mediterranean
|
|
|
- Felicia White
- 5 years ago
- Views:
Transcription
1 Redefining the Middle East: a game-changing energy alternative from the eastern Mediterranean


2 Evolution of the Middle East Traditional definition of the Middle East G8 definition of the Middle East Areas sometimes associated with the Middle East Source: Wikipedia
3 Middle East a fairly recent term Yearly count of names used to describe the region, Sources: Google Ngram, Milken Institute.

4 Map of eastern Mediterranean basin Source: EIA.

5 Global natural gas flows Source: Total estimates

6 Geopolitical players in the eastern Mediterranean A concentric circles scheme of natural gas prospects European Union Regional countries Russia and U.S. Sources: Fondazione Eni Enrico Mattei, Milken Institute.
 per capita growth,")


7 Regional per capita growth in comparison GDP (PPP) per capita growth, average Percent Asia Emerging and developing economies MENA non-oil Latin America & Caribbean MENA oil Africa Source: IMF and World Bank.

8 Increases in growth estimated for Mediterranean countries GDP growth rate, select MENA countries Percent North Africa Eastern Med Gulf States (est.) Egypt Morocco Tunisia Israel Lebanon Jordan Qatar Saudi Arabia UAE Source: IMF WEO.
 Percent 100 90 80 70 60")

9 Export diversification in North Africa and Levant Export composition (% of merchandise exports) Percent Yemen Saudi Arabia Fuel Manufacturing Others Oman Qatar Egypt Tunisia Morocco Lebanon Israel Jordan Source: World Bank.


10 Eastern Mediterranean and adjacent Middle East states are among few places in the world where electricity is largely produced from oil Percent Other Gas Oil Egypt Israel Lebanon Jordan Cyprus Syria Sources: Brenda Shaffer and World Bank.
11 Forecast of domestic demand and supply of natural gas from the Tamar and Leviathan reservoirs Billion cubic meters of natural gas Domestic supply Domestic demand Sources: Bank of Israel and Ministry of Energy and Water Resources.
, 2012")
 Sub-Saharan Africa Euro area OECD MENA")
12 The region is more dependent on tourism than others International tourism, receipts (% of total exports), 2012 Percent Source: World Bank. MENA (non- GCC) Sub-Saharan Africa Euro area OECD MENA Latin America East Asia
13 More consistent capital flows to non-oil export countries FDI inflows to MENA oil and non-oil exporters US$ billions Oil Non-oil Source: UNCTAD.

14 MENA GDP growth rate in comparison Percent Emerging Asia 10 MENA SSA Latin America Source: IMF WEO.
15 FDI flows to the region make up a small portion of global FDI FDI inflows US$ billions 2,500 2,000 World 1,500 1, MENA Source: UNCTAD.
16 The region is not benefitting from globalization Non-oil exports (% of world total) Percent Low and middle income Emerging Asia MENA Source: World Bank.
17 Cost of doing business in MENA is steadily decreasing Cost of business start-up procedures, % of GNI per capita Percent East Asia MENA OECD World Source: World Bank.

18 International reserves: mostly positive changes in 2013 Percent change in international reserves, 2012 and 2013 Percent Egypt Jordan Lebanon Morocco Oman Qatar Saudi Arabia Tunisia UAE Yemen Israel Source: IMF IFS.
19 How much gas was discovered? Modest by global standards (approx. 36 TCF): Israel Tamar 10 tcf (283 bcm); proven Leviathan tcf ( bcm); estimated Additional fields 3 tcf (85 bcm); estimated Gaza Marine Field 1 tcf (30 bcm); estimated Cyprus Overall tcf ( bcm); estimated Yet enough to satisfy local demand for the next years Source: Brenda Shaffer
20 How much is left for exports? Approx tcf ( bcm) for export: Half will likely go to Jordan and Pal. Territories Only 7-11 tcf ( bcm) left for export beyond the East Med region Exports not trapped by politics Low reserves High regional demand Other sources will come online Source: Brenda Schaffer
21 Potential for the region Discoveries may help region in many ways: No more water conflicts Economic development thanks to cheap gas Reliable electricity supply in contrast to current situation Trade may reinforce political agreements Increases public health by reducing pollution Source: Brenda Schaffer

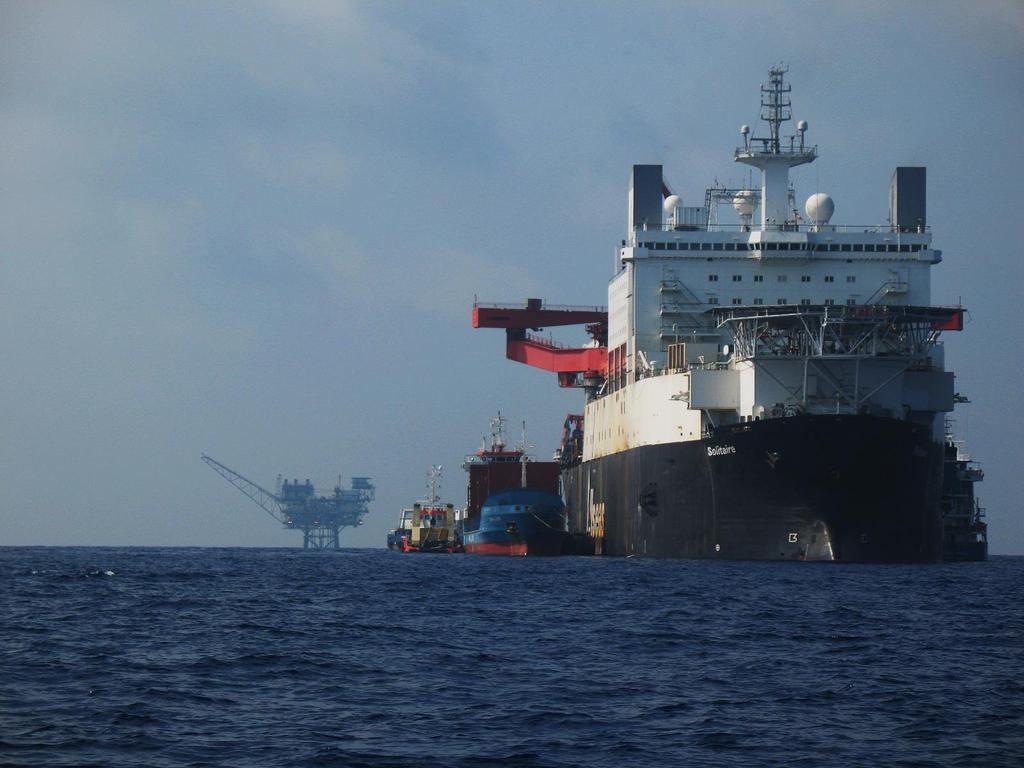
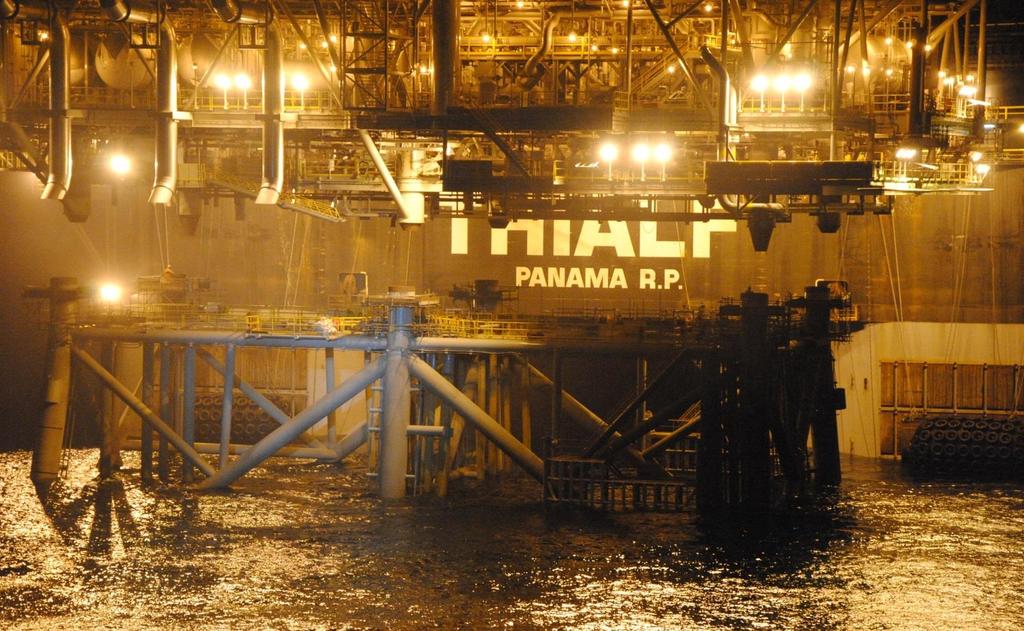
22 Noble Energy in the Eastern Mediterranean Noa discovered 1999 Mari-B discovered 2000 Andromeda dry 2001 Initial IEC contract 2002 Hanna dry 2003 Mari-B first gas sales 2004 o Created Israel s natural gas industry Tamar discovery in 2009 o 10 TCF - 20 years supply Leviathan discovery in 2010 o 19 TCF export project Cyprus A discovery in 2011, Tanin in 2012, Karish and Tamar SW in 2013


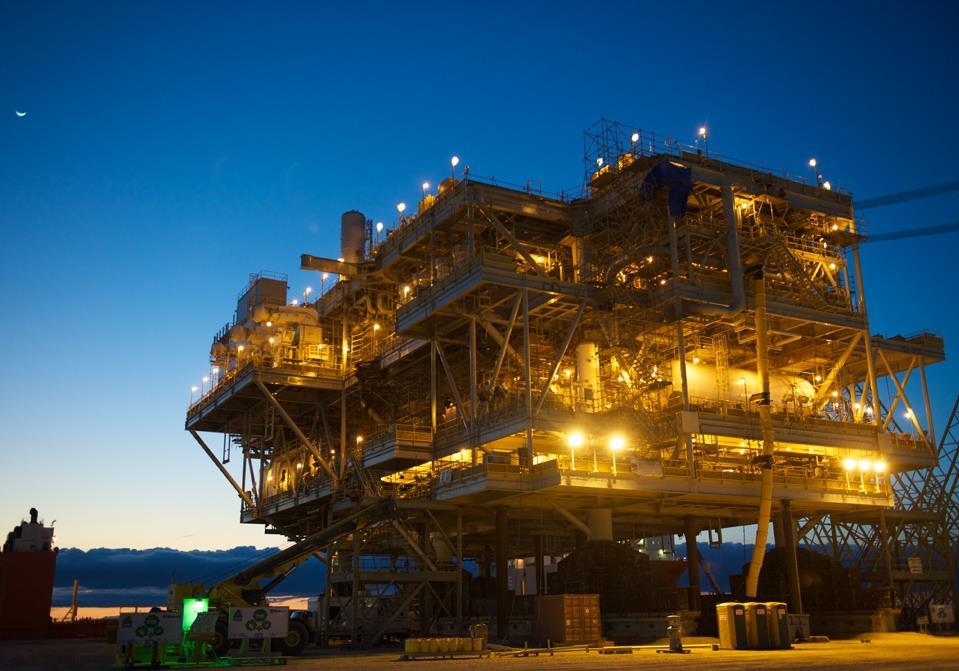
23 Mari B Field IEC Natural Gas Consumption, BCMA New Fueled 1/3 of Israel s electricity generation Over $ 7 Billion in total savings Saved 17 million metric tons of CO2 emissions Invested ~$500m in last 3 years to maintain deliverability

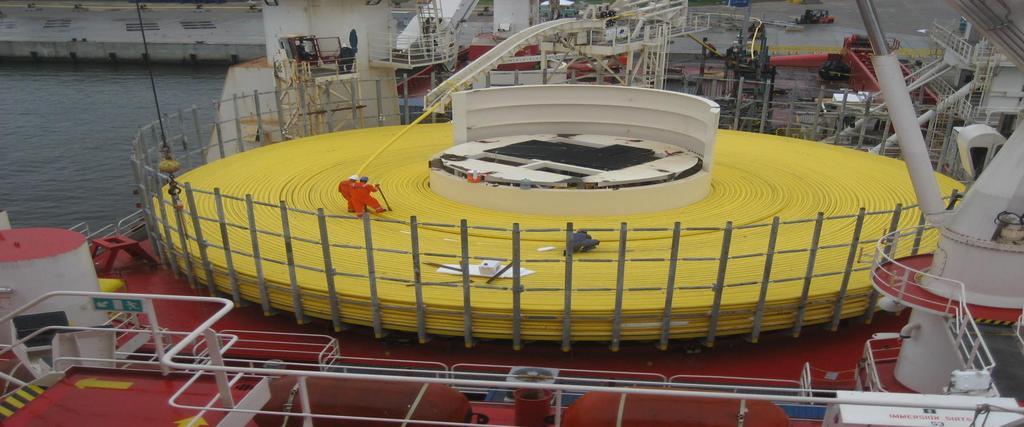
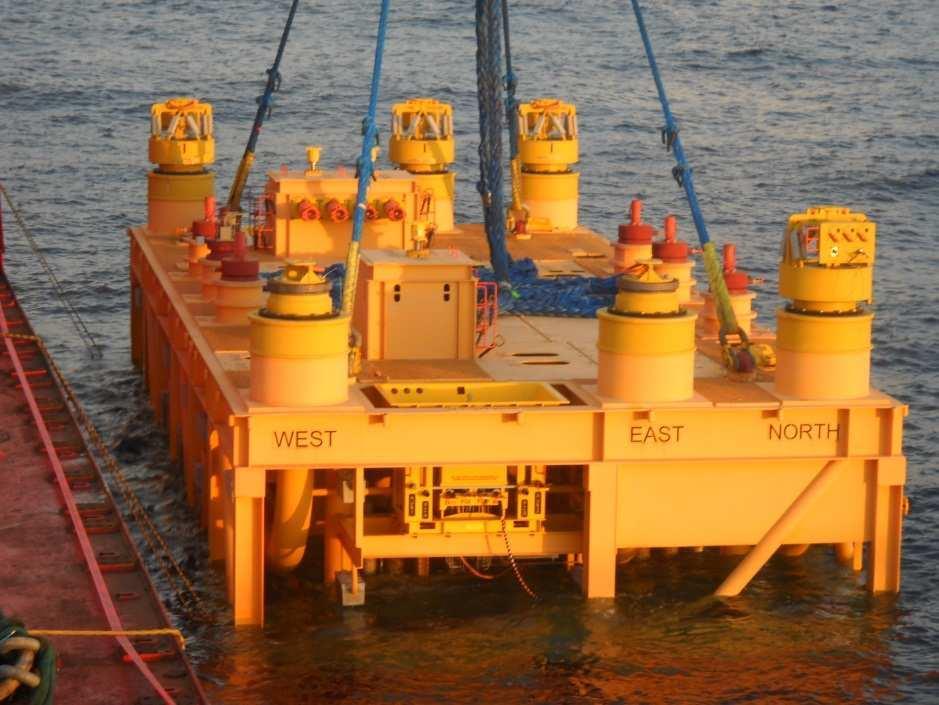
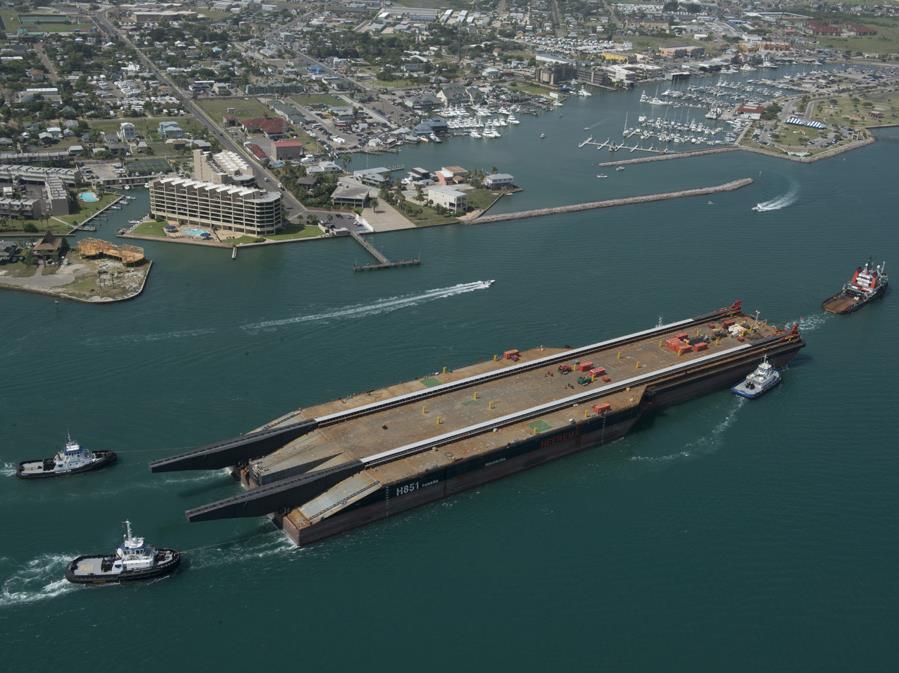
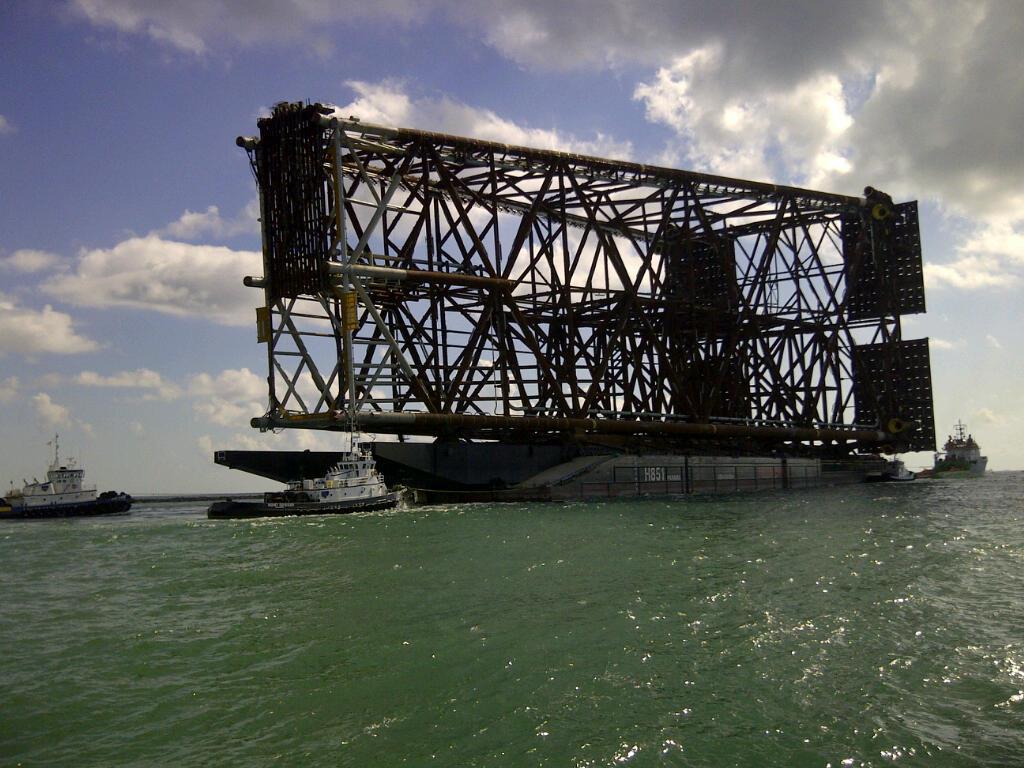
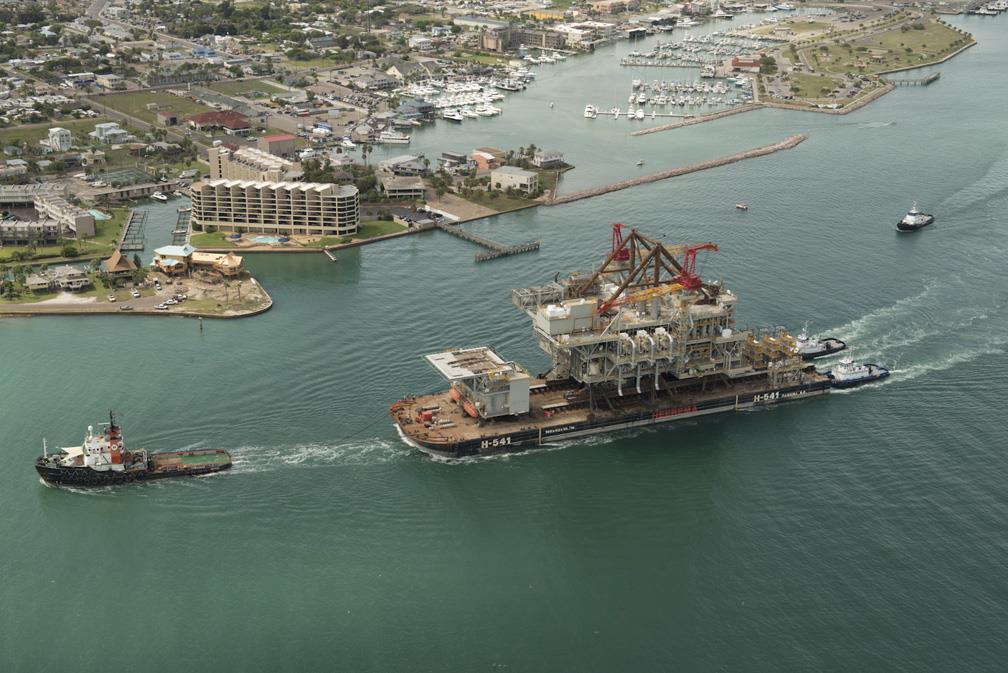
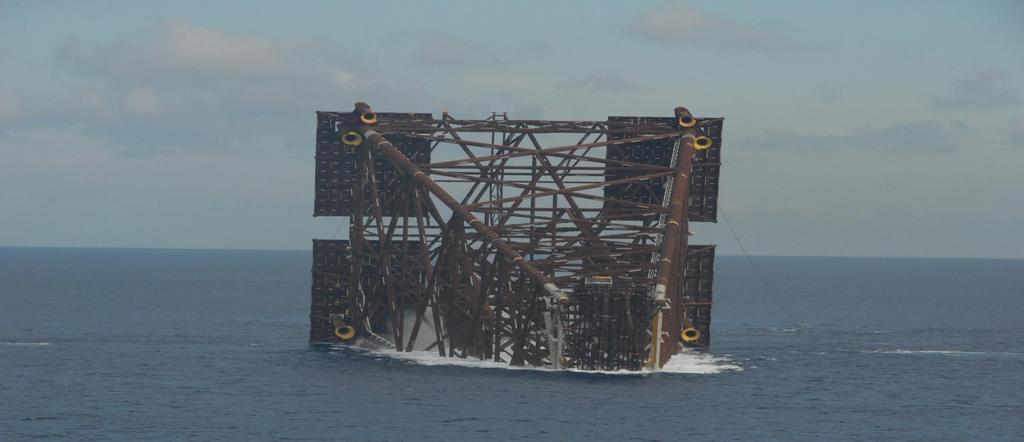
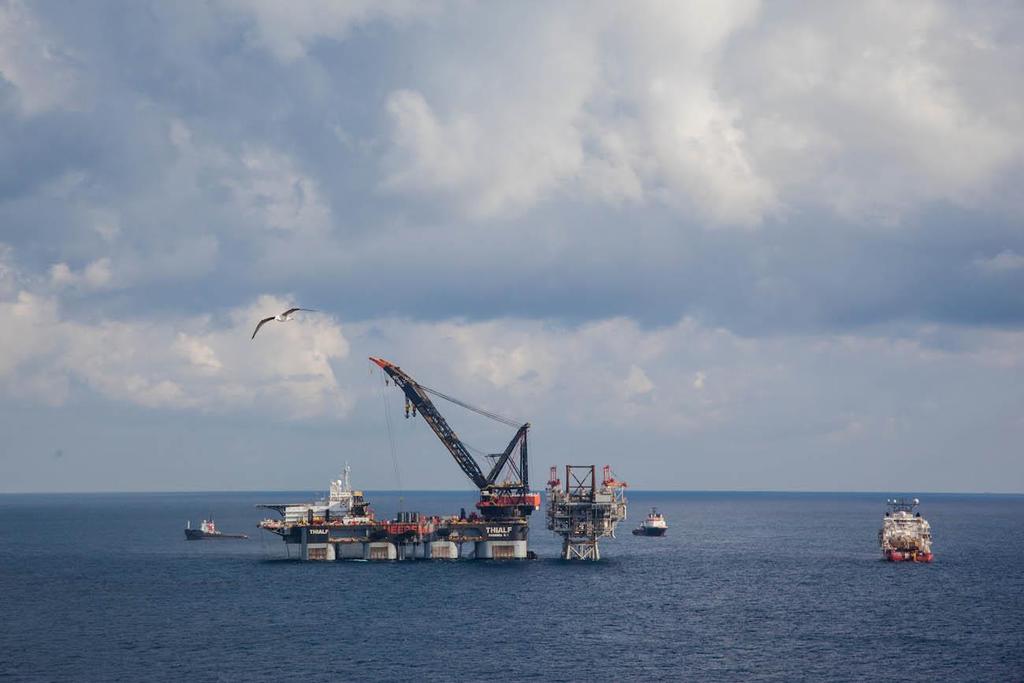
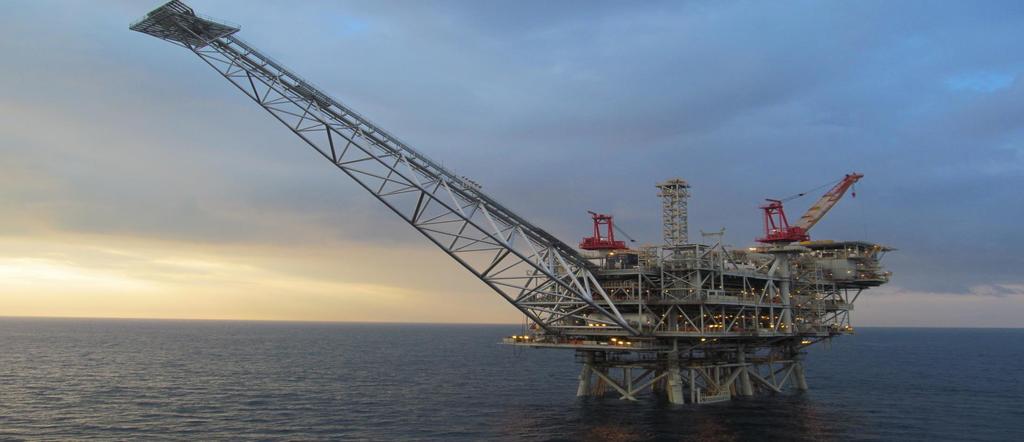
24 The Tamar Project Discovery to first gas sales in 4.3 years Drilled 6 wells to ~ 5000 m Installed subsea 1700 m Installed 150 km of dual 16 pipelines Built and transported Tamar platform Installed Tamar platform near Mari-B Commissioned system and brought online March 2013

25 Tamar Drilling Sedco Express

26 Main Deck Float December 2011

27 Jacket Fabrication December 2011
28 28
29 Source:
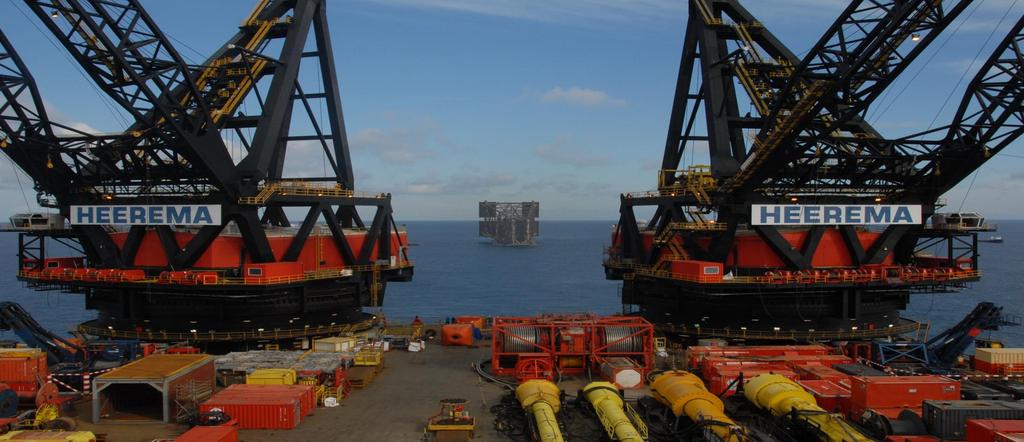
30 Source:
31 Source:
32 Source:
33 Source:
34 Source:
35 Source:
36 Source:
37 Source:
38 Source:
39 Source:

40 Tamar Start Up

41 The Leviathan Project Multi - $Bn Project, Phased Regional Pipeline and LNG Exports Growing Local Industry Capability Domestic Market via Northern Landing Point
42 Industry Risk Management Gas Sales Geological Risk Revenue Regulatory Framework Operational Risk Tax & Royalty Contract Sanctity Construction/Operating Requirements Export Capital Cost Operating Cost
43 Forward-looking Statements and Other Matters This presentation contains certain forward-looking statements within the meaning of the federal securities law. Words such as anticipates, believes, expects, intends, will, should, may, and similar expressions may be used to identify forward-looking statements. Forward-looking statements are not statements of historical fact and reflect Noble Energy s current views about future events. They include estimates of oil and natural gas reserves and resources, estimates of future production, assumptions regarding future oil and natural gas pricing, planned drilling activity, future results of operations, projected cash flow and liquidity, business strategy and other plans and objectives for future operations. No assurances can be given that the forward-looking statements contained in this presentation will occur as projected, and actual results may differ materially from those projected. Forward-looking statements are based on current expectations, estimates and assumptions that involve a number of risks and uncertainties that could cause actual results to differ materially from those projected. These risks include, without limitation, the volatility in commodity prices for crude oil and natural gas, the presence or recoverability of estimated reserves, the ability to replace reserves, environmental risks, drilling and operating risks, exploration and development risks, competition, government regulation or other actions, the ability of management to execute its plans to meet its goals and other risks inherent in Noble Energy s business that are discussed in its most recent Form 10- K and in other reports on file with the Securities and Exchange Commission. These reports are also available from Noble Energy s offices or website, Forward-looking statements are based on the estimates and opinions of management at the time the statements are made. Noble Energy does not assume any obligation to update forward-looking statements should circumstances or management's estimates or opinions change. This presentation also contains certain historical and forward-looking non-gaap measures of financial performance that management believes are good tools for internal use and the investment community in evaluating Noble Energy s overall financial performance. These non-gaap measures are broadly used to value and compare companies in the crude oil and natural gas industry. Please also see Noble Energy s website at under Investors for reconciliations of the differences between any historical non-gaap measures used in this presentation and the most directly comparable GAAP financial measures. The GAAP measures most comparable to the forward-looking non-gaap financial measures are not accessible on a forward-looking basis and reconciling information is not available without unreasonable effort. The Securities and Exchange Commission requires oil and gas companies, in their filings with the SEC, to disclose proved reserves that a company has demonstrated by actual production or conclusive formation tests to be economically and legally producible under existing economic and operating conditions. The SEC permits the optional disclosure of probable and possible reserves, however, we have not disclosed our probable and possible reserves in our filings with the SEC. We use certain terms in this presentation, such as discovered unbooked resources, resources, risked resources, recoverable resources, unrisked resources, unrisked exploration prospectivity and estimated ultimate recovery (EUR). These estimates are by their nature more speculative than estimates of proved, probable and possible reserves and accordingly are subject to substantially greater risk of being actually realized. The SEC guidelines strictly prohibit us from including these estimates in filings with the SEC. Investors are urged to consider closely the disclosures and risk factors in our most recent Form 10-K and in other reports on file with the SEC, available from Noble Energy s offices or website,