Impacts of Permit-Exempt Wells
|
|
|
- Gabriel Gallagher
- 5 years ago
- Views:
Transcription


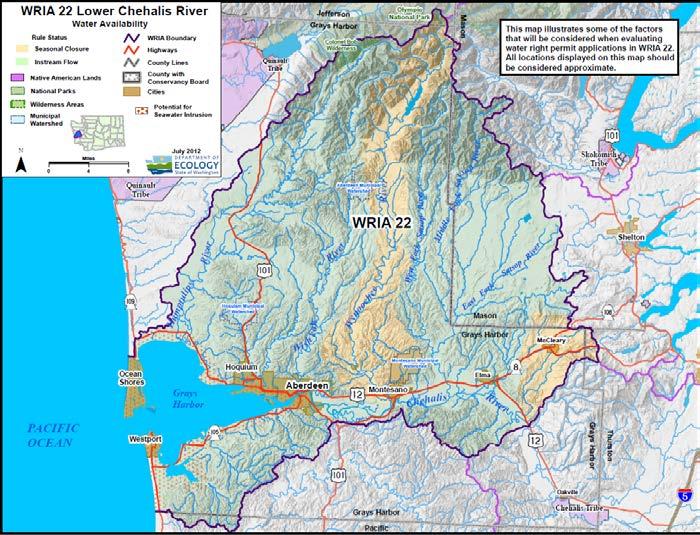
1 Impacts of Permit-Exempt Wells Dave Nazy, LHG August 24,
2 Impacts of Permit-Exempt Wells Introduction ESSB 6091 Example Impacts Calculation Basin Estimate & 20-year Projections Offsetting Impacts & Net Ecological Benefits Summary 2


3 Section 202 Watershed plan update by 2/1/ GPD annual average limit P-E wells limitations still apply $500 fee for each building permit Only domestic uses affected One project = One P-E use Watershed Plan Update Limited to objectives of ESSB 6091 Impacts of P-E wells (consumption) Evidence of conservation ID projects to improve watershed health Watershed Plan Implementation Track building permits using P-E wells Construct projects to offset impacts ESSB

4 Estimating Impacts Total Use per Building Permit Indoor use Outdoor use Consumptive Use per Building Permit Indoor use Outdoor use How Many Building Permits? OFM population OFM growth rate Building permit data Well construction data 20-Year Projections WRIA vs. Sub-Basin 4

 Total indoor")
5 Indoor Water Use Indoor Use Per capita use 60 GPD (Ecology guidance) People per home ~ 2.5 (US Census data) Total indoor use = 150 GPD 5
6 Outdoor Water Use Outdoor Use Washington Irrigation Guide Pasture/Turf water duty Area irrigated (e.g., ¼ acre) Peak use = 1132 GPD in July Average use = 328 GPD Gallons/Day Outdoor Water Use for 1 / 4 Acre Irrigation*- Centralia, Washington Annual Average (328 Gal/Day) 0 Jan Feb Mar Apr May Jun Jul Aug Sep Oct Nov Dec * Source: Washington Irrigation Guide Appendix B 6
7 Total Use with ¼ Acre Irrigation Total Use Indoor use = 150 GPD Outdoor use variable, average 328 GPD Peak use = 1282 GPD Annual average = 478 GPD Annual total = 0.54 Acre-feet 350 GPD ave. = ~ 1 / 6 acre 3000 GPD ave. = ~ 6 acres Gallons/Day Total Water Use with 1 / 4 Acre Irrigation*- Centralia, Washington Annual Average (478 Gal/Day) Outdoor Use (Gal/Day) Total Use Indoor Use Jan Feb Mar Apr May Jun Jul Aug Sep Oct Nov Dec * Source: Washington Irrigation Guide Appendix B 7
8 Impact with ¼ Acre Irrigation Indoor Consumption 10 % = 15 GPG Outdoor Consumption 80 % = GPG Annual average = 263 GPD Total Consumption Annual average = 278 GPG Annual total = 0.31 Acre-feet Gallons/Day Total Water Use with 1 / 4 Acre Irrigation*- Centralia, Washington Annual Average (278 Gal/Day) Total Consumed (Gal/Day) Total Use 0 Jan Feb Mar Apr May Jun Jul Aug Sep Oct Nov Dec * Source: Washington Irrigation Guide Appendix B 8
9 Potential Range of Impacts Indoor Use Total Household Water Use in Gallons per Day Jan Feb Mar Apr May Jun Jul Aug Sep Oct Nov Dec Annual Total (Gallons) Annual Daily Ave (GPD) Annual Total (Acre-Ft) , Indoor + Outdoor Water Use Centralia Aberdeen 1 / 12 Acre , / 4 Acre , , / 2 Acre ,249 1,648 2,414 1,749 1, , / 12 Acre , / 4 Acre , / 2 Acre , , Indoor Use Only Total Household Consumptive Water Use in Gallons per Day Jan Feb Mar Apr May Jun Jul Aug Sep Oct Nov Dec Annual Total (Gallons) Annual Daily Ave (GPD) Annual Total (Acre-Ft) , Indoor + Outdoor Water Use Centralia Aberdeen 1 / 12 Acre , / 4 Acre , / 2 Acre ,213 1,826 1, , / 12 Acre , / 4 Acre , / 2 Acre ,


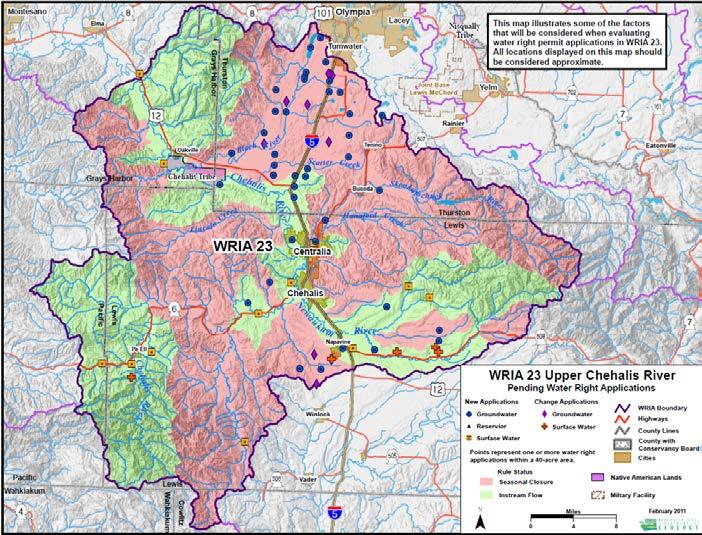
10 20 Year Projection Well Construction Data Ecology database 46 wells/year in WRIA wells/year in WRIA 23 Uncertainty and not 1:1 OFM Population Data Low, medium, high growth rates Difficult to match to new P-E uses Building Permit Data Most reliable Matched to parcel Fees associated with ESSB 6091 Can be used to quantify by sub-basin 10
11 Impacts of Permit-Exempt Wells Basin Building Indoor Only Indoor + 1 / 12 acre Indoor + 1 / 4 acre Indoor + 1 / 2 acre Permits/Yr* Annual 20 Year Annual 20 Year Annual 20 Year Annual 20 Year Upper Chehalis , Lower Chehalis * 85% of number of water wells constructed per year ( ) Domestic Consumptive Use (Acre-Feet) 492 Acre-Feet/Yr = 0.68 cfs = 306 GPM 11

12 Offsetting Impacts & Net Ecological Benefits 12
13 Offsetting Impacts & Net Ecological Benefits 1400 Total Water Use with 1 / 4 Acre Irrigation*- Centralia, Washington 10,000 USGS CHEHALIS RIVER AT PORTER, WA Oct Mar ,000 Gallons/Day Annual Average (278 Gal/Day) Total Consumed (Gal/Day) Total Use CFS 8,000 7,000 6,000 5,000 4,000 Discharge ISF 400 3, ,000 1,000 0 Jan Feb Mar Apr May Jun Jul Aug Sep Oct Nov Dec * Source: Washington Irrigation Guide Appendix B 0 Jan Feb Mar Apr May Jun Jul Aug Sep Oct Nov Dec 13
14 Offsetting Impacts & Net Ecological Benefits 14

15 Summary ESSB 6091 Plan update due February 1, 2021 Quantify P-E domestic impacts (consumptive use) Identify timing and location of impacts ID and implement projects to offset impacts Quantifying Impacts Ecology guidance Building permit data Quantify by sub-basin 20-year projection Basin Building Indoor Only Indoor + 1 / 12 acre Indoor + 1 / 4 acre Indoor + 1 / 2 acre Permits/Yr* Annual 20 Year Annual 20 Year Annual 20 Year Annual 20 Year Upper Chehalis , Lower Chehalis * 85% of number of water wells constructed per year ( ) Domestic Consumptive Use (Acre-Feet) 15
 Lower priority is elsewhere in basin or only during low flow periods Lowest priority is non-water projects to improve the composition, structure, and")
16 Summary Offsetting Impacts and Net Ecological Benefits Ecology guidance Mitigation must replace consumptive impacts Offset & exceed potential new P-E impacts to instream resources Highest priority is in-kind mitigation (same time and sub-basin) Lower priority is elsewhere in basin or only during low flow periods Lowest priority is non-water projects to improve the composition, structure, and function of aquatic systems 16
17 Recommendations Coordination among counties Quantify impacts by sub-basin Identify mitigation alternatives Summary Water acquisitions and water right changes Storage alternatives Managed aquifer recharge Stormwater management Floodplain restoration/levee removal Streamflow augmentation Conservation Riparian and fish habitat improvement Screen and prioritize mitigation alternatives Implement streamflow restoration projects 17