Sanitary Sewer Rates Now and in the Future
|
|
|
- Walter Day
- 5 years ago
- Views:
Transcription

1 Sanitary Sewer Rates Now and in the Future December 2008 Steve Nielsen, Chief Engineer/Deputy Director Indianapolis Department of Public Works Mark C. Jacob, Program Manager Indianapolis Clean Stream Team
2 Agenda City of Indianapolis Clean Streams-Healthy Neighborhoods Program Program Overview Addressing Raw Sewage Overflows Under EPA s Mandated Consent Decree with City Rehabilitating Aging Sewers and Increasing Capacity Eliminating Failing Septic Systems Improving Drainage and Flood Control Potential Sanitary Sewer Rate Increase ( ) Evaluations and Potential Long-Term Rate Estimates (2025) Planned Projects The Future


3 Raw Sewage Overflows Sewer Backups Failing Septic Systems Neighborhood Flooding

4 Why Do Our Sewers Overflow When It Rains?


5 Combined Sewer Overflow Locations
; Completed by 2025 Long Term Control Plan goals by 2025: Come into compliance with state and federal Clean Water Act and NPDES permit requirements Reduced")
6 City s 20-Year Plan to Reduce Raw Sewage Overflows Required under a federally mandated agreement (consent decree) with state and federal regulatory agencies $1.7 billion estimated cost (in 2004 dollars); Completed by 2025 Long Term Control Plan goals by 2025: Come into compliance with state and federal Clean Water Act and NPDES permit requirements Reduced average overflow frequency from 45 to 80 times per year to two to four times per year on average Capture up to 97% of raw sewage overflow volume that otherwise would be released into waterways
7 City s 20-Year Plan to Reduce Raw Sewage Overflows Long Term Control Plan goals by 2025 (continued): Dramatically improve water quality by reducing sewer overflows in a cost-effective manner Improve our streams to support fish and other aquatic wildlife Improve neighborhood quality of life


8 City s 20-Year Plan to Reduce Raw Sewage Overflows Major plan components: 13- to 16-mile-long deep tunnel, feet in diameter Underground storage tanks and larger sewers to capture overflows Sewer separation in some neighborhoods Major treatment plant upgrades
9 Predicted Overflow Frequency ( data) Number of Storms Causing Overflows Before After
10 Average Annual Overflow Volume 6000 Overflow volumes will decrease dramatically compared to historic conditions Average Annual Overflow Volume (MG/ year) Before After 0 White River
11 Sanitary Sewer and Treatment Plant Improvements Addressing sewer needs outside the old city limits Areas have grown in population and sewer use Additional improvements are needed to: Maintain and upgrade the city s sewage treatment plants Rehabilitate aging sewers Increase sewer capacity Keep sewage pumps and lift stations in working order

12 Septic Tank Elimination Program (STEP) The Problem More than 27,000 homes in Indianapolis are served by private septic systems Failing systems leach human waste into groundwater, backyards and neighborhood ditches and streams


13 Septic Tank Elimination Program (STEP) The Solution Mayor Ballard is committed to bringing sewers to residents with failing systems as quickly as possible The city anticipates bringing sewers to approximately 7,000 homes from 2009 through 2013 STEP Financial Assistance Plan is available for low-income residents Pay the $2,500 connection fee over time
14 Wastewater Infrastructure Needs ( ) Rehabilitation/Expansion (City Controlled) ($1.5 Billion) Long Term Control Plan (Consent Decree) ($1.7 Billion) Septic Tank Elimination Program (STEP) (City Controlled) ($300 Million)

15 Stormwater Drainage Problems and Neighborhood Flooding Poor drainage causes basement flooding, street flooding and dangerous black ice in winter More than $300 million over 20 years is needed to address stormwater issues throughout Indianapolis

16 Outcomes from the Sanitary Sewer and Stormwater Rate Increases Sanitary Rate Increases Stormwater Rate Increase 29% in 2006 $1.00 per Equivalent Residential Unit 23% in 2007 in % in 2008 Reduced raw sewage overflows by 1.07 billion gallons, annually Increased capacity at Belmont Advanced Wastewater Treatment Plant Eliminated approximately 2,000 septic systems by end of 2008 Eliminated constructed sanitary sewer overflows (SSOs) and reduced or prevented sewer backups Addressed neighborhood drainage and flooding Maintained/improved levees and Eagle Creek dam
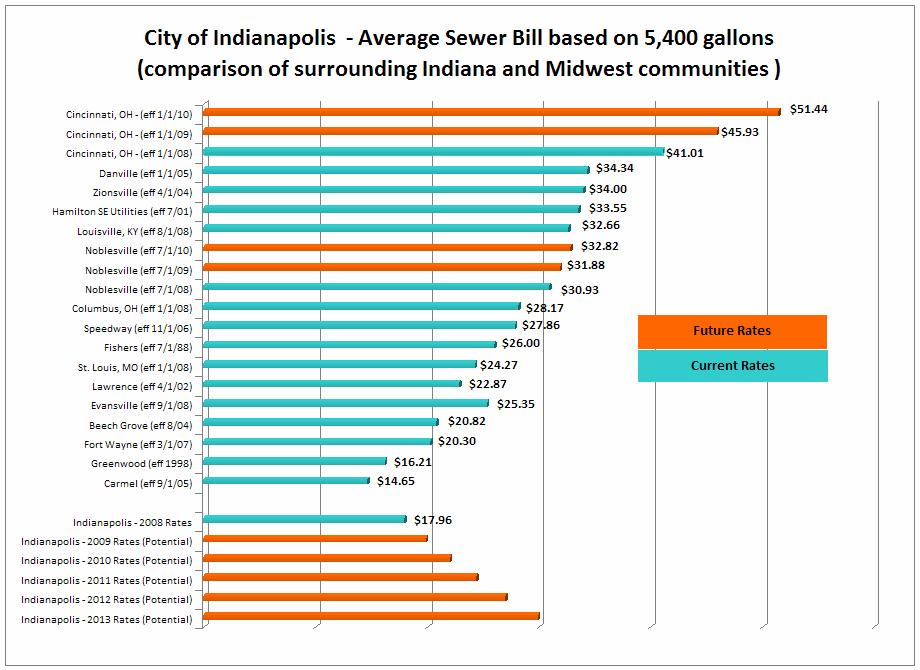
17 Potential Sanitary Sewer Rate Increases Current 2008 sanitary sewer bill for average household using 5,400 gallons/month is $17.96/month Five-year sewer capital plan was estimated at approximately $1.3 billion, which could have required a 20.4% annual rate increase New $750 million sewer capital plan could require a 10.75% increase each year from 2009 through 2013; however the city is continuing to evaluate ways to reduce this potential increase
18 Comparisons of Potential Sanitary Sewer Rates Pre- and Post-Value Engineering Based on average residential user (5,400 gallons per month) $50.00 $45.00 $40.00 $35.00 $30.00 $25.00 $20.00 $15.00 $10.00 $5.00 $ New Value Engineered $750 M CIP Previously Planned $1.3 B CIP
19 Actual Historical vs. Potential Sanitary Sewer Rate Increases* 30% 25% 20% 29.00% 23.00% 18.00% 15% 10% Actual Actual Actual Potential 10.75% 5% 0% *Based on average residential user (5,400 gallons per month)
20 Breakdown of Potential Sanitary Sewer Rate Increase (2013) Sewer Master Plan $35.00 $30.00 $25.00 $20.00 $15.00 $10.00 STEP Consent Decree Operations, Current Maintenance, 2008 Rate Debt Service $5.00 $-
21
22 Cost Escalations and Value Engineering Value Engineering: Evaluate projects and select the most effective and fiscally responsible option Cost escalations approaching $300 million Trickling Filters/Solids Contact Interplant Connect Tunnel Fall Creek/White River Tunnel Value engineering plans to reduce these overruns by approximately $300 million Reduce costs, select better solutions with better data now available, and complete projects more quickly and efficiently Implement sustainability concepts Re-sequence the schedule of projects to reduce the amount of raw sewage in our streams sooner than originally scheduled
23 A Commitment to Green, Sustainable Solutions DPW is incorporating environmentally friendly designs when possible Often equal to, less expensive than conventional designs Green infrastructure will reduce amount of stormwater that enters the city s overburdened sewer system Lower the carbon footprints, reduce materials used and reduce impacts to public and other utilities
24 Evaluation of Summer Sewer Maximum Credit Credits residential users for water use during the summer months Beginning in 2009, the credit will be based on a 12- month average, rather than a two-month average, as is currently the practice Water use above the 12-month average will be credited to users accounts from May through September

25 Capital Improvement Program $750 million sanitary capital program $75 million stormwater capital program Benefits throughout Indianapolis City will remain in compliance with federal consent decree for CSO LTCP Project list and information available online at
26 Capital Investment Levels ( ) $200.0 $180.0 $160.0 $140.0 $120.0 $100.0 $80.0 $60.0 $40.0 $20.0 $ Stormwater $- $- $2.0 $8.0 $8.0 $2.0 $4.0 $17.0 $24.0 $13.5 $13.5 $13.5 $13.5 $13.5 Sanitary $15.3 $16.0 $17.0 $36.0 $64.0 $46.0 $62.0 $102. $102. $99.0 $115. $180. $181. $175.
27 Sanitary Capital Program Projects and Highlights ( ) Bring sewers to approximately 7,000 homes currently on septic systems Begin engineering planning for the Fall Creek/White River Tunnel Continue the Belmont-Southport Interplant Connect project Begin constructing the Belmont North Parallel Interceptor Upgrade Lift Station 507 in Broad Ripple Capture an additional 1.42 billion gallons of raw sewage, annually, by the end of 2013
28 Stormwater Rates and Capital Projects and Highlights ( ) Stormwater rates are not planned to increase in 2009 Projects that will continue to reduce flooding and drainage problems Continue the drainage improvement project along Kessler Boulevard that will benefit residents and thousands of commuters Indianapolis North White River Flood Damage Reduction project Complete improvements at Eagle Creek dam Begin drainage improvement project in Frog Hollow neighborhood that will divert approximately 80 percent of water away from neighborhood
29 Summary Reducing raw sewage overflows in old city limits By end of 2013, will prevent an additional 1.42 billion gallons of raw sewage, annually, from overflowing into waterways Bringing city sewers to approximately 7,000 homes currently on septic systems; largest annual investment in STEP in city s history Reducing sewer backups and keeping up with growing neighborhoods that need sewer capacity and treatment Improving drainage and flood control Value engineering plans being implemented that will result in savings of more than $300 million on Long Term Control Plan projects, currently identified
30 The Future The city has a plan to complete the federally required and necessary sanitary sewer projects through 2025: $3.5 billion in wastewater infrastructure needs Long-term rate implications: Original projections for average sewer bill by 2025: $104.83/month or $1,254/year (published in Long Term Control Plan) Mayor Ballard is making strides to reduce the impact of increased rates: Already reduced the potential rate increase by more than 30 percent Continuing to find ways to reduce the impact of increased rates
31 Questions?