Appraisal of Ground Water Condition In and Around Jindal Steel and Power Limited, Raigarh, Chattisgarh
|
|
|
- Cecilia Ann Morris
- 5 years ago
- Views:
Transcription


1 Appraisal of Ground Water Condition In and Around Jindal Steel and Power Limited, Raigarh, Chattisgarh By Correspondence. Address: Plot No. 26, 4 Bays, Institutional Area, Sector-32, Gurgaon, Haryana India March, 2010
2 Appraisal of Ground Water Condition In and Around Jindal Steel and Power Limited, Raigarh, Chhattisgarh CONTENTS CHAPTERS TITLES PAGE NO 1.0 INTRODUCTION Location & Extent 1.2 Objectives & Scope of Study 2.0 GEO-MORPHOLOGY & LAND USE Geomorphology 2.2 land Use & Drainage Remote Sensing & GIS Studies 3.0 CLIMATE AND RAINFALL APPRIASAL OF GROUND WATER CONDITION Hydrogeology 4.2 Ground Water Levels 4.3 Ground Water Fluctuation 4.4 Ground Water Draft 5.0 OBSERVATION AND CONCLUSION List of Figures FIGURES TITLE 1.1 Administrative map of Raigarh district with Location of Project Site 1.2 Map showing the Study Area 1.3 Google Image of the Study Area 1.4 Project site layout of JSPL plant i
3 2.1 Geo-morphological map of Study Area 2.2 Different Scenes of Satellite Image 2.3 Different Scenes of Satellite Image 2.4 Land use map of the Study Area for Land use map of the Study Area for Hydrogeological Map of Study Area 4.2 Depth to Water level Pre-monsoon Depth to Water level Pre-monsoon Depth to Water level Post-monsoon Depth to Water level Post-monsoon Water level Fluctuation Pre & Post-monsoon Water level Fluctuation Pre & Post-monsoon 2009 ii
4 CHAPTER 1.0: INTRODUCTION Jindal Steel & Power Limited (JSPL) is a well established and one of the largest steel plant in India and is located at Kharsia Road, Raigarh, Chattisgarh state. The company manufacturers sponge iron, mild steel, ferro chrome, iron ore, mild steel, and coal based sponge iron. The company is also involved in power generation. The plant is based on the latest technologies with all modern tools and spread over a geographical area of 1800 Acres. In the initial stages of commissioning and development, the total water requirement of the plant was met from surface water as well as ground water. Nearly 1200 m 3 /hr of raw water is brought from river Kelo by means of an 11 km pipeline as per the permission of Irrigation department; the water is drawn from a stop dam constructed at river Kelo downstream of Raigarh town. The water brought from the river is stored in the reservoir created for this purpose in the plant area. The contribution of ground water is about 400 m 3 /hr which meets the supplementary water demand of the project. Water being one of the important inputs to development and to ensure the availability, JSPL has constructed seven large ponds inside the premises to store water for use during the dry season. After the plant became operational, several environmental measures has been taken up in the plant area including rain water harvesting, land leveling and construction of artificial recharge structures for augmentation of ground water as well as roof top rain water harvesting in the covered areas. With the increasing use of groundwater for various activities the fast decline in groundwater was observed in the area including the JSPL project area. In order to prevent the aquifer from fast depletion, the artificial recharge was planned and implemented in Similar activities have also been taken up in other parts of Raigarh. 1.1 LOCATION AND EXTENT JSPL has total integration of the Raigarh Plant with captive coal mines and coal washery, captive Iron ores mines and captive power plants. The existing steel plant located at 1
5 village Patrapali in Raigarh district has been expanded gradually to integrate various manufacturing and other subsidiary units, raw material yards and workshop, administrative and service blocks, township, green belt, water reservoir and open spaces. In the beginning the project area was about 800 acres, with the expansion of the project activities several additional units have been added and the project area has increased to 1800 acres. There are 14 villages around 10 km of the plant area. Raigarh town is situated about 6 km from the site in south east direction. Majority of the area of plant is occupied by the two major geological formations namely hard rock consisting of sandstones and unconsolidated sandy formations. More than 70% of the area is paved and rest of the area is under green belt. The location of the plant is shown on the administrative map of the Raigarh district in Fig An area of about 10 sq km around the JSPL has been considered as study area as shown in Fig The a general synoptic view of the area, the Google image showing the project area and the layout of the JSPL project area is given in Fig. 1.3 and Fig. 1.4 respectively. 1.2 OBJECTIVE AND SCOPE OF STUDY Consequent upon various developmental activities took place in the JSPL plant area as well as in the surrounding villages, including construction of number of water reservoirs and ponds there is noticeable change in the overall land and water environment of the area including the ground water condition. The preset study aims at appraisal of the ground water condition in the JSPL plant and in the surrounding areas using various analytical tools and satellite data. Application of modern tools like remote sensing and image processing are very commonly being used internationally to compare the pre project and post project scenario. The scope of the present work includes studying the changes in land morphology and utilization pattern, changes in the soil moisture and consequently the appraisal of ground water conditions of the area which in turn controls the rainfall and runoff relationship. One of the important aspects proposed to be studied in detail is impact of water storage reservoirs, number of 2
6 ponds and water conservation structures on the ground water regime and soil moisture of the area in time and space. 3
7 CHAPTER 2.0 : GEO-MORPHOLOGY AND LAND USE 2.1 GEO-MORPHOLOGY Geo-morphologically the study area can be categorized under structural hills and Pediplain /pediment. The Physiography of the basin is controlled by geological formations namely sandstone, shale, siltstone, limestone and coal seams. The major part of the JSPL project area is occupied by hard rock formation consisting of sandstones dotted with outcrops of sandstone. The northern part of the study area is represented by undulating topography, the low lying areas consists of thicker overburden sediments as compared to areas with exposed outcrops. The southern part of the area represented by pediplain and represents the degradation zone. The area in the central part depicts gentle slope except at locations occupied by plants and sheds where land leveling and treatment has been made. The geomorphological map of the study area is shown in Fig The perusal of map indicates that broadly there are three distinct geo-orphic units in the area namely the structural hills, pediment and dissected pediplain. Major part of the study area is occupied by dissected pediplain which is an extensive erosion surface interrupted by the occasional outcrops. In the post project scenario in general there is no remarkable change in the overall geomorphic set up and topographic contours of the area, however, due to land leveling and various constructional activities including buildings and shades the morpho-metric arrangement and courses of natural drains might have changed. There are few lower order streams mostly intermittent in nature appears to originate from the plant area. Slope management is one of the important aspect in the devising the layout and design of the plant area. Accordingly, the location of green belts, open areas, water reservoir as well as ponds has been located and designed. Further, while finalizing the layout plan of the plant area, the courses of some of the natural drains have been diverted so as to accommodate the runoff in the water reservoirs or ponds designed for the purpose. 4
8 2.2 LAND USE AND DRAINAGE Before the JSPL plant came in to existence the entire area used to an agricultural land; however, limited cultivation were plasticized in the area. Availability of assured water supply for agriculture, especially at the time of requirement and in the lean season water was one of the major constraints in the area. There are no perennial surface water sources in the nearby area; the nearest major river in the area is river Kelo which is located at about 11 km. The ground water availability is also not ensured and sustainable. In the initial stage of commissioning, the JSPL project area was 800 Acres ( 234 hectares) which comprised of various manufacturing and auxiliary units, raw material yard and workshop, administrative and service Blocks (about 150 ha), township (about 70 ha), green belt and greenery (26 ha),water reservoirs (25ha) and balanced roads and open spaces. The ash pond is located in an area of about 38 ha land on the southern site of JSPL premises, across the railway lines. Ash slurry is pumped to the ash pond and overflow water is re-circulated back by means of 1.5.km long ash water pipe lines. Out off the open spaces available inside JSPL premises about 9.3 ha land was proposed to be utilized for the expansion projects. In order to study the changes in the land use pattern and its overall impact on the natural resources such as soil and water in the pre project and post project scenario, the satellites data for the two periods i.e. year 2003 and 2009 have been analyzed using the advanced tools of remote sensing and digital image processing integrating with GIS REMOTE SENSING AND GIS STUDIES Remotely sensed satellite images and subsequent digital image processing is very important tools for appraising the land use pattern changes, ground water resource evaluation and management. Satellite images gives an aerial view and helps in detecting and mapping regional structural patterns, including major fracture and fault systems, also assist in understanding the interrelationship of surface and ground water. With advent in high speed computers, Remote Sensing and GIS combined with traditional geologic field 5
9 mapping has become the most advanced tool to evaluate ground water resources. Various enhancement and manipulation procedures are being applied to the digital satellite images; the results, in digital and hardcopy format, are being used for field mapping and analyzing the regional structures. The remotely sensed satellite and airborne images spatial coverage help in mapping and monitoring the earth surface at local and/or regional scales. The advantages offered by remotely sensed satellite image data include: It provide a synoptic/regional view compared to both aerial photographs and ground sampling, It is cost effectiveness, It is has high spatial resolution and coverage compared to ground sampling, and It provides relatively high temporal coverage on a long term basis. CONCEPT: Remotely sensed images contain both spectral and spatial information. The spectral information provides various properties and characteristics about the surface cover at a given location or pixel (that is, vegetation and/or soil type). The spatial information gives the distribution, variation, and topographic relief of the cover types from pixel to pixel. Therefore, the main characteristics that determine a pixel's brightness/reflectance and, consequently, the digital number (DN) assigned to the pixel, are the physical properties of the surface and near surface, the cover type, and the topographic slope. USE OF REMOTE SENSING IN PRESENT STUDY: The main focus of the remote sensing and digital image processing component under this study is to use both remotely sensed digital satellite images and a Digital Elevation Model (DEM) to extract spatial information related to topographic feature patterns, geological, geo-morphological and structural features and drainage pattern in the area. The digital data on various resolutions available from different sources has been used for studying 6
10 the different hydrogeological features so as to appraise the changes took place after the JSPL plant came in to existence, especially in terms of land and water availability, soil moisture conditions etc. The image interpretation focuses in fact, on two interrelated aspects i.e. the (hydrogeological subsurface configuration and surface features which influence recharge and show evidence of groundwater outflow. There are two categories of indicators that exist for groundwater with respect to remote sensing data and are listed as below:- 1) FIRST-ORDER INDICATORS These are directly related to ground-water occurrence such as springs, canals, lakes, ponds, and other surface water features. 2) SECOND-ORDER INDICATORS These include hydrogeological parameters that may reflect the ground-water regime, such as drainage characteristics, fracture systems, geological structure, and landform characteristics. The digital data obtained is subjected to the digital image processing. The data is visually interpreted for features identifications and demarcating their extent in the space. Based on the visual interpretation the sample areas has been selected for picking up the digital signature of the features for computerized supervised classification. In the analysis of image, attempt has been made to locate the following features: Evidence of permeable conditions (non-eroded thick soils, colluvial deposits, windblown sands, etc.) over a dipping rock sequence with good transmissivity? If so, the recharge may be high, particularly when no deep-rooted and dense vegetation is present. Appearance of water in rivulets, for example, in ephemeral beds which signifies the emergence of groundwater. If the pattern of the emergence points in an 7
11 alluvial area is fairly straight, could that be a sign of a buried barrier, such as a fault bringing up rocks of low permeability, or a buried escarpment? Observed disappearance of base flow in river beds indicative of water loss by infiltration in permeable river bed deposits with the groundwater level below the river bed. Sometimes it again appear further downstream (a typical case of a groundwater flow system in an alluvial fan aquifer) or is it not seen again (flowing out through rock formations, large fractures)? The drainage pattern, drainage density of the area? What are the landforms in the area? Demarcation of micro-watersheds The various scenes of IRS satellite images of the study area is shown in Fig 2.2 & 2.3. The red square shown on the satellite image indicates the location of JSPL. Different filters have been used so as to enhance the typical geomorphic features relevant to ground water occurrence and to indentify high soil moisture areas. Standard land use classification has been used for categorizing the different land use type. In the present study a integrated approach has been adopted by using the different thematic data / information and have been analyzed. In addition to the above satellite data, the following collateral data namely daily rainfall, groundwater levels, groundwater table, geophysical data, borehole data and water quality were used in the analysis. The Land use / Land cover map generated by image processing for the initial stage of project i.e. year 2003 and for the year 2009, the same is shown in Fig. 2.4 and 2.5 respectively. Perusal of both these maps indicates that as such there is no remarkable change in the land use pattern of the area on regional scale. However, the expansion of the project area and increase in number of water bodies can be visualized in the project as well as study area. From Fig. 2.4 & 2.5, the land use and water bodies shown in the year i.e it can be observed that in the southern part of the study area several small pond and water bodies have come up, one of the obvious reason could be increased ground 8
12 water recharge in the area due to seepage from number of water storage tanks constructed in the project area, which are mostly unlined. The general ground water flow in the area is from north to south and hence there is cumulative rise in ground water level in the southern part, which is also confirmed by water level observations. At the same time the ground water withdrawal has also reduced from the area. 9
13 CHAPTER 3.0: CLIMATE AND RAINFALL The area enjoys sub-tropical climate with hot summer followed by well-distributed rainfall through South-West monsoon season. The winter commences from December and last till the end of February. The period from March to the end of May is hot season. The monsoon season starts from the middle of June and last till the end of September. The average daily annual normal temperature for the area is 30 C. During the summer season humidity is lowest i.e. about 36% and is highest during the South-West Monsoon period i.e. about 82%. The rainfall of the area is dominated by the South-West Monsoon, which starts in the middle of June each year and ceases by the end of September or beginning of October. At the project planning stage in the year , the run off as well as water management and harvesting plan has been based on the average rainfall of 1340 mm as per the records available. Accordingly the runoff has also been computed for different type of areas such as open area, paved area and built area. In the post project scenario an attempt has been made to assess the rainfall changes. From the monthly rainfall data of Raigarh district for the period 2004 to 2008 as given in table 3.1 along with the graph. It may be observed that in general there is increasing trend in the annual rainfall from 2004 to The annual rainfall to the tune of 1514 mm in the year 2008 is nearly 20 % excess than the average rainfall i.e mm as considered during the planning stage of the plant. However, during 2009 there is significant decrease in the annual rainfall of Raigarh district and goes to five year low. 10
14 Table : 3.1 Monthly Rainfall at Raigarh Observatory for the Period ( Source : IMD) Year January February March April May June July August September October November December Annual Total ( mm) Annual Rainfall, Raigarh ( ) 11
15 CHAPTER 4.0: APPRAISAL OF GROUND WATER CONDITION 4.1 HYDROGEOLOGY In the study area the most prevalent rock types include rocks of Gondwana Super-group and Chhattisgarh Super-group. The sandstone, siltstone, limestone and shale etc. occurring in the area belong to these super-groups. The occurrence, movement and distribution of ground water in the natural framework of the area show moderate variations and are broadly controlled by the depth of weathering, fracture patterns, geomorphologic set up, and lithology. Both soft and hard rock occur in the area. Detailed hydrogeological investigation, geophysical surveys and exploration aided by drilling has been carried out in the area time to time by various agencies including CGWB to establish the aquifer geometry of shallow and deep aquifers, their parameters and ground water regime and its long-term behavior. The rock material controlling ground water flow in the area can be broadly divided into two major aquifer system (1) Fractured media and (2) Porous media. The shallow aquifers both in hard and soft rocks in the area are wide spread and are being tapped through dug wells, dug cum bore wells or shallow bore wells drilled to a depth of 60 m. The Hydrogeological map of the study area is given in Fig The perusal of the map indicates that the entire study area except in the north eastern corner including project area fall under hard rock terrain, however there is variation in yield potential of wells. Generally, in the major part of the area bore well up to 150 m depth are feasible which may yield up to 600lpm. In the north eastern part however less yielding aquifers are encountered. FRACTURED MEDIA: The hard rock forming the fractured media consists of basement crystalline with Supra crustal and consolidated sedimentary of Chhattisgarh Super-group. The hard rock occupies southern part of the study area. The ground water occurrence in hard rock particularly in crystalline and metamorphic terrain is restricted to phreatic zone only which extends down to 60 m. Exploration, in this terrain revealed that no potential zone occurs below phreatic zone. The distribution of ground water in these formations show that the morphological low areas have 12
16 better ground water prospect than the highs. The area is suitable for dug wells and shallow bore wells up to 60m depth. The wells tapping deeper fractures up to 150 m can yield up to 600 lpm. The weathered mantle and shallow fractures mainly constitute the shallow aquifers. In the areas occupied by hard rocks the thickness of weathered mantle varies from 5 to 20 m bgl. Nearly 90% of open wells are in the depth range between 5 and 15 mbgl. The hand pumps installed by PHED for drinking water taps the shallow fracture zone down to 60m bgl. The deeper aquifers have been identified in both hard and soft rocks. The development of the deeper aquifer in hard rock area is localized occupied by Raigarh Formation. The deeper aquifer is being tapped for irrigation purposes by using power pumps. The depth of these bore wells varies between 60 to 150 m bgl. The rocks of Chhattisgarh Super group comprise of both phreatic and semi confined aquifer in weathered mantle, fractures and cavernous zones. The Chandarpur sandstone covers mostly on hill ranges. The sandstones of Chandarpur is highly silicified and devoid of primary porosity. They produce springs in the area. The low-lying Chandarpur sandstone covered area has phreatic aquifer. The Chandarpur shale is acquiclude in nature, they hardly posses any weathered zone and covers a small area in Raigarh block. The occurrence of ground water in shales of Raigarh Formation is restricted to weathered mantle only. The limestone of Raigarh Formation around Sarangarh is also not productive except at Kudhri, where the limestones are largely productive and suitable for bore wells down to depth of 15m bgl. Over all, the Raigarh Formation covered area in the area is best for ground water development because of its high yield potential. The aquifer can be divided into two zones shallow and deeper aquifers. The shallow aquifer in Granitic terrain also has poor sustainability but not that severe as in areas covered by Raigarh Formation. The dug wells are abandoned or defunct in large parts of Raigarh. The important aquifer parameters controlling the ground water flow and storage are transmissivity and storage coefficients. The aquifer parameters for hard rock especially for Raigarh Formation in terms of transmissivity vary from 12 to 64 m 2 /day, which may be due to 13
17 the presence of fracture and solution cavities in the formation. The storativity values range from 0.16 x 10⁻⁴ to 1.18 x 10⁻⁶ which corresponds to semi confined to confined aquifer. The parameters of the aquifer underlying the study area have been determined by CGWB through pumping test. The transmissivity value of Gondwana sandstone formations are poor to moderate in transmissivity and vary from 3 to 142 m 2 /day, the storativity value ranges from 7.8 X 10⁻⁴ to 4 X The alluvium covered areas particularly along Kelo River have good potential aquifer in shallow zones and are good for development through filter point wells. The distribution of ground water in this alluvium is not continuous but in isolated patches. 4.2 GROUND WATER LEVELS Ground water level in the entire district as well as study area is being monitored by different agencies including Central Ground Water Board since Most of these well being monitored are open well / dug wells. The depth of these dug wells varies between 7 and 18 m and their diameter varies from 1.5 m to 5.15 m, in the hard rock areas, the diameter is comparatively more so as to store more water coming out of the weathered or fractured hard rocks. The time series data of these observation wells have been analyzed in order to assess the long term changes in the ground water regime of the study area as well as in the JSPL project area. After the commissioning of Jindal Steel plant, the land use pattern of the project area has changed, further, due to construction of water storage reservoirs and number of water bodies/ ponds, it is also expected that, the overall ground recharge component by water bodies other than rainfall might have significant impact on the overall ground water regime of the area. The ground water level measured recently at some of the piezometers in the project area is given in Table 4.1. The ground water level in the project area varies from 1 mbgl to as deep as 9 m adjacent to Ash dyke II in the northern part of the project area. As one moves southwards the ground water level becomes shallower. 14
18 Table 4.1: Depth to Water level in Piezometers in JSPL Plant S No Location Dry/Wet Water Level (in m) 01 East side of Ash Dyke 1 Wet South 1 (Near Pump House) Wet South 2 (Near Pump House) Wet Center of Both Ash Dyke Dry - 05 North west side of Ash dyke - II Dry West side of coke oven Wet Between Sinter plant & RMH Removed - 08 Near TP Nagar Wet Parsada Near Main Gate Removed - 10 South side of Parsada (near Village) Dry South-west side of Parsada Dry 8.0 In order to compare the ground water regime conditions in the pre project and post project scenario, the depth to water level map of pre and post monsoon periods for the year 2003 and 2009 have been prepared in the GIS platform using suitable interpolation technique. The permonsoon depth to water level maps for both the periods is shown in Fig. 4.2 and Fig. 4.3 respectively. Perusal of the pre-monsoon water level map for the year 2003, depicting the depth to water level zones in meter below ground level indicates that in general the depth of ground water increases as we move from south to north or north-west in the study area. In the south the water level ranges from 5-10 mbgl and in the north the water level is as deep as 30-40m bgl. In the project area, the ground water level is in the range of mbgl in major part in the north and north east, and the water level in the southern part is in the range of mbgl. 15
19 Whereas, the depth to water level map for the pre monsoon, 2009 indicates a significant improvement in terms of rise in ground water level in the entire area, in the southern portion of the study area a new zone depicting ground water level in the range of 3-5 mbgl has appeared, similarly the area under mbgl has drastically reduced and now the entire project area represents ground water level in the range of 5-10 m bgl, major part of which was earlier in the depth range of mbgl. Similarly, the depth to water level scenario during post monsoon periods for the year 2003 and 2009 as shown in Fig. 4.4 and 4.5 respectively depicting significant overall rise in ground water level in the study area as well as in the project area, the water level in the range of m has reduced and currently the entire project area reflects a water level in the range of 5-10 m. 4.3 GROUND WATER FLUCTUATION Ground water level fluctuation between the pre monsoon and post monsoon water level measured in the month of May and November respectively is one of the measure of rainfall recharge and in turn gives the volumetric estimate of replenishable ground water resources of the area. The other input to the ground water includes seepage from water bodies, canals etc. The fluctuation map as shown in Fig. 4.6 and 4.7 for the year 2003 and 2009 indicates the extent of saturation of the unconfined aquifer. From the fluctuation map for the year 2003 it may be observed that in the northern part with comparatively deeper water level there is more fluctuation in the area where the ground water level was deep and conversely the area with shallower water level indicates less fluctuation which in turn also indicates the spatial extent of un-saturated zone. In the project area, the water level fluctuation in the year 2003 is between 2-4 m, where as in the year 2009 it has reduced to less than 2 m, the reason may be attributed to overall rise in ground water level resulting in to reduction in thickness of unsaturated zone as it is already filled with water due to seepage from number of water storage tanks and ponds. 16
20 4.4 GROUND WATER DRAFT In the Raigarh district ground water abstraction is mainly through dug wells and bore wells /tube wells. Dug cum bore wells and filter point wells are also used for ground water abstraction in limited area. In general the dug wells are 5-15 m deep tapping the weathered zone or shallow fracture or granular zone and bore wells/tube wells are m deep. The mode of lifting of water for drinking purpose from dug wells is mainly through rope and bucket. Wells fitted with Mohats or electrical pumps are in use for irrigation. The bore/tube wells and hand pumps in the area tap water from m bgl. The hand pumps and power pumps are the prime source of ground water abstraction presently. More than 1000 hand pumps and over 1700 power pumps are running in the block at present. Though, the overall stage of ground water development was low in the district during 2003, isolated pockets in the district indicated comparatively deeper ground water level and long term decline in ground water level. The study area as well as project area has also indicated fall in water level in long term. Drying of open wells, deepening of tube wells / bore well has also been reported from the area. However, due to various water conservation measure implemented by JSPL in the plant area there had been a significant change in the ground water regime of the area as well as in the withdrawal pattern. In the initial stages of commissioning of the JSPL the total water requirements was met mainly by ground water. The ground water withdrawal was to the tune of 400 m 3 /hr through number of tube wells / bore wells constructed in the project area. The balance requirements were met from river Kelo. With time, the ground water withdrawal has been reduced for meeting the water requirement of the plant and as on now the ground water withdrawal is minimal, the entire water requirement is being met from surface water brought from river Kelo. Further, the water brought from the river is stored in the water reservoirs and ponds created in the project area which meets the requirement throughout the year. Seepage from these unlined ponds, in which, some of them are as deep as 11 m bgl, could be one of the reason for additional recharge to ground water and rise in water level in the project as well as surrounding areas. Due to surface poundage and rise in water level the overall soil moisture condition of the area has improved which in turn has helped the farmers of the area in 17
21 agriculture. As such, no significant change in ground water quality has been reported from the area and the quality of ground water is potable in the area. 18
22 CHAPTER 5.0: OBSERVATIONS AND CONCLUSION Jindal Steel & Power Limited (JSPL) is a well a established Industrial name in the steel sectors in India. It is located at about six kms from the Raigarh town in Chattisgarh State. The entire steel plant is highly mechanized with all modern facilities. In the beginning the project area was about 800 acres, subsequently various subsidiary units have been added and the project area has increased to about 1800 acres. The study area including the JSPL plant area is broadly underlain by hard rock with gentle slope, predominant rock type is sandstones. The overburden thickness increases as we move away from the northern hills from north to south in the study area. Being a hard rock terrain the aquifers with secondary porosity is not very productive and the occurrence of ground water is limited to wreathed zone and the deeper fracture zone. In the initial phase of commissioning of JSPL, ground water contribution for meeting the water demand was to the tune of 400 m 3 /hr. In general also, the ground water withdrawal in the area is comparatively more. Since the aquifers are not high yielding, the decline in ground water level has been observed in the area on long term basis. In view of the increasing stress on ground water and gradual decline in ground water level of the area, various initiatives have been taken up by JSPL authorities so as to improve the ground water situation in the area. Consequent upon various developmental activities took place in the JSPL plant area as well as in the surrounding villages, including construction of number of water reservoirs and ponds there is noticeable change in the overall land and water environment of the area including the ground water condition. The objective of the present study is to assess the ground water regime changes with time using various analytical tools including remote sensing, image analysis and GIS. A comparative analysis of the ground situation has been attempted to quantify the changes in ground water condition of the area. 19
23 The scope of the present study includes evaluation of the changes in land morphology and utilization pattern, changes in the soil moisture and consequently the appraisal of ground water conditions of the area, which in turn controls the rainfall and runoff relationship. One of the important aspects proposed to be studied in detail is impact of water storage reservoirs, ponds and water conservation structures on the ground water regime and soil moisture of the area in time and space. The various scenes of IRS satellite images of the study area has been studied using different filters to enhance the typical geomorphic features relevant to ground water occurrence and to indentify high soil moisture areas. The comparison of the land use maps generated through remote sensing data for the year 2003 and 2009 indicates that as such on regional scale there is no remarkable change in the land use pattern. However, the expansion of the project area and increase in number of water bodies can be visualized in the project area. Further, it has also been observed that in the southern part of the study area several small pond and water bodies have come up. A significant change in the rainfall pattern of the Raigarh district has been observed during the period 2004 to 2009, In the last six years. In general there is increasing trend in the annual rainfall from 2004 to The annual rainfall to the tune of 1514 mm in the year 2008 is nearly 20 % excess than the average rainfall i.e 1340 mm as considered during the planning stage of the plant. However, during 2009 there is significant decrease in the annual rainfall of Raigarh district. The ground water level measured recently at some of the piezometers in the project area varies from 1 mbgl to as deep as 9 m in adjacent to Ash dyke II in the northern part of the project area. The ground water level becomes shallower southwards. In order to compare the ground water regime conditions in the pre project and post project scenario, the depth to water level map of pre and post monsoon periods for the 20
24 year 2003 and 2009 have been prepared in the GIS platform using suitable interpolation technique. Perusal of the pre-monsoon water level map for the year 2003, depicting the depth to water level zones in meter below ground level indicates that in general the depth of ground water increases as we move from south to north or north west in the study area. In the south the water level ranges from 5-10 mbgl and in the north the water level is as deep as 30-40m bgl. In the project area, the ground water level is in the range of mbgl in major part in the north and north east, and the water level in the southern part is in the range of mbgl. Comparison of pre monsoon depth to water level map of the area for the year 2003 and 2009 indicates a significant improvement in terms of rise in ground water level in the entire area, in the southern portion of the study area a new zone depicting ground water level in the range of 3-5 mbgl has appeared, similarly the area under mbgl has drastically reduced and now the entire project area represents ground water level in the range of 5-10 m bgl, major part of which was earlier in the depth range of mbgl. Similarly, the depth to water level scenario during post monsoon periods for the year 2003 and 2009 depicts significant overall rise in ground water level in the study area as well as in the project area. Ground water level fluctuation between the pre monsoon and post monsoon water level is one of the measure of rainfall recharge and in turn gives the volumetric estimate of replenishable ground water resources of the area. The fluctuation map for the year 2003 and 2009 indicates the extent of saturation of the unconfined aquifer. From the fluctuation map for the year 2003 it may be observed that in the northern part with comparatively deeper water level there is more fluctuation in the area where the ground water level was deep and conversely the area with shallower water level 21
25 indicates less fluctuation which in turn also indicates the spatial extent of un-saturated zone. In the project area, the water level fluctuation in the year 2003 is between 2-4 m, where as in the year 2009 it has reduced to less than 2 m, the reason may be attributed to overall rise in ground water level resulting in to reduction in thickness of unsaturated zone as it is already filled with water due to seepage from number of water storage tanks and ponds. The overall stage of ground water development is low in the district; isolated pockets indicated comparatively deeper ground water level and long term decline in ground water level. In the initial years of project commissioning fall in water level on long term basis has also been recorded. Drying of open wells, deepening of tube wells / bore well has also been reported from the area. Due to various water conservation measure implemented by JSPL in the project area there is a significant change in the ground water regime of the area as well as in the withdrawal pattern. In the initial stages of commissioning of the JSPL the total water requirements was met by surface water and ground water. With time, the ground water withdrawal has been reduced for meeting the water requirement of the plant and presently the ground water withdrawal is minimal, the entire water requirement is being met from surface water brought from river Kelo. The water brought from the river is stored in the water reservoirs and ponds created in the project area which meets the requirement throughout the year. Seepage from these unlined ponds has significantly added to the overall recharge to ground water which is reflected in terms of rise in water level in the project as well as surrounding areas. Due to surface poundage and rise in water level the overall soil moisture condition of the area has improved which in turn has helped the farmers of the area in agriculture. As such, no significant change in ground water quality has been reported from the area and quality of ground water is potable in the area. 22
26 Fig. 1.1: Administrative map of Raigarh district with Location of Project Site
27 Fig. 1.2: Map showing the Study Area


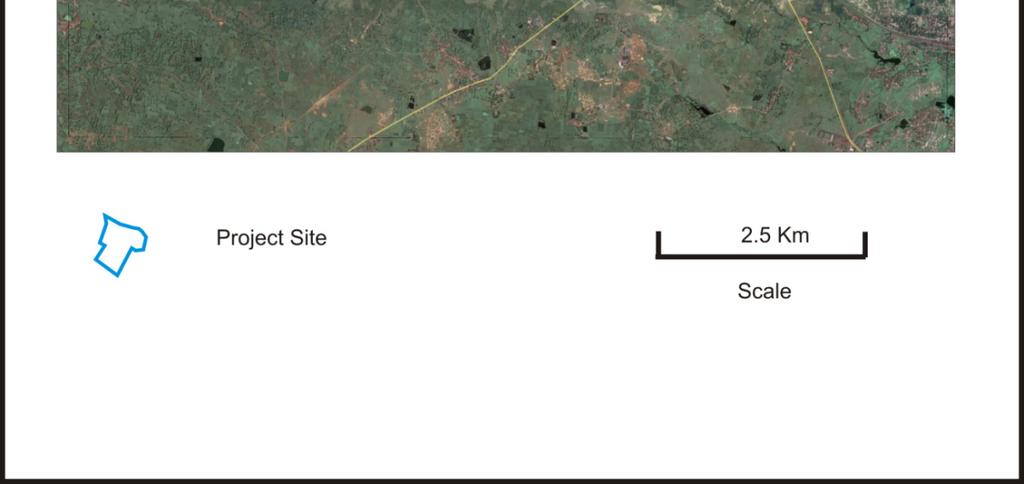
28 Fig. 1.3: Google Image of the Study Area

29 Fig 1.4: Project site layout of JSPL plant

30 Fig. 2.1: Geo-morphological map of Study Area

31 Fig. 2.2: Different Scenes of Satellite Image

32 Fig. 2.3: Different Scenes of Satellite Image

33 Fig. 2.4: Land Use Map of the study area for 2003

34 Fig. 2.5: Land Use Map of the study area for 2009

35 Fig. 4.1: Hydrogeological Map of Study Area

36 Fig. 4.2: Depth to Water level Pre-monsoon 2003
37 Fig. 4.3: Depth to Water level Pre-monsoon 2009

38 Fig. 4.4: Depth to Water level Post-monsoon 2003

39 Fig. 4.5: Depth to Water level Post-monsoon 2009

40 Fig. 4.6: Water level Fluctuation Pre & Post-monsoon 2003

41 Fig. 4.7: Water level Fluctuation Pre & Post-monsoon 2009