Introduction to Integrated Resource Recovery Center (IRRC) Approach
|
|
|
- Tiffany Reed
- 5 years ago
- Views:
Transcription
1 Introduction to Integrated Resource Recovery Center (IRRC) Approach Iftekhar Enayetullah, Co-Founder & Director Waste Concern National Workshop on Pro-Poor and Sustainable Solid Waste Management in Secondary Cities: Prospects for Application of Anaerobic Digestion To Treat MSW in Indonesia 13-14, November, 2014 Jakarta, Indonesia web:
2 Presentation Outline 1. Overview of Waste Sector 2. Current Practice of Waste Management in the Region 3. What is IRRC Approach 4. Examples of IRRCs from Bangladesh 5. Benefits of IRRC Approach and Its Link with Sustainable Development

3 Waste Generation Worldwide and in Developing Countries It is estimated that 5.2 million tons of solid waste are generated daily worldwide, of which 3.8 million tons are from developing countries. 5.2 million tons/ day Worldwide 3.8 million tons/ day Developing countries % organic Waste Generation
4 Global Perspective on Urban Solid Waste Characteristics Composition of Raw Waste (by wet weight) Low Income Country Middle Income Country Vegetable/Putrescible % 40 to to 65 7 to 55 Paper and Carton % 1 to to to 50 Plastic % 1 to 11 2 to 13 2 to 20 Metal % 1 to 5 1 to 5 3 to 13 Glass% 1 to 10 1 to 10 4 to 10 Rubber, Misc.% 1 to 3 1 to 5 2 to 12 Fines % (sand, ash, broken, glass) 15 to to 40 5 to 20 High Income Country Other Characteristics Moisture % 40 to to to 35 Density in Trucks, Kg/C.M 250 to to to 200 Lower Heating Value, K Cal/Kg 800 to to to 2700 Source: World Bank ( 2012) What a waste: A Global Review of Solid Waste Management
5 Global Perspective: Solid Waste Management Costs Versus Income LOW INCOME COUNTRY MIDDLE INCOME COUNTRY HIGH INCOME COUNTRY Average WASTE GENERATION 0.2 t/capita/y 0.3 t/capita/y 0.6 t/capita/y Average INCOME FROM GNP 370 $/capita/y 2,400 $/ capita/y 22,000 $/ capita/y Collection Cost $/t $/m $/t. Transfer Cost 3-8 $/t $/t $/t. Sanitary Landfill Cost 3-10 $/t $/t $/t. TOTAL COST WITHOUT TRANSFER $/m.t $/t $/t. TOTAL COST WITH TRANSFER $/t $/t $/t. Total Cost per Capita 3-10 $/capita/y $/capita/y $/capita/y COST AS % OF INCOME % % % Source: World Bank ( 2012) What a waste: A Global Review of Solid Waste Management
6 Disposal Costs by Alternative Technologies for Large Cities LOW INCOME COUNTRY MIDDLE INCOME COUNTRY HIGH INCOME COUNTRY Average GNP 370 $/capita/y 2,400 $/capita/y 22,000 $/capita/y OPEN DUMPING $/ 1-3 $/t 5-10 $/t SANITARY LANDFILL 3-10 $/t 8-15 $/t $/t TIDAL LAND RECLAMATION 3-20 $/t $/t $/t COMPOSTING 5-20 $/t $/t $/t INCINERATION $/t $/t $/t Country Income Group 2010 Cost 2025 Cost Low Income Countries $1.5 billion $7.7 billion Lower Middle Income Countries $20.1 billion $84.1 billion Upper Middle Income Countries $24.5 billion $63.5 billion High Income Countries $159.3 billion $220.2 billion Total Global Cost (US$) $205.4 billion $375 billion Source: World Bank 2013, What a Waste


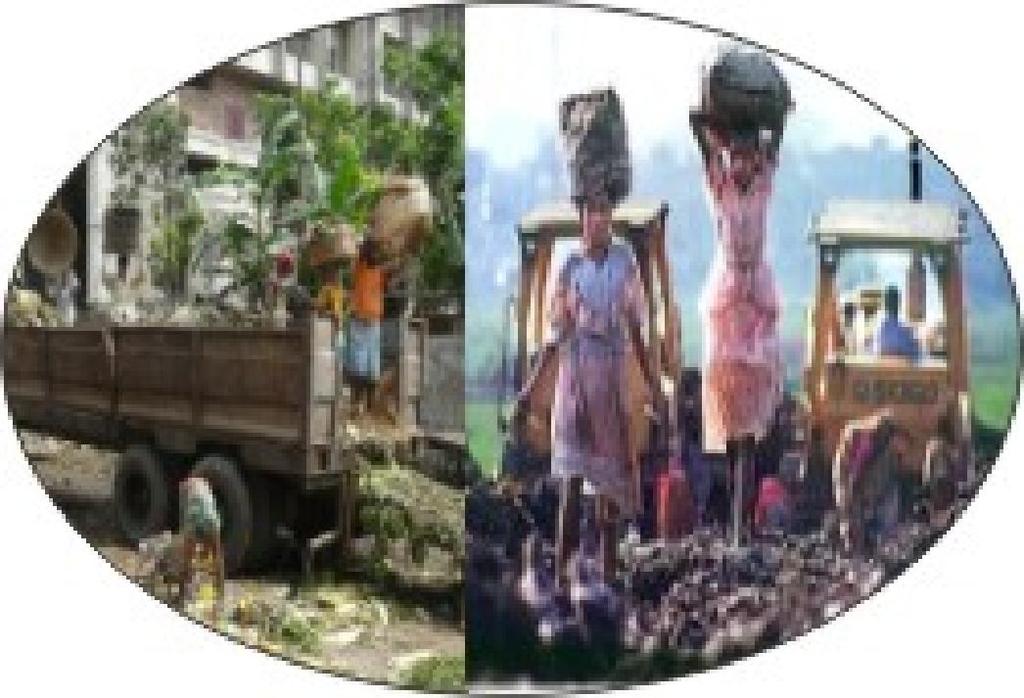
7 Present Situation in Developing Countries Source of Waste Mixed Waste Waste Bins Demountable Containers Transfer Stations Landfill PROBLEMS Water Pollution Spread of Disease Vectors Green House Gas Emission Odor Pollution More Land Required for Landfill

8 PROBLEMS FROM PRESENT PRACTICE VERMINS Spreading more than 40 Diseases METHANE GAS Bad Odor & Green House gas LEACHATE Polluting Ground & Surface Water Current approach: waste management not resource recovery

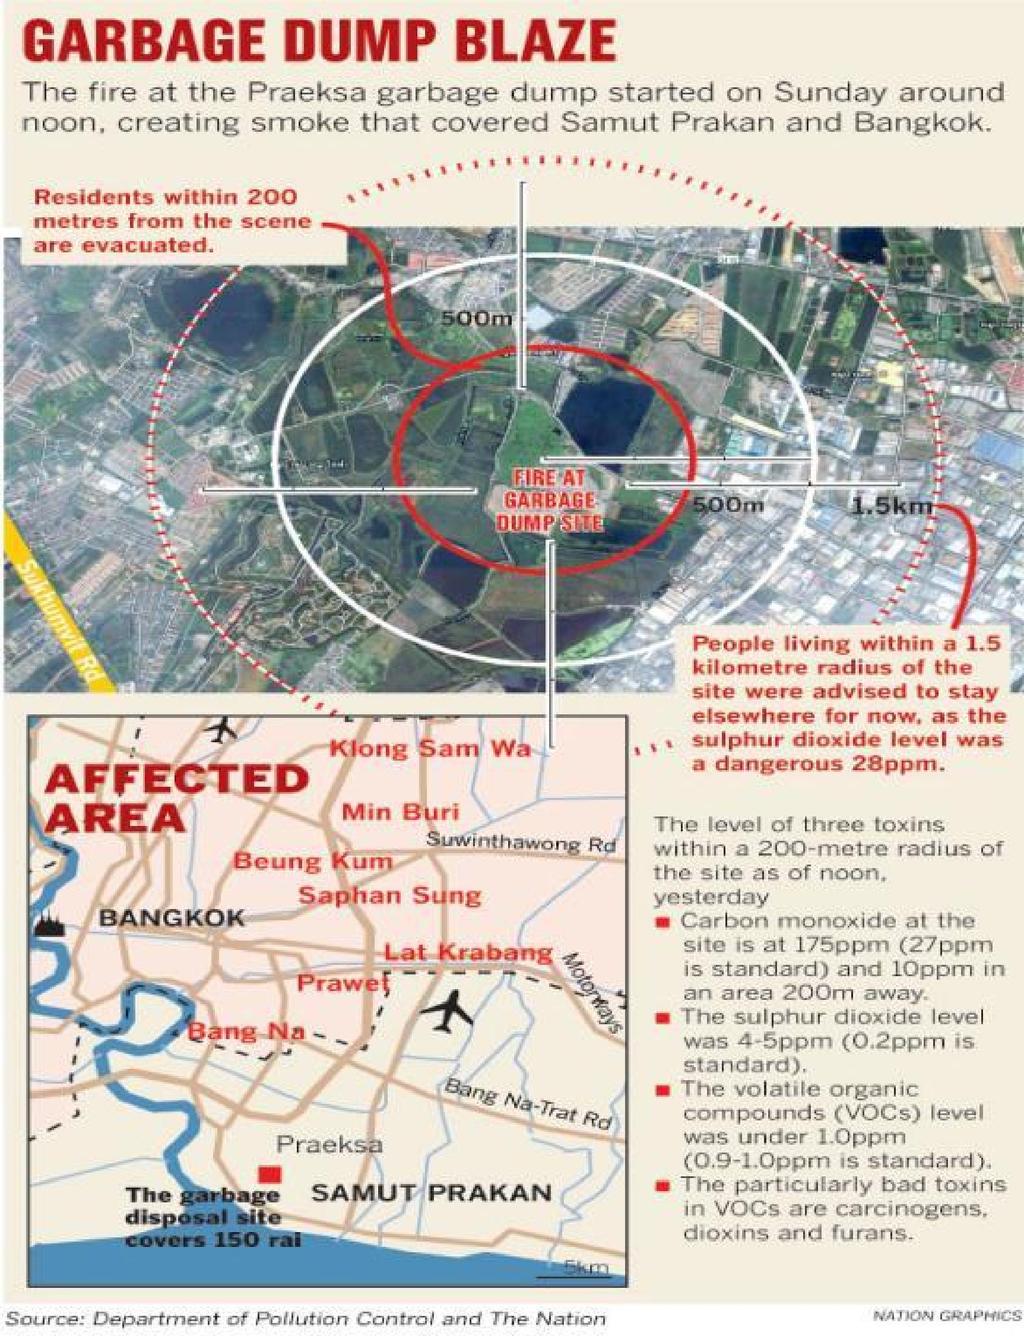
9 Samut Prakan, Thailand Dumpsite on Fire on Monday March 17, 2014 Residents told to leave areas around burning Samut Prakan dump after toxic fumes detected PROVINCIAL OFFICIALS ordered the evacuation of residents from about 1,500 homes in Samut Prakan after a fire at a local garbage dump yesterday was declared a disaster area, and toxic fumes spread to many parts of the province and nearby areas in Bangkok.


10 Samut Prakan, Thailand Dumpsite on Fire on Monday March 17, 2014
11
 Treat and Process Composting/ Recycling Minimise Avoid The Waste Management Hierarchy (Present")
12 Strategy for Improvement (3R) Avoid Minimise Composting/ Recycling Treat and Process Dispose (controlled) Dump The Waste Management Hierarchy Dump Dispose (controlled) Treat and Process Composting/ Recycling Minimise Avoid The Waste Management Hierarchy (Present Situation)
, in partnership with Waste Concern, has been")


13 What is Integrated Resource Recovery Centers (IRRCs)? Since 2007, the United Nations Economic and Social Commission for Asia and the Pacific (ESCAP), in partnership with Waste Concern, has been promoting decentralized and Integrated Resource Recovery Centers (IRRCs) in secondary cities and small towns in Asia-Pacific with the objective to recover value from waste and provide livelihood opportunities to the urban poor. IRRC is a facility where significant portion (80-90%) of waste can be composted/recycled and processed in a cost effective way near the source of generation in a decentralized manner. IRRC is based on 3 R Principle. 100% Collected with user fee 80% Compost Agriculture House-to-house waste collection method 86% RECYCLED Biogas Bio diesel & Glecerine RDF Energy Waste IRRC 6-10% Recyclables Local market 10-14% Non-compostable Landfilled GHG Reduced CER
14 Conventional Approach Approach of IRRC Source Separated Waste Mixed Waste House-to-House Collection House-to-House Collection Vegetable Markets Waste Bins Demountable Containers Transfer Stations Integrated Resource Recovery Centre (IRRC) Landfill PROBLEMS Water Pollution Spread of Disease Vectors Green House Gas Emission Odor Pollution More Land Required for Landfill Only10-14% going to landfill site Landfill OPORTUNITIES Producing Compost, Energy and Improving Recycling Reducing Green House Gas Reducing Cost of SWM Creating Jobs for the Poor Improving Health and Environment Improving Soil Condition
15 Integrated Resource Recovery Centres (IRRCs) Based on 3R principles Recovers 80 percent of waste as resources Promote separation at source (organic/inorganic) Profit making Decentralized, close to generated waste Capacity can range from 2-20 tons/day (manual) Uses appropriate technologies Employs waste pickers and other urban poor
16 Source of Waste Organic Waste Organic Waste Fish & Meat Waste Recyclables Used Cooking Oil Waste with high Calorific Value Faecal Sludge Sorting Grinding Sorted Recyclables Sorting Drying Composting Maturing Compost Screening Mixing Biogas Digester Biogas Shredded, compacted and baled Processing Unit Shredded Extruded Cocomposting with municipal organic waste Slurry Bagging Compost Electricity Compost Plastic Paper Biofuel Glycerine Refused Derived Fuel (RDF) Compost Glass Metal
17 Organic Waste Landfill Baseline Situation vs. IRRC model Methane (CH4) Emission Baseline situation (organic waste dumped in landfill sites becomes anaerobic and generates methane) Input Technology Produce No Methane Emission Organic Waste Composting (Aerobic Process) Compost (Diverted organic waste from landfill and replacing use of chemical fertilizer ) Climate Change Benefits Generates Carbon Credits by avoiding methane from Landfill and reduce CO2 to produce chemical fertilizer Organic Waste Organic Waste (noncompostables) Human Excreta Organic Waste Biogas Plant (Anaerobic Digestion) Refused Derived Fuel (RDF) Co-composting (Aerobic Process) Biogas to Electricity (replacing fossil fuel based electricity) Fuel in Pellet form (replacing diesel or coal used in boilers or brick kilns) Compost (Diverted organic waste from landfill and replacing use of chemical fertilizer) Avoids methane from landfill and reduces CO2 emission by replacing grid power Avoids methane from landfill and reduces CO2 emission by replacing grid power Generates Carbon Credits by avoiding methane from Landfill and reduce CO2 to produce chemical fertilizer Used Cooking Oil Bio diesel Plant Bio diesel Replace use of (replacing diesel fossil fuel as fossil fuel) IRRC model converts waste into resource and reducing green house gas methane (CH4)

 1 ton")


18 Different Economic Outputs from IRRC 1 ton Organic Waste Composting Produce1/4 ton (0.25 tons of Compost) 1 ton Organic Waste Composting Reduce 1/2 ton Green House Gas 1 ton Organic Waste Biogas Digester Produce M3 Biogas 1 liter Used Cooking Oil Bio diesel Plant 95% of the input as Bio diesel & Glycerine 1 ton Inorganic Waste (high calorific value) Refuse Derived Fuel 95% of the input Refused Derived Fuel (RDF)

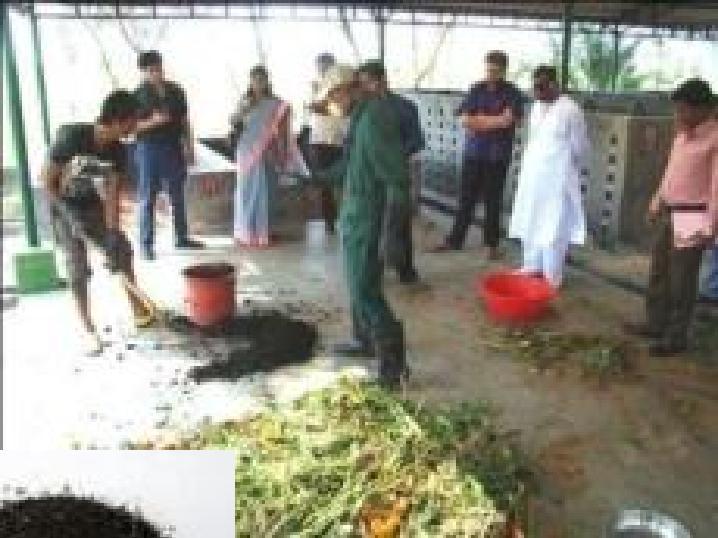
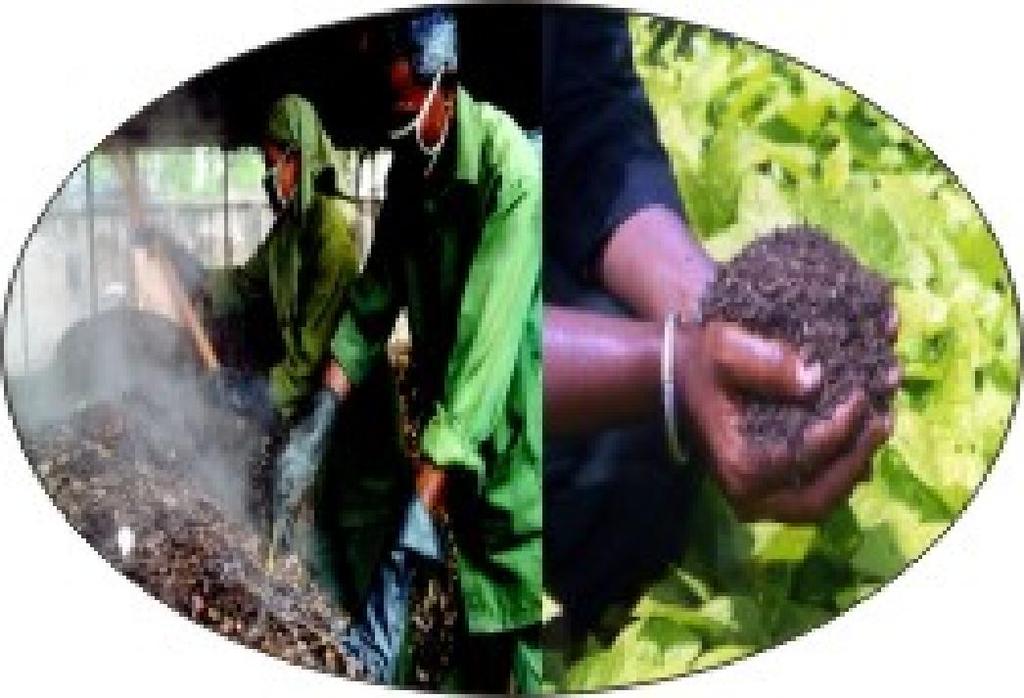
19 Example of Recycling Training Center in Katchpur, Greater Dhaka Using IRRC Approach Technology used: Mainly Composting+ Anaerobic Digestion+ Bio Diesel Unit Collection Sorting Sawdust Bokashi with EM Water Screening residue Piling Water Composting Maturing and Compost Screening Bagging Selling Marketing

20 Layout of IRRC in Dhaka
21 Example of Recycling Training Center in Katchpur, Greater Dhaka Using IRRC Approach Collection Sorting Sawdust Bokashi with EM Water Screening residue Piling Water Composting Maturing and Compost Screening Bagging Selling Marketing


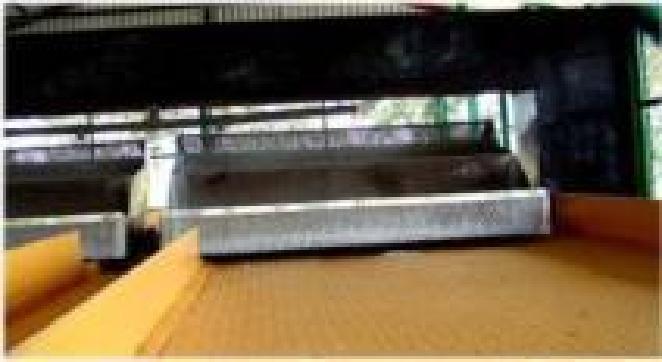
22 Box Method Composting Used in IRRC/RTC in Dhaka At Recycling Training Center, Katchpur, Greater Dhaka


23 Different Steps in Biogas Production from Organic Waste At Recycling Training Center, Katchpur, Greater Dhaka

 1 no 55000 Gas flow meter 1 no.")
 2.")
 100% 2.")


24 Different Out puts from Biogas Digester At Recycling Training Center, Katchpur, Greater Dhaka Item Qty. Rate Fiber Glass digester (4cum) 3 nos Digester installation 3 nos 2500 Generator(1.2 Kw) 1 no Gas flow meter 1 no Crusher/ Grinder 1 no Gas Filter(For generator) Gas Filter Generator Electricity Types of raw materials used: 1. Kitchen waste ( Food waste) 2. Market waste 3. Vegetable waste 4. Slaughterhouse waste 5. Fish market waste 6. Industrial waste raw material for test: 1.Kitchen waste ( Food waste) 100% 2.Vegetable waste 100% 3.Market waste 100% 4.Kitchen waste 50% and Vegetable waste 50% 5.Kitchen waste 50% and Market waste 50% 6.Vegetable waste 50% Market waste 50% 7. Market waste 70%, slaughter house waste15% and fish waste 15% 8.Kitchen waste 70%, slaughter house waste15% and fish waste 15% 9.Kitchen waste 30%, Market waste 20%, Vegetable waste 20%, 10. Slaughter house waste10%, fish waste 10%, Industrial waste 10% Biogas for Cooking Fertilizer

25 Bio- Diesel Plant at IRRC/RTC in Bangladesh Example from Recycling Training Center in Katchpur, Greater Dhaka
 In order to demonstrate a faecal sludge collection and treatment model with emphasis on resource")

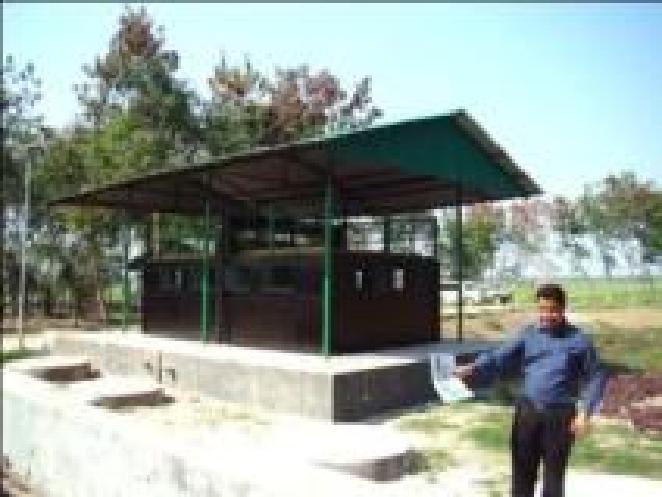
26 IRRC in Kushtia Bangladesh ( Recycling Municipal Solid Waste & Faecal Sludge from Septic Tank and Pit Latrines) In order to demonstrate a faecal sludge collection and treatment model with emphasis on resource recovery and recycling as stipulated in the National Sanitation Strategy of the government, in November 2012, a pilot project was initiated in Kushtia a secondary town in Bangladesh to treat the faecal sludge and solid waste together.

27 Co-Composting of Municipal Waste and Faecal Sludge in IRRC : Example of Kushtia Municipality Total amount of municipal solid waste brought to the plant amounts to 3 to 3.5 tons/ day. Under this project, faecal sludge is directly collected from the septic tanks or pit latrines of households using mechanical vacuum-tugs. Total amount of faecal sludge collected per day is between 2-6 cubic meter/day. The collected sludge is directly sent to the treatment facility.

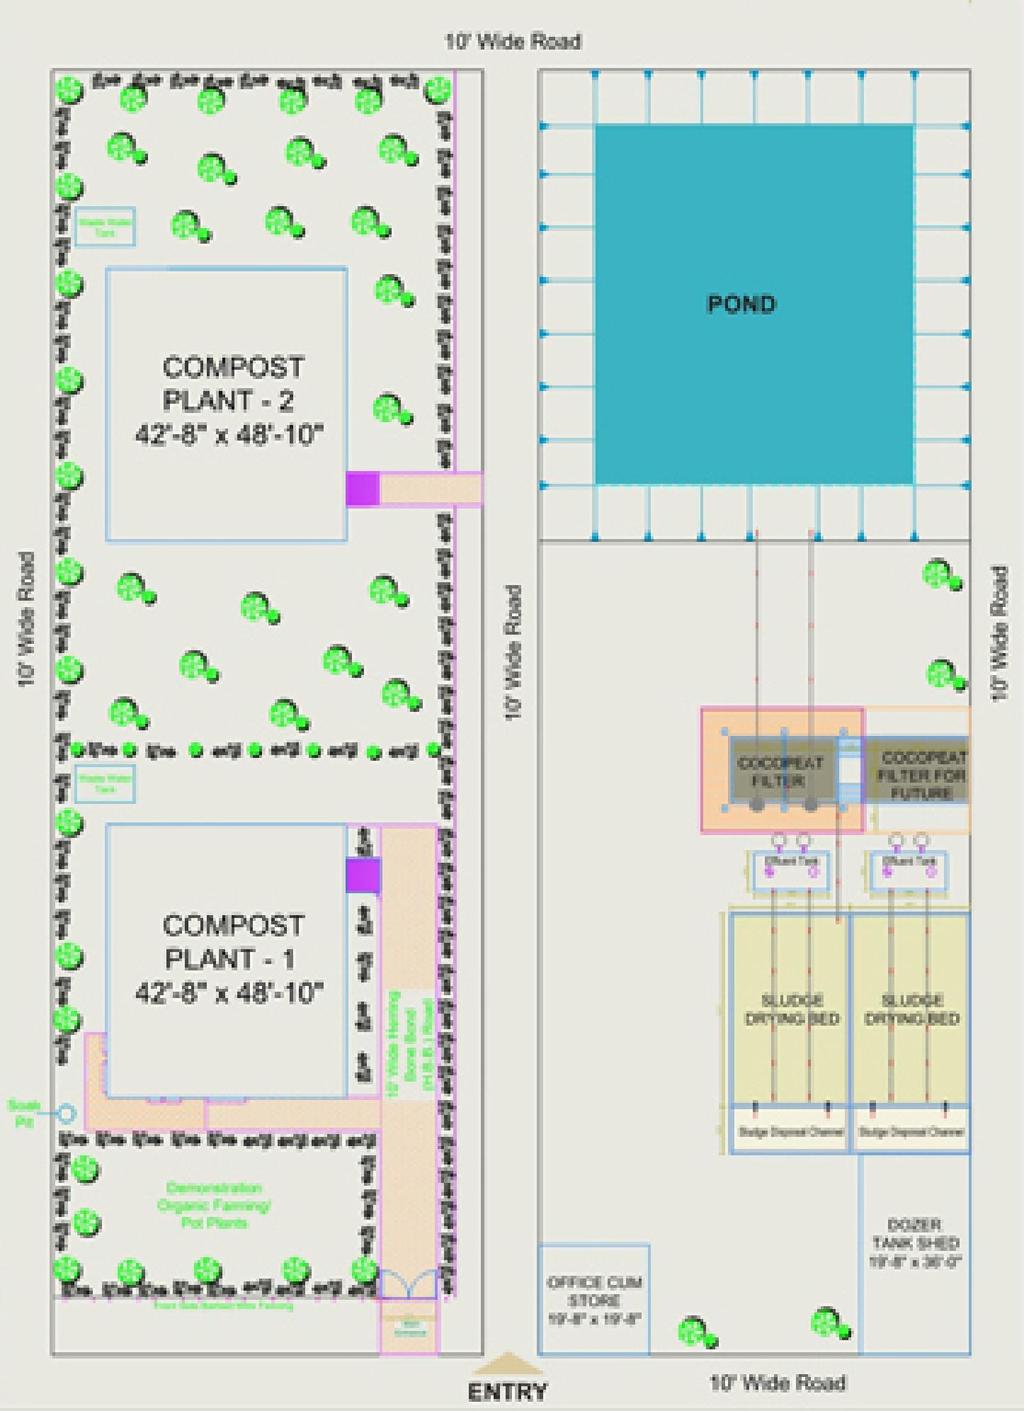
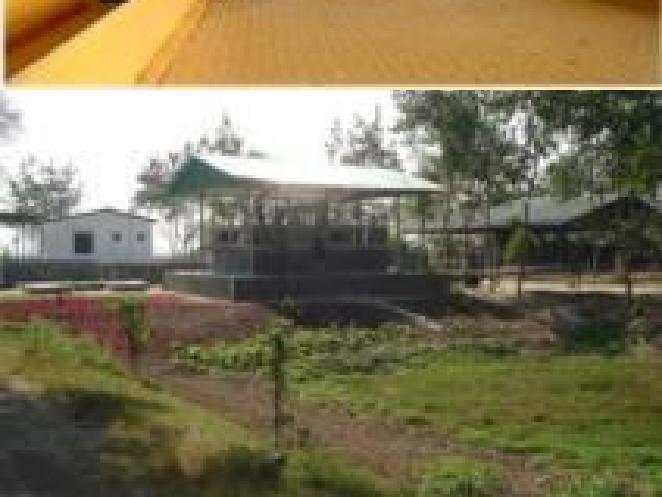


28 Co-Composting of Municipal Waste and Faecal Sludge in IRRC : Example of Kushtia Municipality Site Plan of the Co-composting Facility, Kushtia


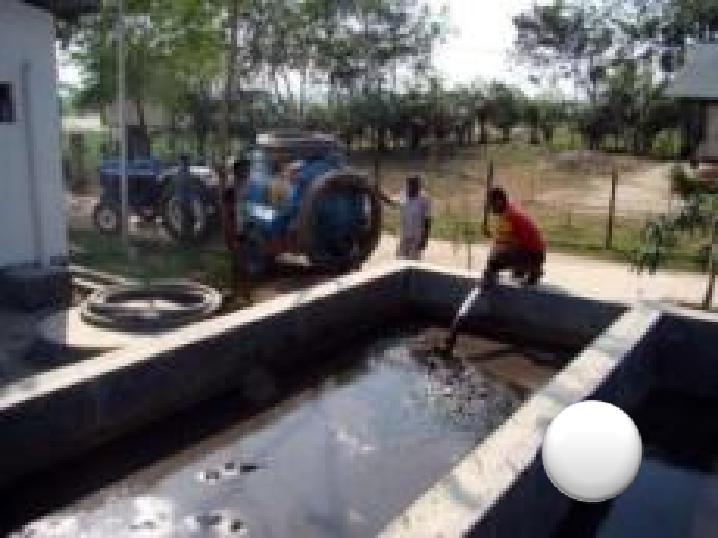
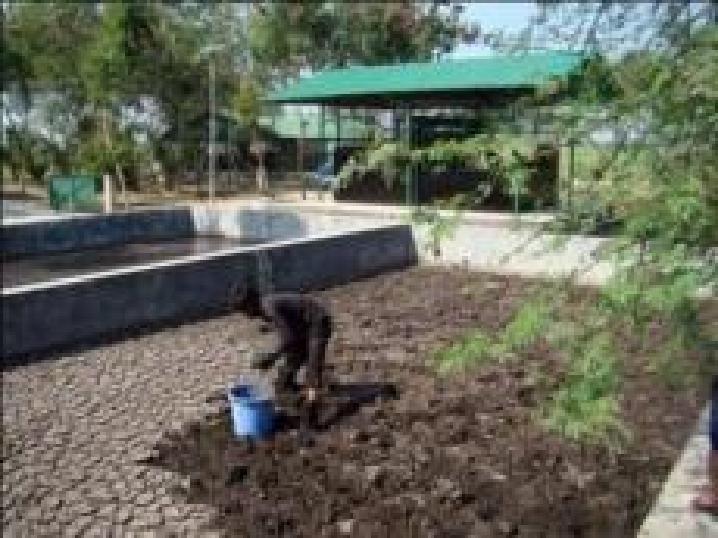
29 Co-composting of Faecal Sludge with Organic Waste, Kushtia City Faecal Sludge Collected by Vaccu-Tug and Discharged in the Drying Bed and later Co-composted with organic waste to Produce Compost
30 Inputs required to build and operate IRRCs To treat one ton of waste in an IRRC: sqm. of land for composting; USD 15,000 20,000 of capital investment(without land) for composting USD 18,000-22,000 of capital investment ( without land) for Anaerobic Digestion 10 % 25 % of capital cost as operational costs Trained workforce For biodiesel plant USD 37,000 of capital investment is required for treating 1000 liter of waste cooking oil
31 Environmental, Economic & Social Benefits from IRRCs By recycling one ton of waste: Create 2 new jobs for the waste pickers; Produce 0.25 tons of good quality compost; Produce cubic meter of biogas ( clean energy which can be used for cooking purpose or electricity generation) Save 1.1 cubic meter of landfill area; Reduce 0.5 tons of green house gas emissions Provide door-to-door service to 2,000-3,000 households
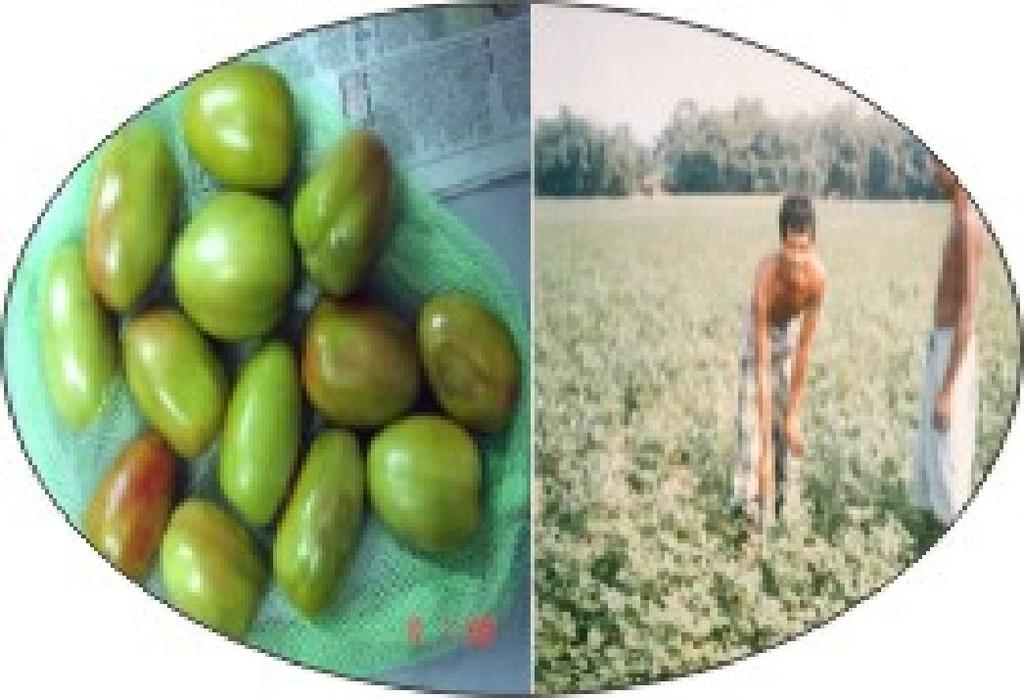
32 Environmental, Economic & Social Benefits from IRRCs By recycling 1 (one) ton of waste: Avoid between cubic meter of toxic waste water; Reduce the risk of 40 diseases linked with unmanaged municipal solid waste; Increase crop production between 25-30% and reduce use of chemical fertilizer by 35-40% increasing food security; Contribute to both climate change mitigation and adaptation. Reduces risk of fire at landfills


33 Potential Co-benefits by Reducing 1 (One) Ton of CO2e Beneficiaries Public Sector Private Sector Citizen NGOs/CBOs/INGOs Informal Sector Financial Sector Partially added co-benefits in US$ from reduction of 1 (one) ton of CO2e Sectors of Benefits Co-benefits Equivalent to US $ Social Benefits Creation of New Jobs 8.50 Reduce the risk of diseases Not yet calculated Citizens benefit from improved waste collection Not yet calculated Economic Benefits Good quality compost Avoided use of chemical fertilizer Environmental Benefits Avoided use of chemical fertilizer 17 Avoidance of landfill cost 10 Value of avoided irrigation Avoided polluted waste water Increased crop yield 64 Total Not yet calculated Not yet calculated Source: Waste Concern 2014 ( Based on the Data Collected from IRRC in Dhaka, Bangladesh) UNFCCC presentation, Bonn 2014


34 City Generating Organic Waste producing compost HOW? URBAN-RURAL SYMBIOSIS Urban Area Through Decentralized IRRCs Public-Private-Community Partnership Using Appropriate Technology Using Climate Financing/NAMA Rural Area Rural Area Producing Food and Agricultural Products
35 Mitigation-Adaptation Loop Mitigation
36 Thank You