Developers Perspectives on New England s Energy Infrastructure Needs and Challenges
|
|
|
- Berniece Lamb
- 5 years ago
- Views:
Transcription

1 Developers Perspectives on New England s Energy Infrastructure Needs and Challenges James Avery, Pierce Atwood LLP (moderator) Ethan Paterno, PA Consulting Group Thorn Dickinson, Avangrid Networks Thomas F. Brostrøm, DONG Energy Wind Power Jaya Velamakanni, Cyprus Creek Renewables F. Allen Wiley, NextEra Energy Resources October 20, 2017 Boston, MA

2

3
4

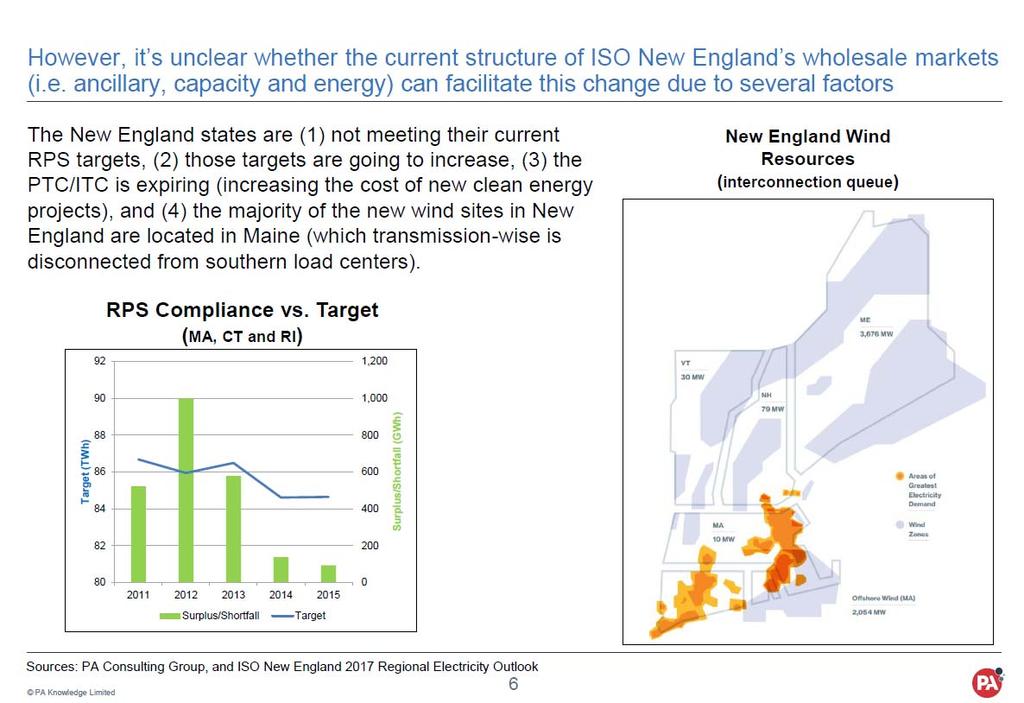
5
6
7

8

9
10


11 NEW ENGLAND ROOTS GLOBAL EXPERTISE


12 3 2
13 Slide 12 3 Lauren Fowler, 10/4/2017

14 THE BEST PATH FROM QUÉBEC TO THE NEW ENGLAND ENERGY MARKET

 Experienced in Maine and regional permitting Strong support")
15 NEW ENGLAND CLEAN ENERGY CONNECT BEST ROUTE End-to-end site control 100 miles existing corridor 45 miles new corridor COST COMPETITIVE Overhead DC construction Leveraging regional grid investments in Maine Global purchasing power WE CAN DELIVER Delivered $1.4 billion project on time and under budget (2015) Experienced in Maine and regional permitting Strong support from Maine Governor, local businesses, and host communities NECleanEnergyConnect.com 4


16 MASSACHUSETTS PROJECT BENEFITS LARGEST SAVINGS New England electricity customers will save more than $3.8 billion over 20 years more than any other project. Massachusetts customers will save $150 million in electricity costs annually. LARGEST CAPACITY NECEC can deliver up to 1,200 megawatts of clean, reliable hydropower into the region s grid. STRONGER ECONOMY Lower energy costs for businesses will increase the state s GDP by an average of $243 million + each year and expand employment by nearly 2,000 full-time jobs. A COMMITMENT TO CLEAN NECEC s ability to deliver a large capacity of clean hydropower allows for an unmatched contribution towards a cleaner footprint. In Massachusetts alone, NECEC will reduce carbon emissions annually by 1.4 million metric tons the equivalent of taking 296,000 cars off the road. NECleanEnergyConnect.com 5
17 RENEWABLE ENERGY CHOICES FOR MASSACHUSETTS


18 MAINE CLEAN POWER CONNECTION CLEAN ENERGY CHOICES Three levels of clean energy: Option 1: Maine wind energy Option 2: Maine wind and solar energy plus storage Option 3: Canadian wind energy plus Maine wind and solar energy plus storage OPTIMAL SITING Maine wind in remote border area in northern Franklin and Somerset Counties Canadian wind in eastern Province of Québec Solar and storage adaptive re-use of a remote, decommissioned military facility New transmission facilities sized to match each option and sited similar to NECEC 7


19 MASSACHUSETTS PROJECT BENEFITS LOW IMPACT LOW COST $1.5 billion in wholesale electric cost savings in New England over 20 years $1.9 billion in MA GDP gains over 20 years STRONGER ECONOMY During permitting and construction MCPC will support 1,446 jobs. Rate payer savings in New England will support 1,278 jobs annually over the first 20 years of the project. A COMMITMENT TO CLEAN MCPC will reduce total CO2 emissions by up to 535,000 metric tons annually. MCPC will reduce CO2 emissions in Massachusetts by up to 425,000 metric tons annually. WE CAN DELIVER Strong local support, expertise building in Maine, global resources. 8


20 Public DONG ENERGY LEADING THE ENERGY TRANSFORMATION 19
21 Public DONG Energy Wind Power Overview DONG Energy Wind Power geographical footprint USA Bay State Wind Europe Asia Pacific Unparalleled experience and track record Boston office Ocean Wind Coastal Virginia Taipei office Formosa 1.1 Formosa 1.2 Greater Changhua projects 25+ years of experience and 1991 track record in the offshore wind 2017 sector In operation Walney Extension West of Duddon Sands Isle of Man Barrow Under construction Burbo Bank Ext. Burbo Bank Under development Decommissioned after 25 years Walney 1 & 2 Horns Rev 1 & 2 Westermost Rough Hornsea 1 Hornsea 2 Hornsea 3 & 4 Race Bank Lincs Gunfleet Sands 1 & 2 Gunfleet Sands 3 Borssele 1&2 London Array Anholt Middelgrunden Vindeby Nysted Gode Wind 2 Gode Wind 3 & 4 Gode Wind 1 Borkum Riffgrund 1 Borkum Riffgrund 2 Nördlicher Grund Avedøre Borkum Riffgrund West 2 OWP West 22 offshore wind farms in operation 3.8 GW Constructe d capacity 7.7 million Europeans with clean electricity 2,000 Dedicated employees 3.5 GW World's leading operator 7 offshore wind farms under construction 5.0 GW under constructio n 15 Partnership s 20
22 Significant transformation of DONG Energy over the past decade Public CO 2 emissions halved g/kwh Operating profit (EBITDA) tripled DKK Bn Business transformed Share of capital employed 1 % International expansion Share of operating profit (EBITDA) % 462 (50%) 3x International share >5x % 16% 24% % 84% % Excluding unallocated capital employed on DONG Energy group level 21
23 Offshore wind is a large scale renewable technology with growth rates exceeding other renewables Public Fastest growing renewable technology in OECD Installed capacity CAGR, % Strong growth in established and new offshore wind markets Installed Capacity, GW 27 % +6 GW Offshore wind Solar PV 1 14% 25% 14 % +8 GW % +6 GW 27.1 Onshore wind Hydro 0% 7% % +1 GW Source: Bloomberg New Energy Finance (BNEF), H offshore wind market outlook 1. Sum of utility-scale PV and small-scale PV 2. BNEF forecast has a more conservative build-out pace for U.S. compared to DONG Energy s pipeline options towards 2025 % New markets Europe # GW addition/year % CAGR 22


24 Public Significant Cost Reductions Driven by Scale, Innovation and Industrialisation Offshore wind cost to society (EUR/MWh) 1 Scale Innovation 3.6MW MW MW 2016 Increased size of windfarms and turbines Driving innovative solutions Industrialisation Digitalisation Walney Race Extension Bank UK 2014 UK 2015 East Anglia UK 2015 Borkum Riffgrund 2 DE 2015 Horns Rev 3 DK 2015 Borssele 1 & 2 NL 2016 Kriegers Flak DK 2016 Borssele 3 & 4 NL 2016 Cluster 1 DE 2017 Hornse a 2 UK Standardisation and procurement for multiple projects Fully capturing new technological opportunities Sources: DECC; Danish Energy Agency; Energinet.dk; NEV 1. Cost to society over the lifetime of the project used as proxy for the levelised costs to society. It consists of a subsidy income on top of market prices for the first years and a pure market income for the remaining years of the 25 years lifetime. Discount rate of 3.5% used to reflect society s discount rate. Market income based on country specific public wholesale market price projections at the time of contracting. For comparability across projects a generic scope adjustment (incl. transmission and extra project development costs) has been applied. 23
25 Public The Global Market Leader Within Offshore Wind Largest offshore wind player globally today Global offshore wind capacity MW 26% 8% 9% 8% 0% 1% 2% 4% 2% 1% 0% 2% 1% Installed 1 Under construction % share of global installed capacity Source: Bloomberg New Energy Finance, September 2017, DONG Energy analysis 1. If a project is executed on behalf of a lead developer managing the construction, then 100% of capacity is allocated to the lead developer. If construction is executed by an integrated joint venture, capacity is allocated in proportion to the JV share 24


26


 windfarm 22 miles from shore Connecting into Virginia Water depths of 80 100 feet Coastal")
27 Public DONG Energy Wind Power in the U.S. Secured project rights for ~3 GW capacity Entered U.S. 50/50 JV for Bay State Wind 1 with Eversource in 2016 Announced Coastal Virginia Offshore Wind partnership with Dominion Energy in July 2017 Bay State Wind Ocean Wind CVOW Bay State Wind 2,000 MW potential capacity 15 miles from Martha s Vineyard Connecting into Massachusetts Water depths of feet Ocean Wind 1,000 MW potential capacity 10 miles from shore Connecting into New Jersey Water depths of feet Coastal VA Offshore Wind 12 MW Stage 1 (demo) windfarm 22 miles from shore Connecting into Virginia Water depths of feet Coastal Virginia Offshore Wind 1. Offtake, grid connections and planning consents have not yet been secured 26
28 Why is the time right for offshore wind? Reason Can be deployed on a large scale, far from land.. Reliable and increasingly so.. Costs are falling, and fast.. Jobs are created.. Beneficial to U.S. Description Can be deployed at a large scale providing: Greater economies of scale More efficient development ($/MW) Faster deployment of capacity Significant distance to shore mitigates visual impact Capacity factors of more than 50% in Denmark and UK Future capacity factors close to baseload 70% cost reduction in Europe in less than 10 years Below 10 c/kwh in auctions in mature EU markets A typical DONG Energy project will create up to: 1,000 jobs during construction 100 jobs during 25 year operation phase Local Supply Chain and Manufacturing 27
29 Offshore wind could channel $20 billion into US economy by 2030 Projected offshore wind build-out and investments in the US 1 MW USD billion 20 11,742 12,000 USD billion Cumulative , Significant job creation 2, , , ,000MW offshore wind supported over 54,000 jobs in Europe in 2015 Economic growth engine - $20 billion direct US investment spread across states from the East Coast to Hawaii The US has done it before - Offshore wind shares all characteristics that saw onshore wind establish a vast industrial base across 43 US states supporting over 50,000 jobs 1. Calculations are based on DEWP experience in the UK, with local content growth and USD investment figures based on realised investments by DEWP/Orsted in the Humber Region. Build-out rate is based on announced policy proposals and proprietary forecast. Annual cost reduction of 2,5% assumed. Source: MAKE; BVG Associates; BWE; TKI-WoZ; SdER; DONG Energy 6, , , ,000 8,000 6,000 4,000 2,000 0 MW Cumulative
30 Offshore Wind Can Create Economic Development Opportunities in for U.S. Ports and Domestic Supply Chain Focus on Ports Case Study from Belfast Harbor, Northern Ireland DONG Energy signed a long-term lease on the $60m state-of-the art Offshore Wind Terminal at Belfast Harbor, the first custom built installation and pre-assembly harbor in the UK and the source of 300 full time jobs Onshore Electrical Operation & Maintenance Export Cables Offshore Substations Installation Vessels Foundations Inter-Array Cables Turbines
31 Offshore Wind s Economic Impact for Sponsor States Case Study from the Humber Region in the United Kingdom Edinburgh Cardiff London DE is constructing 2,000 MW offshore wind in the Humber Region of the United Kingdom DONG Energy experience in the UK provides a good proxy for U.S. opportunity 1,600 jobs/year on average 2015 thru long-term jobs (operations and maintenance) Siemens completed new wind turbine factory in Hull, started operation September 2016 $470m inward investment 1,100 direct new jobs Close working relationship with DONG Energy a significant factor in decision to build the Hull Siemens factory Because of its relative proximity to population centers, offshore wind creates jobs in the states that are benefitting from and paying for the resource 30

32 On November 6 th - DONG Energy becomes Ørsted We want to create a world that runs entirely on green energy We no longer produce oil and gas and have decided to stop all use of coal to focus entirely on green energy Because of our transformation, we will now become Ørsted. We are inspired by the curiosity, dedication and interest in nature of one of Denmark s best known scientists, H.C. Ørsted. 200 years ago he helped lay the foundation for how we produce power today 31

33 Public
34 Cypress Creek Renewables Pierce Atwood Energy Infrastructure Conference October 20, 2017 Jaya Velamakanni Corporate Counsel
35 CYPRESS CREEK RENEWABLES CCR is a leading integrated utility-scale solar platform in the US. We develop, build, finance and operate every project to maximize value & expected 35yr+ asset life Maximizing Value & Quality at Each Step FINAN CE DEVE LOP BUILD OPER ATE $2B+ Experienced Broad Sold in committed capital in 3 years team has financed more >200 solar energy generation assets (over $5B) network of repeat and sophisticated investors 780+ MW; capital reinvested in development pipeline Developed over 1.5 GW in 3 years; Multi-pronged greenfield development platform 5 GW+ development pipeline in 13 states In-house site origination and customer acquisition allows us to enter distinct markets quickly Involved in construction of 1.4GW through prime contractor model Constructed 400 MW+ in 2016 and ~900 MW forecasted for rd Party Services: >250 MW; Delivered 100MWs on time & budget to 2 nd largest US utility ~1 GW operating portfolio with 95% contracted for 15 years+ Creates stable revenue stream and strong balance sheet Incentives aligned with long term profitability of the fund and investors
36 Expansion into New Markets Beginnings in North Carolina: Currently 788 MW in operation Understand regulatory, permitting and legal frameworks Assessing five factors when entering new markets: Fair Compensation Predictability Interconnection Siting Taxation
37 Expansion into New England Massachusetts Rhode Island Vermont New Hampshire Maine
38 Market Focus: Massachusetts Global Warming Solutions Act (August 2008) reduction in greenhouse gases (GHG) by 25% by 2020 and 80% by 2050 Establish regulations requiring reporting of greenhouse gas emissions by largest sources by January 1, 2009 Establish baseline assessment of statewide GHG in 1990 Develop projection of statewide GHG emissions for 2020 under business as usual Establish target emission reductions to be achieved by 2020 Create advisory committees to analyze strategies and make recommendation for adapting to climate change Source: Energy and Environmental Affairs, mass.gov
39 Benefits and Challenges in Massachusetts New England Market Generally Good economics Rapidly expanding Low penetration of renewables Political interest and commitment to reducing carbon footprints 5MW DC and smaller projects in MA Tied to community or utility offtakers Small and quick to deploy SMART is an excellent step to be as efficient and cost-effective as possible Comparison to RI and ME compensation Utility-scale projects in MA Renewable Portfolio Standard in MA not up to 2050 greenhouse emissions production goal no interim milestones Are merchant prices and merchant Class I RECs in ISO-NE competitive? TriState RFP and 83D
40 Case Study Project: MA <5MW Site Five factors when entering new markets: Fair Compensation Predictability Interconnection Siting Taxation


41
42 Questions and Final Remarks


43 BUILDING THE NEXT ERA OF CLEAN ENERGY Pierce Atwood Energy Infrastructure Symposium F. Allen Wiley, Vice President - Development October 20, 2017
 $90 billion in total assets (3) 14,700 employees One of the largest electric utilities in the U.S.")
44 NextEra Energy is comprised of two strong businesses supported by a common platform $70 billion market capitalization (1) 45,900 megawatts in operation in 30 U.S. states and 4 Canadian provinces (2,3) $90 billion in total assets (3) 14,700 employees One of the largest electric utilities in the U.S. by retail megawatt-hour sales The world leader in electricity generated from the wind and sun Engineering & Construction Supply Chain Nuclear Generation Non-Nuclear Generation 43 (1) As of October 16, 2017; Source: FactSet (2) Includes megawatts sold to NextEra Energy Partners (3) As of December 31, 2016

45 NextEra Energy is a leading clean energy company with ~45,900 megawatts of generating capacity in operation NextEra Energy Inc. Generating Units 44
 $20.")

46 NextEra Energy was the third-largest U.S. capital investor across all industries in Top 10 U.S. Capital Investors (1) $20.2 $17.1 $ B $9.6 $9.1 $8.6 $8.5 $8.4 $8.3 $8.1 $7.9 NEE Outside of the telecommunications industry, NextEra Energy was the largest capital investor in the U.S. in ) NEE internal estimates based on publicly available information
 Global Wind Installations (Dec. 2016) (3) 44.2 33.5 30.2 GWh 24.5 19.8 19.7 19. 4 17.")
 NextEra Energy actuals; Includes 100% of NEP assets operated by Energy Resources 3) Source:")
47 In 2016, NextEra Energy maintained its status as the largest producer of wind and solar energy in the world World s Top Generators of Wind and Solar Energy in 2016 (1) Global Wind Installations (Dec. 2016) (3) GWh GW NEE (2) Energy Resources has more wind capacity in its portfolio than all but six countries in the world 46 1) Based on third-party research data and corporate disclosures 2) NextEra Energy actuals; Includes 100% of NEP assets operated by Energy Resources 3) Source: Global Wind Energy Council


48 Our ability to deliver results is a product of our people and culture of continuous improvement Culture of Delivering Results Recognized as the most admired company in our industry and one of the best companies in any industry Fortune World's Most Admired Companies Ethisphere Institute World's Most Ethical Companies Forbes Best Employers Key elements of our culture: Financial discipline and risk management Operational excellence/continuous improvement Commercial and development skills NextEra has a diverse and talented team of employees with an unyielding focus on meeting our commitments Proud of our track record; never satisfied; focused on the future with a drive to be better every day 47


49 Florida Power & Light is one of the best utility franchises in the U.S. with electric rates ~25% below the national average One of the largest U.S. electric utilities Vertically integrated, retail rate-regulated ~4.9 million customer accounts; ~10 million people ~26,000 MW in operation $10.9 billion in operating revenues $45.5 billion in total assets Florida Power & Light (FPL) 48 Note: Data is as of year ended December 31, 2016
 $4.")
 Includes 4 BCF Texas Pipelines operated by Energy Resources for")
50 NextEra Energy Resources focus is to be the leading North American clean energy company NextEra Energy Resources World leader in electricity generated from the wind and sun ~20 GW (1) of generation in operation ~14 GW wind ~2 GW solar ~3 GW nuclear ~1 GW natural gas/oil ~8 BCF of natural gas pipeline capacity operating or under development (2) $4.9 B (3) in operating revenues $42.7 B in total assets Natural Gas 2% Oil 4% Wind 70% Nuclear Solar 14% 10% 49 1) As of December 31, Generation mix is based on MW capacity operated by Energy Resources including 2,788 MW of NextEra Energy Partners assets 2) Includes 4 BCF Texas Pipelines operated by Energy Resources for NextEra Energy Partners 3) For the year ended December 31, 2016 Note: All other data as of March 31, 2017
51 NextEra Energy Resources Affiliates have approximately 2,000 megawatts of generation currently in operation in New England NextEra Projects in Operation in New England Project State Fuel Gross MW Net MW (1) Small Scale Solar MA Solar 3 3 NEA Bellingham MA Nat. Gas Casco Bay Energy Storage ME Battery Cape 4-5 ME Oil WF Wyman 1-3 ME Oil WF Wyman 4 ME Oil Seabrook NH Nuclear 1,247 1,100 Total 2,434 2,039 (1) Net MW reflects NextEra s ownership share 50
52 NextEra Energy Resources Affiliates have ~360 megawatts of solar projects under contract at fourteen sites in New England NextEra Solar Projects Under Contract in New England Project State Fuel MW Competitive RFP Constitution CT Solar 20 CT DEEP Nutmeg CT Solar 20 Tri-State Quinebaug CT Solar 49 Tri-State Farmington ME Solar 49 Tri-State Hinckley ME Solar 20 CT DEEP Sanford ME Solar 49 Tri-State Winslow ME Solar 20 CT DEEP West Portsmouth NH Solar 10 CT DEEP Chinook NH Solar 30 Tri-State Coolidge VT Solar 20 CT DEEP Davenport VT Solar 15 CT DEEP Highgate VT Solar 20 CT DEEP Randolph Center VT Solar 20 CT DEEP Sheldon VT Solar 20 CT DEEP 51
53 NextEra Energy Resources Affiliates submitted ~1,000 MW of renewable bids into the MA Clean Energy RFP MA Clean Energy RFP NextEra Projects Maine Wind, Solar and Battery Storage combined with Central Maine Power MCPC Transmission (660 MW) Wind (460 MW) plus Battery Storage (50 MW) Solar (150 MW) plus Battery Storage (40 MWdc) CMP Transmission Maine Clean Power Connection ( MCPC ) Stand-alone Solar Projects (320 MW) Five sites located in Maine and New Hampshire Sites ranging in size from 20 MW to 150 MW 52