Lecture 7: Global warming, carbon taxation & externalities (check on line for updated versions)
|
|
|
- Irma Haynes
- 5 years ago
- Views:
Transcription
1 Public Economics: Tax & Transfer Policies (Master PPD & APE, Paris School of Economics) Thomas Piketty Academic year Lecture 7: Global warming, carbon taxation & externalities (check on line for updated versions)
2 Roadmap of lecture 7 Basic theoretical model: optimal tax formulas with externalities Controversies about carbon taxes The discount rate controversy Global warming and carbon emissions in historical and comparative perspective Where are top individual emitters? The case for progressive carbon taxation
3 Basic theoretical model of optimal tax formulas with externalities: U(c,e,E) Continuum of agents i in [0;1] Two goods: non-energy good c and energy good e Identical utility function: U i = U(c i,e i,e) = (1-α)log(c i ) + αlog(e i ) λlog(e) With: c i = individual non-energy consumption (food, clothes, i-phones, etc.) e i = individual energy consumption (oil, gaz, etc.) E = e i di = aggregate world energy consumption = negative externality (e.g. due to carbon emissions, global warming) utility increases with e i but decreases with E: everybody wants energy for himself but would like others not to pollute too much
4 Simple linear production function (full substitutability): everybody supplies one unit of labor l i =1, and labor can be used to produce linearly c or e with productivity = 1 (price = wage = 1) Aggregate budget constraint: C + E = Y = L = 1 This is like assuming a fixed relative price of energy I.e. assume each worker can produce exactly 1 liters of oil or 1 kilo of carrots; then the relative prices and wages for the consumption and production of oils and carrots will always be equal to 1; the GDP of the country will always be 100 (assuming a population of 100); the only interesting question is how we split these 100 into liters of oil and kilos of carrots (i.e. what fraction of labor force works in energy vs non-energy sectors)
5 Alternatively, one could assume concave production functions: Y c = F(L c ),Y e = G(L e ), Y = Y c + p Y e, with p = relative price of energy = increasing with energy demand; one could also introduction K, etc. Note: c,e,y,.. = individual quantities; C,E,Y,.. = aggregate quantities; With a continuum of representative agents [0,1], then c=c, e=e, y=y, With a large finite population N (say N=100 millions), then C = N x c, E = N x e, Y = N x y,..
6 Laissez-faire equilibrium: Max U(c i,e i,e) under c i +e i <y i =l i =1 c i = (1-α)y i & e i = αy i C= 1-α & E = α (first-order condition: Max (1-α)log(1-e i )+αlog(e i ) (1-α)/(1-e i )=α/e i ) e i =α) Say, α = 20% & 1-α=80% : in the absence of corrective taxation, we spend 20% of our ressources on energy (20% of the workforce works in the energy sector, etc.) Private agents do not internalize externalities: they choose energy consumption independently of λ (even if λ very large!)
7 Social optimum: Max U(C,E,E) under C+E<Y=1 I.e. same maximization programme as before, except that the social planner internalizes the fact that E = e i di: so the first-order condition becomes Max (1-α)log(1-E)+(α-λ)log(E) (1-α)/(1-E)=(α-λ)/E C = (1-α)/(1-λ) & E = (α-λ)/(1-λ) Say, α = 20% & 1-α=80% & λ=10%: given the global warming externality, we should only be spending about 11% (10/0.9=11.11) of our ressources on energy rather than 20% (and 89% on non-energy rather than 80%) I.e. the size of the energy sector should be approximately divided by about 2
8 How to implement the social optimum? The corrective tax te on energy consumption should finance a lump-sum transfer eaxctly equal to te: Max U(c,e,E) under c+pe<y (with : p =1+t & y =1+tE) c = (1-α)y & e = αy/p I.e. prices and wages in both sectors are still equal to 1 (linear technology), but in addition the energy sector has to pay a tax t, in order to raise the relative price of energy and induce private agents to choose the socially optimal quantity of energy Optimal corrective tax is such that the fraction of labor ressources spent on energy is the same as in the social optimum: e = αy/p = (α-λ)/(1-λ)
9 e= αy/p = (α-λ)/(1-λ) I.e. E=α(1+tE)/(1+t)=α(1-λ)/(α-λ) I.e. E = α/[1+(1-α)t] = α(1-λ)/(α-λ) t = λ/(α-λ) If λ = 0, then t=0 (no externality no taxation) If λ α (i.e. negative externality almost as large as the benefits of energy), then p (infinite tax) If λ>α, then energy should be banned Transfer must be lump-sum, not proportional to e i
10 Assume α = 20% & 1-α=80% & λ=10% Then t = λ/(α-λ) = 100% I.e. we need a tax rate t=100% to correct the global warming externality In effect, consumers pay their energy 100% higher than production costs; they keep spending 20% of their budget on energy, but half of these spendings are paid to the government in energy taxes Market equilibrium: GDP = 100 = 80 kilos carrots + 20 liters of oil Social optimum: GDP = 100 = 89,89 carrots + 11,11 oil Decentralized market optimum: 100% tax on oil, tax revenues are redistributed in lump sum manner nominal GDP = 111,11 ; consumers still spend 20% of their income on oil, i.e. 22,22 (and 89,89 on carrots), but half of it is paid in tax, so the size of oild sector is only 11,11
11 Controversies about carbon taxes If we all agree about λ (utility cost of global warming), then we should also agree about the optimal carbon tax rate: 1+t = α(1-λ)/(α-λ) Conversely, differences in perceptions about λ (=highly uncertain) can explain different levels of energy & environmental taxes in the EU (see Eurostat tables) Also there are other negative external effects to take into account: air quality, trafic congestion, etc. In the French 2008 carbon tax debate, the implicit assumption was that existing oil taxes correct for other externalities, and that the new carbon tax must deal with global warming: price of the carbon ton = estimate of the negative welfare impact of an additional ton of carbon emission: see Quinet Report 2008
12 The discount rate controversy Stern Report on the economic costs of global warming [Stern 2006 Report] An important part of the controversy was due to differences in the social discount rate I.e. assume that we agree that global warming will cause catastrophies that are equivalent to a loss equal to λ% of world GDP in T years Say λ=10%, and T=70 years (sea will rise around 2080) Q.: How much welfare should we ready to sacrifice today in order to avoid this? Should we stop using cars entirely? A.: We should be able to sacrifice μy 0 = e -r*t λy T, with r* = social discount rate = rate at which an ideal social planner should discount the future Q.: How should we choose r*? r* 0 or r*>>0?
13 A.: The choice of r* depends on how one views future growth prospects: are future generations going to be so rich and so productive that they will be able to clean up our pollution? «Modified Golden rule»: r* = δ + γg with δ = pure social rate of time preference g = economy s growth rate: Y t = e gt Y 0 γ = concavity of social welfare function r* is the social discount rate that should be used by a planner maximizing V = t>0 e -δt U(c t ) with U(c)=c 1-γ / (1-γ) (i.e. U (c)=c -γ ) γ 0 measures the speed at which the marginal social utility of consumption goes to zero = how useful is it to have another i- phone if you already have 100 i-phones? (γ=0: linear utility U(c)=c; γ=1: log utility U(c)=log(c); γ>1: utility function more concave than log function)
14 Stern vs Nordhaus controversy: both agree with the MGR formula but disagree about parameter γ Stern 2006 : δ=0,1%, g=1,3%, γ=1, so r*=1,4% (see Stern 2006 report, chapter 2A) Nordhaus 2007: δ=0,1%, g=1,3%, γ=3, so r*=4,0% (see Nordhaus, "Critical Assumptions in the Stern Review on Climate Change", Science 2007; see also JEL 2007 symposium)
15 Whether one adopts r*=1,4% or r*=4,0% (for a given growth rate g=1,3%) makes a huge difference: We should spend: μy 0 = e -r*t λy T, i.e. μ = e -(r*-g)t λ (since Y T = e gt Y 0 ) According to Stern r*-g=0,1%, so with T=70, e (r*-g)t =1,07 : it is worth spending about 9% of GDP in 2010 in order to avoid a 10% GDP loss in 2080: we need to reduce emissions right now & to finance large green investments But e (r*-g)t =6,61 according to Nordhaus (r*-g=2,7%): it is worth spending only 1,5% of GDP in 2010 in order to avoid a 10% GDP loss in 2080: don t worry too much, growth will clean up the mess EU vs US position
16 Intuition behind MGR: r* = δ + γg If g=0, then r*=δ : social rate of time preference From an ethical viewpoint, everybody agrees that δ should be close to 0%: it is difficult to justify why we should put a lower welfare weight on future generations Both Stern & Nordhaus pick δ=0,1% (Stern mentions estimates of meteorit crash: the probability that earth disappears is <0,1%/yr) with zero growth, everybody agrees that μ λ (of course, private rate of time preference i.e. how private individuals behave in their own life are a different matter: they can be a lot larger)
17 With g>0, one has to compute the impact on social welfare of reducing consumption by dc T <0 at time t=t and raising it by dc 0 >0 at time t=0: Social welfare: V = t>0 e -δt U(c t ) with U(c)=c 1-γ / (1-γ) (i.e. U (c)=c -γ ) dv = U (c 0 ) dc 0 + e -δt U (c T ) dc T c T = e gt c 0 dv =0 iff dc 0 = e -(δ+γg)t dc T MGR: r* = δ + γg Intuition: γ very large means that extra consumption not so useful for future generations, because they will be very rich anyway very large r*, even if g is quite small and uncertain
18 What is strange in this controversy is that both Stern and Norhaus take opposite sides on concavity parameter γ as compared to the parameters that they usually favor for cross-sectional redistribution purposes: Stern would usually favor high γ (high redistribution) and Nordhaus low γ (low redistribution) If future growth was certain (i.e. future generations will be more productive, whatever they do), then it might indeed make sense to have high γ or even infinite γ = Rawlsian objective: we should only care about maximizing the lowest welfare or consumption level, i.e. the level of the current generation
19 Two pb with this intergenerational Rawlsian reasonning: (1) growth is endogenous: if we leave infinite pollution (or debt) to future generations, maybe g will not be so large (2) one-good models are not well suited to study these issues: in the long run the relative price of the environment might be infinite (i.e. if we all have 100 i-phones, but unbreathable air, maybe the relative value of having a little bit clean air will be quite large) See J. Sterner, "An Even Sterner Review: Introducing Relative Prices into the Discounting Debate", JEP 2008 See also R. Guesnerie, "Calcul économique et développement durable", RE 2004 ; "Pour une politique climatique globale", Cepremap 2010 See also Drupp et al, «Discounting disentangled», 2015
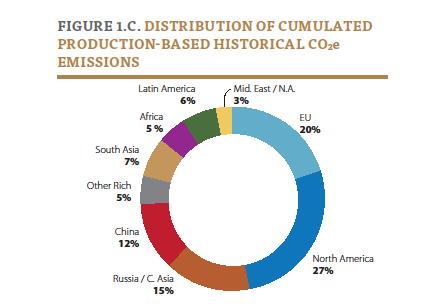
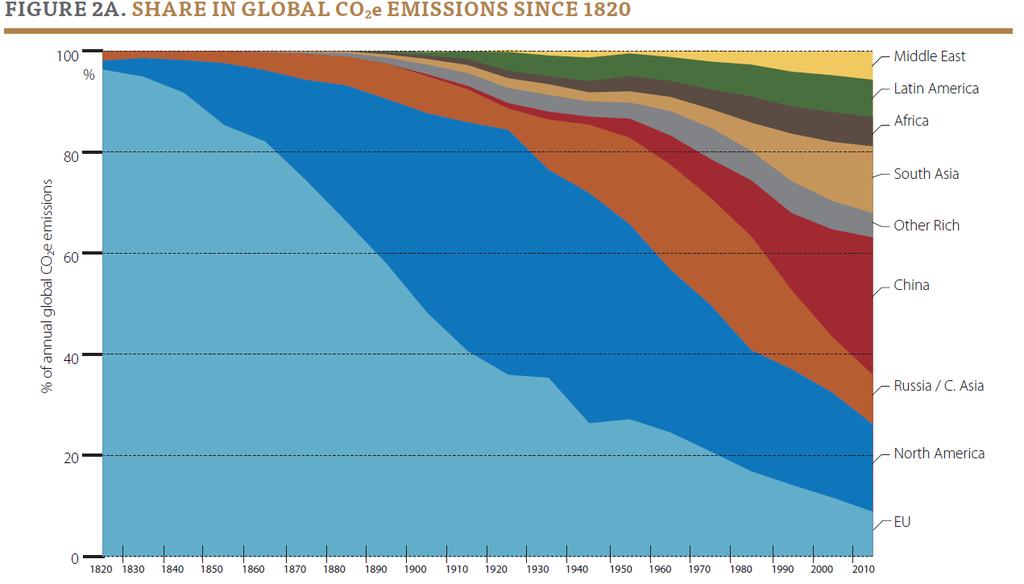
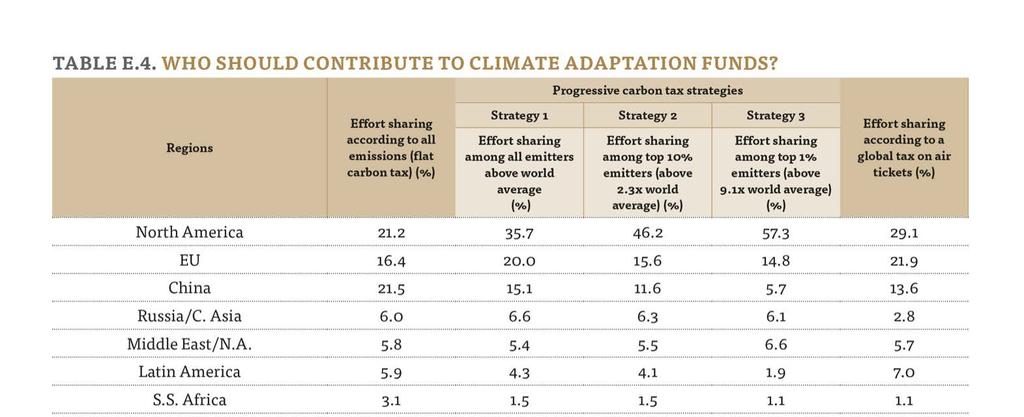
20 Global warming & carbon emissions in historical and comparative perspective Other key reason why climate justice is difficult to define: major conflicts about country responsabilities One way to make progress about climate justice: look at inequality of carbon emissions between world individuals rather than between countries One remaining difficulty: historical emissions See Chancel-Piketty, Carbon and Inequality: from Kyoto to Paris. Trends in the Global Inequality of Carbon Emissions ( ) and Prospects for an Equitable Adaptation Fund, PSE 2015
21

22


23 Distribution of current consumptionbased emissions Russia/C.Asia OtherRich 6% 5% S.S.Africa 3% China 22% Other Asia 8% North America 21% EU 16% Mid.East/N.A 6% Latin America 6% India 7%

24
25

26
27
28

29
30 Where are top individual emitters?

31

32
33