Berkeley UNIVERSITY OF CALIFORNIA/
|
|
|
- Ezra Scott
- 5 years ago
- Views:
Transcription

1 End-of-Life Phase of Consumer Electronics - Methods and Tools to Improve Product Design and Material Recovery Jennifer Mangold, PhD inemi Research Seminar June 11,


2 Overview of LMAS The focus of research in the LMAS is on the analysis and improvement of manufacturing processes, systems and enterprises and the development of tools to analyze their sustainability. Dr. David Dornfeld Lab Director Contact Us


3 Green Manufacturing Impact of manufacturing strategy on product life cycle, including: Environmental (e.g., resource consumption) Economic (e.g., payback periods, productivity, quality) Social (e.g., fair labor standards, employee health and safety) Source: Microsoft


4 Scope of Analysis Enterprise Factory/Facility Machining Cell or Line Machine Tool Machining Process of-vws-transparent-factory.html Tool-chip interface

5 uring Research focus - Sustainable products and systems - Impact and life cycle assessment tools for manufacturing - Manufacturing technology for reduced impact and green machine tools - Manufacturing technology for producing advanced energy sources or storage, Cleantech - Design for sustainability, Material selection, Design for the Environment, the Circular Economy - Metrics and analytical tools for assessing the impact of processes, systems and enterprises - Modeling sustainable manufacturing processes, systems, and supply chains Current projects - Smart manufacturing, data analytics, and machine learning - Appropriate technologies for improving manufacturing productivity in developing economies - Develop total cost of ownership for design and manufacturing optimization of fuel cell stationary and artificial photosynthesis applications - Tools and methods to inform design of electronics for endof-life recovery - Sustainable material selection for consumer electronics - Trade-off analysis of manufacturing process chains - Social impacts and sustainability through the supply chain - Sustainable packaging
 Key Performance Indicator (KPI) Sustainability for 100+ product categories across 9 industry sectors. Website: http://www.")
6 The Sustainability Consortium TSC informs decision makers on product sustainability throughout the entire product life cycle across all sectors. Category Sustainability Profile (CSP) Key Performance Indicator (KPI) Sustainability for 100+ product categories across 9 industry sectors. Website:


7 The Electronics Sector Working Group The Electronics Sector Working Group leads the investigation of sustainability issues and improvement opportunities for a variety of electronic consumer product categories. The life cycle evaluation of electronics and materials relevant to electronics production involves engagement from material producers, manufacturers, retailers, waste managers, and other experts and stakeholders spanning the entire supply chain. Product Categories Dr. Carole Mars - Research Manager Website: carole.mars@asu.edu

8 The EOL Innovation Working Group Underway Project Complete in 2014 Executive Summaries June 2014
9 Better processing of e-waste would not only reduce the amount of potentially toxic waste sent to landfill or illegally exported overseas, but lead to greater recovery of valuable raw materials European Parliament Before we can improve e-waste processing we need to have a better understanding of the e-waste system


10 E-waste is a generic term encompassing various forms of electric and electronic equipment that have ceased to be of any value to their owners (Widmer 2005) Consumer Electronic Product Sales in the U.S (EPA May 2007)


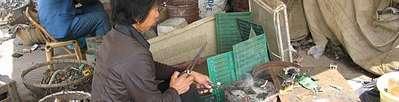

11 Informal Recycling Resource Efficiency Legislation Image Sources: StEP-EMPA, ERI, ETBC
 (Hageluken 2012) (UNEP")
12 Resource use and metals mining Materials composition of electronics Material intensive products Number of elements in chips (11 to 60) Metals Mining 80% of technology metal mining occurred over last 30 years Ore degradation Product Elements used Automobiles Electronics Gas turbine blades Medical equipment (Graedel & Harper 2013) (Hageluken 2012) (UNEP 2011)

13 Material Composition In particular, recycling materials from mixed-material products discarded in mixed waste streams, is most difficult but with the increased complexity of many high-value products, this stream is potentially the largest and most valuable - Allwood 2011 (Brown-West 2010 )
14 End-of-Life Project Objectives Pathways Project Develop a representative set of pathways that consumer electronics follow in the end-of-life phase Focus on formal collection and processing of e-waste in the U.S. Recyclability Calculator Develop model to assess product recyclability Value, Mass, and Design based criteria Inherent flexibility to be used on a variety of product categories Align with current industry efforts and standards Alignment and input from key stakeholders in the industry as well as current industry standards and efforts was an integral part of this work.
15 END OF LIFE PATHWAYS PROJECT

16 Product Life Cycle Raw Material Extraction Material Processing Manufacturing Use End-of-Life Informal Reuse Reuse Resell Use Formal Collection Refurbish Secondary Processing Recycling Incineration Curbside Collection Landfill 15
17 Scope of Material Flow Analysis Products Collection Facility Pathway Televisions LCD,Plasma,CRT Computers Laptops Desktops Tablet PCs Monitors LCD, CRT Mobile Phones DVD/VCR Consumer Retail Return Collection Program Direct OEM takeback Business OEM Enterprise Government Schools/Univ. Type of Facility -Recycle -Refurbish -Reuse 14 Facilities Region United States Temporal 2012 Recycle Reuse Whole System Component Refurbish Whole System Component % Mass Laptops Retail Returns Facility X Whole System Refurbish 16
18 Data Collection & Survey Development Primary Data Collection Surveys and Interviews Surveys sent to 35 facilities with a 40% response rate Distribute to variety of material processing facilities Follow up and support to ensure data quality Section 1 Facility information: Facility size, location, amount of e-waste processed, operating model, and certifications Section 2 Material Flows: What products are being collected and processed, and the pathways they follow through the facility Section 3 - Process flow: Details of processes and process flows at each facility Section 4 Resource use: Energy and resource use facility level data


19 Participating Material Recovery Facilities 14 Participating Facilities Concentration in Midwest, New England, and the West Total e-waste processed (Mangold 2013) 18
 Business - OEM - Enterprise - Government -")
20 Collection Methods Business Sector 64% B to B Contracts Consumer Sector 36% OEM Takeback Programs Collection Program Barriers to collection Opportunity to increase collection from consumer sector Consumer - Retail Return - Collection Program - Direct - OEM takeback (Mangold 2013) Business - OEM - Enterprise - Government - Schools/Univ.
21 Example Material Flow Results Over 95% of products directed to Recycling Reuse & Refurbishment Primarily Computers & Mobile Phones What about Design for Reuse? (Mangold 2013)
22 RECYCLABILITY CALCULATOR
23 Product Recyclability Model Develop standard methodology and tool that can be used to determine product recyclability in consumer electronics industry Project Goals Align with current industry standards Move beyond mass based criteria Easy to use Scope Consumer electronic products
24 Model Approach A mass based approach is misleading Materials present in low amounts High economic value and environmental impacts Mass-Based + Value-Based + Design-Based Recyclability of Materials & Components Economic Value Design for Recycling Criteria Mass Based What materials are recycled and how efficiently? Value Based What value is recovered from the product? Design Based How easy is it to separate materials to be recovered?

25 Materials and Components Recycling Efficiency Single Materials Component Compositions Components included Printed Circuit Boards Motherboard, Display, etc. Desktop & Integrated Display Optical Drive Hard Drive Power Supply Unit Battery

26 Model Architecture User inputs basic product data Model Outputs Recycling Efficiency of Materials Al Au Ag. Component Composition Models Hard Disc Drive Scrap Value of Materials Al Au Ag.
 Recyclable Value (USD)")
27 Recyclability Model User Interface User Inputs Material Type Material Mass Components Component Mass PCB by application Battery Type Model Outputs Recyclable Product Mass Product Recyclability (%) Recyclable Value (USD) (Mangold 2013)

28 Example Case Study Case Study 15 LCD Laptop Computer Components Hard Disc Drive (Al) DVD Drive Lithium-ion Battery PC/ABS Housing Model Results 36.8% Recyclable by Mass Recyclable Value - $ Next Steps - Test more products -Economic evaluation with MFA results
29 Considerations for Product Design Criteria Separation Potential Component and part connections Types of Connections Quantity of Connections Contamination Coatings, paints, material mixing Number of different materials used Material mixing (e.g., metal inserts in plastic components) Material Compatibility Metals and plastics


30 Design Criteria Material Compatibility Metals (Reuter & Van Schaik 2012) (Adapted from Castro 2005)

31 Design Criteria Material Compatibility Plastics ECMA

32 Directions for future work Key Performance Indicators Development of improved performance measures Implementation within the industry Information Exchange Communication between designers, manufacturers, and EoL practitioners Continuous feedback and systematic assessments Consumer Engagement Beyond education
33 Thanks! Additional Contact Information Jennifer Mangold - jam@me.berkeley.edu LMAS The Sustainability Consortium Carole Mars carole.mars@asu.edu