Guidelines for Reducing Water Losses in South African Municipalities
|
|
|
- Julianna Ross
- 5 years ago
- Views:
Transcription


1 for Reducing Water Losses in South African Municipalities Guidelines for Reducing Water Losses in South African Municipalities Guidelines TT 595/14 TT 595/14
2 GUIDELINES FOR REDUCING WATER LOSSES IN SOUTH AFRICAN MUNICIPALITIES Report to the Water Research Commission by RS MCKENZIE TT 595/14 APRIL 2014 i
3 Obtainable from: Water Research Commission Private Bag X03 Gezina, 0031 or download from DISCLAIMER This report has been reviewed by the Water Research Commission (WRC) and approved for publication. Approval does not signify that the contents necessarily reflect the views and policies of the WRC, nor does mention of trade names or commercial products constitute endorsement or recommendation for use. ISBN: Printed in the Republic of South Africa ii

4 FOREWORD It gives me great pleasure to introduce this report or guide, since it encapsulates more than 20 years of knowledge and experience gained in the application and implementation of water loss control and management by a team and individuals, Dr Ronnie Mckenzie and WRP Pty Ltd, whom I regard and are regarded as world leaders on the subject. The appreciating aspect is that I have been part of this journey from its humble beginning, nurturing and pushing the boundaries of innovation and research. Thus, it is satisfying to say that this report is unique and different in many ways since it is not purely technical and engineering orientated, but presents the subject from an experiential basis. It has very few formulas and calculations, and was designed and written to capture those lessons and experiences which very rarely get recorded and captured. The report consolidates many innovative research tools, products and studies which have been generated over the years at the WRC and elsewhere in response to the challenges associated with water loss management, as well as the a number of projects and implementation of water loss management in South Africa. Over this period there have been a number of world firsts which have been achieved in this subject field, to name a few: The South African water sector was amongst the first countries in the world to adopt the BABE processes and the IWA standard water balance. South Africa was the first to introduce advanced pressure control on a large-scale installation supplying almost residents from a single installation. I am hoping that this report will stimulate and empower both the young and new, experience and knowledgeable. It has been an absolute privilege to have been part of the development of this report and also wish to acknowledge the guidance and inputs of Speedy Moodliar and Simon Scruton from ethekweni Metro, Micheal Singh and Paul Herbst from DWA, Darryl Cassel and Trevor Westman from Tshwane Metro, Keith Baily of Kent Meters, Dave Still, Johan Vorster of Ekurhuleni Metro. My thanks to Dr Ronnie Mckenzie for all the inspiration, innovation and sound knowledge over the years and the sweat put into writing this document. JN Bhagwan (Jay) Executive Manager - Water Use and Waste Management Water Research Commission iii
5 TABLE OF CONTENTS 1 INTRODUCTION Purpose of this book Water loss reduction interventions GETTING THE BASICS IN PLACE Addressing the obvious Network schematics Leak location and repair Pressure management Sectorising Logging and analysis of minimum night flow Bulk management meters Bulk consumer meters Domestic metering and billing Pipe replacement and repair Co-operation between technical and financial departments in municipalities Basic Water Balance Community awareness and education REFERENCES Some useful references Some useful websites APPENDIX A: BURST AND BACKGROUND LEAKAGE Understanding leakage Background leakage Burst leakage Internal plumbing leakage Where is the leakage? Active and passive leakage control Implementing active leakage control Duration of reported and unreported bursts iv
6 4.6 Addressing visible leaks APPENDIX B: LOGGING AND MINIMUM NIGHT FLOW ANALYSIS Importance of logging Interpretation of minimum night flows Normal night use Normal domestic night use Small non-domestic night use Large non-domestic users Background leakage Background leakage from mains Background leakage from connections Background leakage from properties Calculation of unexplained bursts Calculation of unavoidable annual real losses (UARL) Calculating average zone pressure Average zone pressures where no models exist Calculate weighted average ground level for each sector Measure or calculate average zone pressure Calculate weighted average pressure for aggregation of zones Calculating average zone pressure where a model exists APPENDIX C: LIVE LOGGING OF BULK METERS APPENDIX D: DESIGN OF PRV AND METER INSTALLATIONS Introduction Basic dimensions of the chamber Management meters Strainers Air valves Pressure relief valves By-passes Puddle flanges Dismantling joints v
7 8 APPENDIX E: COST OF LEAKAGE APPENDIX F: VARIOUS FORMS OF ACTIVE LEAKAGE CONTROL Eyes and ears Sounding (listening sticks and geophones) Leak noise correlation Step testing Ground penetrating radar Noise loggers Other advanced techniques Smart Ball Sahara and JD7 systems APPENDIX G: UNDERSTANDING LOGGING RESULTS APPENDIX H: SOFTWARE AVAILABLE FROM THE WRC Introduction The water audit model (AQUALITE) Analysis of minimum night flows (SANFLOW) Pressure management model (PRESMAC) ECONOLEAK WDM scorecard for developing initial WDM strategy Summary APPENDIX I: PRINCIPLES OF PRESSURE MANAGEMENT Importance of pressure management Concepts of pressure management When to use pressure controllers Some large advanced pressure management installations Khayelitsha: City of Cape Town Sebokeng : Emfuleni Local Municipality Mitchells Plain: City of Cape Town November Conclusions A final word on pressure management APPENDIX J: EKURHULENI BULK METER MANAGEMENT PROJECT vi
8 13.1 Introduction Objectives of the project Methodology Identification of top 500 consumers Initial field audit Zero pressure test Drawdown test Design consolidated supply Construction Commissioning Courtesy visit and full report Summary of results APPENDIX K: DRAKENSTEIN MUNICIPALITY WDM PROGRAMME Background How the savings were achieved Metering and block tariff structure Public awareness and water savings devices Real time flow and pressure monitoring Refurbishment and leakage repair Advanced pressure management Hydraulic modelling Conclusions APPENDIX L: COMMUNITY AWARENESS AND EDUCATION Introduction Importance of community awareness and education Door to door education and awareness Public meetings and workshops Pamphlets and posters and billboards Schools awareness and leak reduction Use of media in creating awareness Role of politicians and councillors vii
9 15.9 Monitoring and evaluation Lessons learnt APPENDIX M: HOUSEHOLD WATER USE (APPARENT LOSSES) APPENDIX N: SECTORISING General Checking zone discreteness Tips and traps on sectorising viii
10 LIST OF FIGURES Figure 1: The "Magic Roundabout"... 1 Figure 2: Famous quote by Henry Ford... 2 Figure 3: Some possible WDM Interventions and issues... 3 Figure 4: Fix the obvious! (Courtesy World Bank: Water and Sanitation Sector)... 5 Figure 5: Typical high level system schematic... 6 Figure 6: A more complicated high level schematic... 7 Figure 7: Leak location using sounding equipment... 9 Figure 8: Typical pressure during peak demand periods Figure 9: Typical pressure during off-peak periods Figure 10: Underground leak running at low pressure (Ken Brothers) Figure 11: Underground leak running at high pressure (Ken Brothers) Figure 12: The concept of sectorising Figure 13: Example of a basic flow and pressure logging Figure 14: Typical bulk management meter in PRV chamber Figure 15: Some bulk meters in Johannesburg Figure 16: Typical bulk industrial meter in Ekurhuleni Figure 17: The vicious cycle Figure 18: A case where pipe replacement is clearly appropriate Figure 19: Annual budgets allocated for depreciation of water assets Figure 20: National Water Balance for SA from WRC Report (WRC,2012) Figure 21: Discussing WDM intervention with local residents Figure 22: Typical background leak Figure 23: Typical Household pipework Figure 24: Typical duration and loss through a mains leak Figure 25: Typical mains burst Figure 26: Typical duration and loss through a connection leak Figure 27: Typical connection leak before the meter Figure 28: Property leak after the meter (Courtesy Niel Meyer) Figure 29: Typical duration and loss from a property leak Figure 30: Typical flow logging for zone showing minimum night flow Figure 31: Interpretation of the minimum night flow Figure 32: Zone with sudden rise in leakage (courtesy City of Tshwane) Figure 33: Zone with significant leakage (courtesy City of Tshwane) Figure 34: Massive leak and subsequent repair (courtesy City of Tshwane) ix
11 Figure 35: Leak and repair in Attridgeville (courtesy City of Tshwane) Figure 36: Logging result from large industry (courtesy Ekurhuleni Metro) Figure 37: Detailed logging result from large industry (courtesy Ekurhuleni Metro) Figure 38: Example of leak in townhouse complex (courtesy City of Tshwane) Figure 39: Post repair graph for townhouse complex (courtesy City of Tshwane) Figure 40: Bulk consumer leak (courtesy Ekurhuleni Metro) Figure 41: Typical strainer before a PRV Figure 42: Damaged strainer due to small hole diameter and very high flows Figure 43: Some rocks caught by strainer Figure 44: Typical strainer in PRV chamber under construction Figure 45: Typical air valve and collector pipe Figure 46: Typical pressure relief valve (without surface release) Figure 47: Pressure relief valve with surface outlet (courtesy City of Tshwane) Figure 48: Small installation without by-pass Figure 49: Typical PRV installation with service by-pass Figure 50: Actual installation shown in previous figure Figure 51: Alternative design where main line remains intact Figure 52: Flange adaptor with restrained dismantling joint (bolts not tightened) Figure 53: installation with unrestrained coupling on by-pass Figure 54: Large mains leak on 600mm diameter main at 260m pressure Figure 55: Leak on 600mm diameter main at pressure of 230m (Courtesy N Meyer) Figure 56: Leak on 110mm diameter upvc main at ± 60m pressure Figure 57: Mains leak on 315mm diameter upvc pipe at ± 50m pressure Figure 58: Small connection leak on 25mm diameter upvc pipe at ± 50m pressure Figure 59: Hidden connection pipe burst on 25mm upvc pipe at ± 60m pressure Figure 60: Leak on 63mm diameter pipe that resulted in R3.5 million loss Figure 61: Leak on 50mm upvc supply before repair Figure 62: Leak on 63mm upvc pipe flowing into stormwater manhole Figure 63: Logging results on 50 mm upvc supply after repair Figure 64: Basic Listening Rod Figure 65: Amplified Listening Rod Figure 66: Full ground microphone kit Figure 67: Finding leak with sounding rod Figure 68: Leak noise correlator (courtesy Seba) Figure 69: Theory of leak noise correlation (courtesy Seba) Figure 70: Results from a typical step-test (courtesy Tim Waldron) x
12 Figure 71: Typical "shut-off" for industrial consumer Figure 72: Ground Penetrating Radar Figure 73: Typical GPR Image Figure 74: Noise logger (Courtesy S Hamilton) Figure 75: Typical set of Noise Loggers Figure 76: Possible permanent installation of noise loggers (Courtesy: Seba) Figure 77: Typical employment of noise loggers (Courtesy S Hamilton) Figure 78: Smart Ball insertion equipment (courtesy S Hamilton) Figure 79: Smart Ball Retrieval equipment (Courtesy S Hamilton) Figure 80: Concept of Sahara and JD7 leak location systems Figure 81: Four key considerations for managing physical leakage Figure 82: Four models originally developed by the WRC Figure 83: Updated version of water balance and benchmarking model Figure 84: Updated version of night flow analysis model Figure 85: Updated version of pressure management model Figure 86: Municipal WDM Scorecard available from WRC Figure 87: Fixed outlet pressure control Figure 88: Time control Figure 89: Typical PRV with time-control (photo Niel Meyer) Figure 90: Flow modulated pressure control Figure 91: Flow modulated pressure control Figure 92: Typical flow modulated controller installation Figure 93: Closed loop pressure control Figure 94: Advanced closed loop pressure control Figure 95: Original flows into Eerste River Figure 96: Map of the Eerste River pressure management zone Figure 97: Original pressure in Eerste River Figure 98: Pressures after implementation of fixed outlet pressure control Figure 99: Critical point pressure after fixed outlet pressure control Figure 100: Flow savings from fixed outlet pressure control Figure 101: Location plan for Langa Figure 102: Inlet and PRV outlet pressure into Langa Figure 103: Pressure at the critical point in Langa Figure 104: Advanced pressure control using time control Figure 105: Critical point pressure using time control Figure 106: Schematic layout of Khayelitsha installation xi
13 Figure 107: Khayelitsha pressure management installation Figure 108: External view of the Khayelitsha pressure management installation Figure 109: Organisation framework for Sebokeng PPP Figure 110: Schematic layout of Sebokeng installation Figure 111: Sebokeng/Evaton pressure management installation Figure 112: Water consumption in Sebokeng and Evaton areas for a 13 year period Figure 113: External view of the Sebokeng pressure management installation Figure 114: Schematic layout of the Mitchells Plain installation Figure 115: Mitchells Plain pressure management installation Figure 116: Initial savings from the Mitchells Plain pressure management installation Figure 117: External view of the Mitchells Plain installation Figure 118: Savings from selected pressure management projects in Cape Town Figure 119: Ekurhuleni Location Plan Figure 120: Buried and broken meters Figure 121: Cleaning rubbish from chamber Figure 122: Meter buried in ground Figure 123: Non-functional and old meter Figure 124: Example of an Un-metered fire connection Figure 125: Example of illegal connection to un-metred fire supply by consumer Figure 126: Illustration of Metered and un-metered connections to a single property Figure 127: Typical drawdown test Figure 128: Typical drawdown test Figure 129: Logging results from a drawdown test Figure 130: Typical metered and unmetered supplies Figure 131: Preparing meter pipework Figure 132: Consolidating supplies Figure 133: Capping of old connection Figure 134: Connections consolidated Figure 135: Complete meter installation Figure 136: Blocked strainer Figure 137: Clean strainer Figure 138: Drakenstein municipality locality map Figure 139: Typical pressure logging point in Drakenstein (A Kowalewski) Figure 140: Real time flow and pressure monitoring in Drakenstein (A Kowalewski) Figure 141: Advanced pressure management installation in Drakenstein municipality Figure 142: Results of the NRW assessment for Paarl (A Kowalewski) xii
14 Figure 143: Historical water demand for Paarl (A Kowalewski) Figure 144: Reduction in water demand due to WDM activities (A Kowalewski) Figure 145: Impact of stolen taps on community Figure 146: recovery of stolen taps by community support Figure 147: Initial Khayelitsha installation shortly after completion Figure 148: Khayelitsha installation after "face-lift) (courtesy City of Cape Town) Figure 149: The Sebokeng installation showing winning design Figure 150: Prize giving for the Sebokeng Installation design Figure 151: Community education and awareness in Emfuleni Figure 152: Community education and awareness in Randfontein Figure 153: Public meetings in Sebokeng Figure 154: Public meetings in Evaton Figure 155: Leaking toilet in school Figure 156: Vandalised toilet in school Figure 157:Leaking tap in school Figure 158: Leaking toilet fitting in school Figure 159: Automatic flushing urinal in school Figure 160: leaking urinal in school Figure 161: Leaking school meter Figure 162: Illegible school meter Figure 163: Inefficient water use by learners Figure 164: Unhygienic conditions in schools Figure 165: Water wise mural at school Figure 166: Efficient drip irrigation Figure 167: Graph of consumption in a discrete zone Figure 168: Garden watering in peri-urban area with low payment levels Figure 169: House in middle to high income area with low water consumption Figure 170: Two houses in same area with different water consumption (Z Siqalaba) Figure 171: Water meter readings for the two properties in previous figure (Z Siqalaba) Figure 172: Leaking tap "repair" at one property (courtesy Zama Siqalaba) Figure 173: Typical zone and district layout Figure 174: Initial sectorising of Halifax (courtesy Ken Brothers) Figure 175: Final sectorising for Halifax (courtesy Ken Brothers) Figure 176: Typical sectorising following roads, rivers and railways Figure 177: Sectorised zone showing flow path of supply to Point A Figure 178: Leak near Point A showing valves closed for repair xiii
15 Figure 179: Flow path to Point A after leak repair Figure 180: Pressure profile after re-establishment of zones Figure 181: Opening boundary valve between two pressure zones Figure 182: Approach used to identify cross boundary connections Figure 183: Results of successful pressure drop test Figure 184: Example where both zones are connected Figure 185: Example where both zones are connected Figure 186: Example where the zones are discrete xiv
16 LIST OF TABLES Table 1: NRW figures for South African municipalities (2012) Table 2: Basic information needed for MNF analysis Table 3: Estimate of normal night use Table 4: Estimate of background leakage Table 5: Estimate of burst leakage Table 6: Parameters required for calculation of UARL Table 7: Parameter values used to calculate UARL Table 8: Calculated components of UARL Table 9: Example calculation of weighted ground level Table 10: Example calculation of weighted ground level Table 11: Details of BABE Model documentation Table 12: Eerste River pressure management project savings Table 13: Summary of Khayelitsha savings for initial 2 year period Table 14: Summary of Sebokeng savings for first 60 months of operation xv
17 LIST OF ABBREVIATIONS ADD ALC AZP BABE CARL CBD DWA EMM GPR GPRS GPS GSM IBNET ILI IWA MNF NRW PI PLC PPP PRV SMS UARL upvc WC WDM WRC Average Daily Demand Active Leakage Control Average Zone Pressure Burst And Background Estimate Current Annual Real Losses Central Business District Department of Water Affairs Ekurhuleni Metropolitan Municipality Ground Penetrating Radar General Packet Radio Services Global Positioning System Groupe Spécial Mobile (Global System for Mobile Communications) The International Benchmarking Network for Water & Sanitation Utilities Infrastructure Leakage Index International Water Association Minimum Night Flow Non-Revenue Water Performance Indicator Passive Leakage Control Public Private Partnership Pressure Reducing Valve Short Message Service Unavoidable Annual Real Losses Unplasticised Poly Vinyl Chloride Water Conservation Water Demand Management Water Research Commission xvi

18 1 INTRODUCTION 1.1 Purpose of this book There are many excellent books and publications on the subject of reducing water losses from municipal water distribution systems. This book does not attempt to replicate or replace any of these previous publications but concentrates on highlighting the key issues in simple and straightforward terms in an attempt to explain what interventions can be undertaken in order to reduce water losses from municipal water supply networks and how best to implement them. The book is based on the extensive practical experience of the authors derived from the implementation of various water demand management (WDM) interventions in over 20 countries. Saving water and WDM in general is often quite confusing to a municipality wishing to embark on some form of water loss reduction activities. It can be similar to a driver facing the Magic Roundabout for the first time an unusual traffic feature located in the UK (Figure 1). The new driver entering the 5-sided roundabout normally knows where he is and where he wants to get to but the path to his destination is often not clear and can be very confusing. Figure 1: The "Magic Roundabout" 1

19 A municipality considering whether or not to tackle water losses may find it useful to think carefully about the famous quote by Henry Ford (Figure 2) which is often quoted by Mr Tim Waldron, Chair of IWA Water Losses Specialist Group when he makes his motivational talks on WDM and water loss reduction. Whether you think you can or you can t you are usually right Henry Ford Figure 2: Famous quote by Henry Ford The remainder of this book will try to assist municipalities in understanding how they can reduce water losses from municipal reticulation systems. It is not Rocket Science by any means and the results will take time to achieve. Immediate savings cannot be expected and municipalities should rather plan for a 5-year or preferably 10-year programme. The savings will be difficult to achieve, and possibly more difficult to sustain, but one thing is certain - if no action is taken to reduce water losses, the losses will continue to increase. 1.2 Water loss reduction interventions There is no single WDM intervention that will always provide the best savings at the least cost. Every water-supply system is unique in some way and will have its own specific problems that set it apart from other systems. In reality, reducing water losses from municipal water distribution systems is not complicated, but does require a dedicated and methodical approach if real and sustainable savings are to be achieved. It is often similar to detective work where the first step in the process is to identify and understand the problem before trying to solve it. Too often, water loss reduction interventions are introduced which are inappropriate to the problems experienced in the reticulation system. The interventions must be selected to address the most serious problems experienced in a specific area to have any chance of success. 2

20 There are a great many different interventions that can help to reduce water losses from municipal reticulation systems as can be seen in Figure 3. Figure 3: Some possible WDM Interventions and issues 3
21 The key issue is to decide which interventions are the most appropriate to a specific area and how best to implement them. The most common mistake made by many municipalities throughout the world is to believe that water loss reduction is achieved through only leak detection and repair. In such cases, large budgets are often used to search for unreported leaks using the latest hi-tech and expensive equipment. If the water losses are due to inaccurate metering or even background leakage, the leak detection activities will yield little or no results. Before embarking on any major water loss reduction intervention it is therefore necessary to spend some time and effort to examine the problems and try to identify the root causes of the water losses. Once the real problem issues have been identified, the solutions are often obvious and the way forward becomes clear. In the remainder of this book, the following key water loss reduction issues are discussed which are listed in no specific order: System schematics Leak location and repair Pressure management Sectorising Logging and analysis of minimum night flows Bulk management meters Bulk consumer meters Domestic metering and billing Pipe replacement and repair Water balance Community awareness and education 4

22 2 GETTING THE BASICS IN PLACE 2.1 Addressing the obvious Many municipalities struggle to appreciate the necessity and benefits of dealing with water losses in their reticulation systems. Council officials will often debate at length over a budget allocation of a few thousand Rand when a road leak will run unattended for weeks if not months which can easily run up a bill of hundreds of thousands of Rand. Based on the existing situation in many municipalities, there are a few key issues regarding water loss reduction that need no explanation or detailed analyses which are basically nothing more than common sense. Unfortunately they require a budget and real effort from the municipality often involving excavation of pipelines and repair where necessary. Until these basic issues have been addressed, there is relatively little benefit to be gained by introducing some of the more expensive and sophisticated measures, such as pre-paid metering and automatic meter reading, for example. Figure 4: Fix the obvious! (Courtesy World Bank: Water and Sanitation Sector) The key basic issues should be addressed before any municipality considers implementing any of the more sophisticated and expensive interventions. Addressing the basics correctly will always be cost-effective and should be considered as a pre-requisite for future water loss reduction interventions. 5
23 2.2 Network schematics Before any work can be considered in a water-supply network it is important to understand the basic layout of the network. Some water utilities and municipalities have already developed comprehensive CAD drawings which show every pipe and valve in the system which are very useful, however, they are normally too complicated and detailed for the purpose of gaining a basic understanding of how the system operates. In order to understand how a particular system operates, it is recommended that one of the first tasks undertaken is to develop a high level system schematic. Such a schematic is shown in Figure 5 for the water supply to a small town. As can be seen, the schematic is not drawn to scale and is designed specifically to show the key components in the system including master meters, reservoirs, purification plants etc. Figure 5: Typical high level system schematic The schematic in Figure 5 is a relatively simple system and in the case of larger towns, the schematic may become more complicated as shown in Figure 6. In some cases, it may be necessary to split the schematic into various components in which case, there can be a high level schematic together with several more detailed schematics. 6
24 Figure 6: A more complicated high level schematic 7
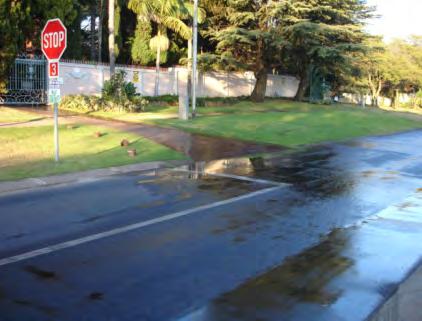
25 2.3 Leak location and repair Identifying and repairing leaks is often what most people think of when addressing water losses. While in some areas it can be very important, in other areas it is not the main problem. Throwing big budgets at leak location and repair may be futile if the underlying problem is high water pressure or a network which is no longer viable. It is, however, a very useful intervention for municipalities spending big budgets very quickly and those offering the leak detection equipment and services like this to be the first and often only water loss reduction activity undertaken by the municipalities. Repairing visible and reported leaks (preferably within 24 hours of being reported) is without doubt one of the most obvious and basic interventions that should be implemented as a top priority. The repair of such leaks needs no financial justification or preliminary assessment to determine if it is worthwhile. It is the most obvious and cost-effective measure that any municipality can undertake and will always be worthwhile. No municipality can expect its customers to save water and pay for services if the municipality allows visible leaks to run for weeks or months without being repaired. Repairing visible leaks is the most basic and obvious water loss reduction intervention that can be implemented. Spending time and effort searching for unreported leaks (those below the ground that are not visible) with some form of leak detection equipment is referred to as active leakage control (ALC). This may or may not be cost effective depending upon the level of leakage in a specific area. If an area is known to have high leakage (the area will have high minimum night flow) and the network is known to be in a poor condition, it may be worthwhile and cost effective to send in a team of leak locators to identify unreported leaks. It must always be noted that all visible leaks should be repaired before any leak location activities are undertaken to search for new and unreported leaks. It should also be noted that the equipment used to identify the unreported leaks need not be the most expensive or most sophisticated. In most cases, a well-trained experienced leak detector with a basic listening rod will often find more leaks than a poorly-trained leak locator with the most expensive equipment. Figure 7 shows some leak location equipment in action. 8

26 Figure 7: Leak location using sounding equipment 2.4 Pressure management Pressure management is one of the most important WDM interventions that should be considered when attempting to drive down water losses. Leakage is driven by pressure and, while it must be acknowledged that pressure management is not the answer in every case, it is often one of the most cost-effective measures to reduce leakage and wastage that can be considered. Many municipal water-supply systems in South Africa are operated at unusually high pressures and, as a result, pressure management is often one of the most important WDM interventions that can be implemented. Pressure management can take many forms ranging from the basic fixed outlet pressure control to some form of more sophisticated hydraulic or electronic control which is often referred to as smart control or advanced pressure control. South Africa was one of the first countries in the world to adopt the principles of advanced pressure control initially developed in the UK for the UK water industry back in the early 9
27 1990s. The techniques used in the UK were first presented in South Africa in 1997 and following a series of small pilot projects, the full-scale Johannesburg Pressure Management Project was completed in 1999 involving the design and commissioning of almost 50 advanced pressure control installations. Around the same time, both Cape Town and Drakenstein municipality recognised the benefits of pressure management and introduced measures to lower pressures in their water supply systems. Cape Town currently boasts the lowest level of non-revenue water (around 20%) for any Metro in the country while Drakenstein now has one of the lowest levels of non-revenue water for any municipality in the country (around 11%). Pressure management is a key component of the water demand management interventions that have been implemented in both cases. Following the success of the Johannesburg project, one of the most ambitious pressure management projects undertaken anywhere in the world was designed and commissioned in 2001 in Khayelitsha for the City of Cape Town (see Section for details). At the time, this was the largest installation of its type in the world and was the forerunner to the even larger installation located in Emfuleni Local Municipality both of which have received national and international recognition. The most recent large-scale advanced pressure management installation in South Africa was commissioned in Mitchells Plain for the City of Cape Town in November 2008 and was the 3rd large-scale pressure management installation of its type to be constructed in South Africa (Meyer, Wright & Engelbrecht, 2009). Each of these three installations controls the supply of water to approximately residents from a single supply. It is interesting to note that South Africa is one of the few countries in the world where such installations are viable due to the nature of the water-supply systems and the relatively high service levels. Water-supply systems worldwide are generally designed to provide water to consumers at some agreed level of service, which is often defined as a minimum level of pressure at the critical point which is the point of lowest pressure in the system. In addition, there may be certain fire-flow requirements which can override the normal consumer requirements. The systems are designed to accommodate these pressure and flow requirements during the period of peak demand which would normally occur at some specific time of the day and during a particular month in the year. In other words, the systems are designed to provide the appropriate supply volumes and pressure during a very short period in the year and for the remainder of the time the systems tend to operate at pressures significantly higher than required. Even within the same system, there will be areas of high pressure due to topography and/or distance from the supply point with the result that many parts of a supply 10

28 area will operate at pressures significantly higher than required in order to ensure that there is sufficient pressure at the one critical point. Managing water pressures in a supply area is not a simple issue, and there are a great many items to consider. The common factor in every system is the fact that leakage is driven by pressure and, if the pressure is increased, the leakage will also increase. In order to reduce leakage through pressure management it is necessary to reduce the water pressure without compromising the level of service with regard to the consumers and firefighting. As mentioned previously, most systems are designed to provide a certain minimum level of service in the system during the peak demand period as shown in Figure 8. If the water pressure in a system can be reduced, even, for a short period during times of low demand, the water leakage from the system will be reduced. In this example it is assumed that a minimum pressure of 20m is required. Figure 8: Typical pressure during peak demand periods During the off-peak periods, which tend to much greater than the peak periods, the system operates at a water pressure which is significantly higher than necessary as shown in Figure 9. In effect, there are long periods when there is significant scope for pressure reduction and this is the basis on which the pressure management interventions are designed. 11

29 Figure 9: Typical pressure during off-peak periods Reducing the water pressure in a system can be achieved in many ways ranging from simple fixed outlet control valves to a variety of electronic or hydraulic controllers. Over the past 15 years, many new control devices have been developed, each of which offers greater sophistication and intelligence than previous devices. Smart controllers have become even smarter, with several of the latest devices incorporating artificial intelligence and feedback loops. Without detracting from the latest advances in pressure management, it is critically important for water-supply managers not to lose focus of the real problem issues as no piece of equipment, hydraulic or electronic, can replace the need for a properly designed, well managed and well maintained network. Ensuring that boundary valves are closed or open on a regular basis as per the network design is of greater importance than any pressure controller, which in any event will not operate properly when a pressure management zone has been compromised by unauthorised opening or closing of boundary valves. South Africa is one of the most progressive countries in the world with regard to the use and implementation of many forms of advanced pressure control. Since the first large-scale project was implemented by the City of Johannesburg in 1998, many other cities throughout the country have found out for themselves the benefits that can be achieved through some 12
30 form of pressure management. It is important to realise that it is not always necessary or appropriate to use the most sophisticated or expensive electronic or hydraulic controllers and the appropriate technology to suit a specific situation may often result in the use of the most basic (and robust) equipment. The selection of the most appropriate form of pressure control will ultimately be based on many factors including, cost, technical expertise within the water utility, technical backup for the equipment, topography, leakage levels as well as main source of leakage. It is therefore important for the water-supply manager to carefully select the most appropriate pressure management equipment for each zone to provide a sustainable and effective solution. Pressure management can produce huge savings, but the key to success rests not with the valves or the associated high-tech add-ons but rather with sorting out the pressure zones and making sure that they remain discreet. Most of the savings achieved through pressure management originate from the basic fixed outlet pressure reducing valve and the additional benefits to be achieved from some form of advanced control are often exaggerated. The most serious problem facing municipalities in South Africa is ensuring that the pressure zones are operating properly and have not been compromised through an unauthorised opening or closing of valves. Unfortunately sorting out the zones is often tedious and thankless work which attracts little attention and is rarely the sort of material that makes a good conference paper. It is, however, the key to any successful pressure management installation. It must always be remembered that pressure management does not eliminate leaks or repair any existing leaks. All leaks in the network before the introduction of pressure management remain as leaks after the pressure management installation has been commissioned. The benefits of pressure management are mainly through the fact that the leaks will run at a lower rate at any time where pressure has been lowered as can be seen in Figure 10 and Figure
 In addition, the lower pressure regime will lower the rate at which")

31 Figure 10: Underground leak running at low pressure (Ken Brothers) Figure 11: Underground leak running at high pressure (Ken Brothers) In addition, the lower pressure regime will lower the rate at which new leaks develop and in many cases the incidence of new bursts can be reduced significantly sometimes 90% or even more. The financial benefits of the reduction in new bursts and prolonging the life of the 14
32 reticulation system are rarely included in the financial analyses despite the fact that they dominate the financial viability of most pressure management projects.pressure management will usually provide very attractive pay-back on the initial investment. Further details of the different forms of advanced pressure control are discussed in Section 12 (Appendix I). 2.5 Sectorising Sectorising is simply the process of cutting a big area into smaller more manageable areas which allows the water manager to identify problem areas. The process of sectorising is well known as a critical element of any water loss reduction programme. The International Water Association s (IWA s) recommendations on a maximum zone size of approximately connections has been embraced throughout the world to the extent that this is often considered a pre-requisite to any other WDM intervention. Unfortunately while it is recognised that sectorising is very important, it is equally important to recognise that sectorising is only a means to an end and not the end itself. What is often overlooked when considering the sectorising of a large system is the fact that every new sector created must be maintained indefinitely if it is to remain effective. The costs and effort required to maintain new zones is often neglected. These costs are rarely added to the operational budgets of the municipality with the result that any zones created tend to be breached soon after establishment. The lack of commitment to the maintenance of zones is one of the most common and serious issues facing many water utilities. It is therefore often better to concentrate on a smaller number of larger zones that can be properly maintained rather than too many small zones that are not maintained. It should also be noted that in areas where small zones have not been established, it is still possible to use the concept of sectorising to identify problem areas, albeit on a temporary basis usually referred to as step testing (see Section 9.4 in Appendix F). Through the use of step-testing it is possible to identify the key problem areas despite the fact that there may be few if any permanent zones. Step-testing is the process of closing internal boundary valves in order to isolate or cut-off portions of the network. By simultaneously monitoring the nightflow during the sectorising process, small zones of high leakage can be identified. This is not a new concept by any means, but appears to be largely neglected by many water utility managers who have forgotten that this is one of the most useful tools for identifying and reducing water losses from reticulation systems. 15

33 Figure 12: The concept of sectorising Splitting a large area into smaller zones will not reduce water losses at all. It will simply enable the water losses in each zone to be monitored and measured after which appropriate action can be taken if required to tackle the water losses if they are considered to be excessive and in need of some form of action. 2.6 Logging and analysis of minimum night flow The logging of pressures and flows in a water reticulation system is a bit like a doctor measuring the pulse and blood pressure of a patient to see how healthy he or she is. This monitoring process is effectively the intervention that supports the sectorising process as discussed in the previous section. After zones have been established, the flows and pressures can be monitored in order to identify specific problem areas. So much can be determined from the examination of the logging results that it is surprising how few municipalities in South Africa have a logger let alone understand how to interpret the logging results. With the advent of the Internet and availability of GSM and GPRS communications, it 16

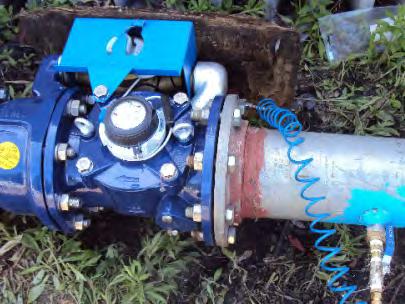
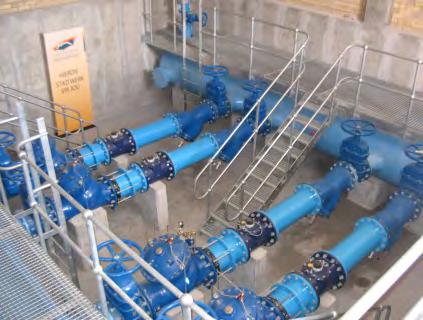
34 is now, not only possible, but highly cost-effective to use loggers which automatically transmit the data directly to some receiving platform where the results are immediately available to anyone with a smart phone or other mobile device. The full benefits of live data acquisition, analysis and display have yet to be fully realised in South Africa and the interpretation of the logging results is discussed in more detail in Appendix C. Figure 13: Example of a basic flow and pressure logging 2.7 Bulk management meters Bulk management meters are sometimes considered to be an unnecessary luxury by water reticulation managers who don t appreciate the need to continually monitor the pressures and flows throughout their networks. Such meters are not used to generate accounts to anyone, but are specifically to help the water supply managers to monitor and understand what is happening in the water supply network. Bulk management meters are therefore essential for the proper operation and management of any reliable and well managed water supply system. A typical example is shown in Figure
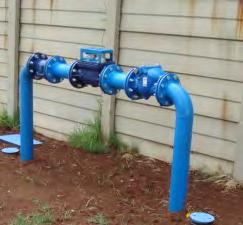
35 Figure 14: Typical bulk management meter in PRV chamber Ideally, bulk management meters should be installed at the entrance to every zone in the system (see Figure 15) and such meters are effectively part of the overall sectorising process as discussed previously. The old saying that to measure is to know cannot be over emphasised and it is the bulk meters throughout the water-supply system which are used to measure and quantify both water supplied to an area as well as the level of leakage in a specific area. Such bulk meters are an essential component of any efficient management process and they should be properly maintained and used to help identify problems which can then be rectified. Ideally there should always be an option for measuring the water pressure at the same time as the flow into an area is measured. Knowing both pressure and flow helps to explain some of the problems which regularly occur. Once again, it is important that the water supply manager is able to understand the flow and pressure logging results and this is discussed in more detail in Appendix C. 18

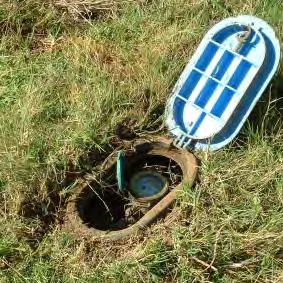
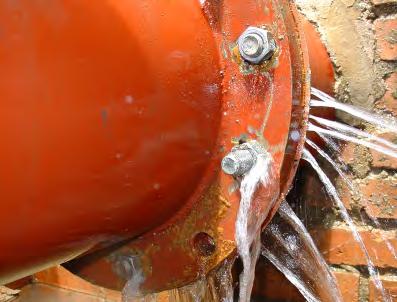
36 Figure 15: Some bulk meters in Johannesburg 2.8 Bulk consumer meters Industrial customers demand and expect a reliable water supply from their water service provider. No company in the world will invest billions on a new manufacturing facility if the water supply is likely to be unreliable. Industries pay their water accounts and do not expect to receive free water, but do expect a very reliable supply that they can count on in their industrial processes. Most municipalities charge an industrial water tariff, which is usually higher than the domestic tariffs. In addition, they often charge a higher sewage tariff due to the fact that the industrial effluent can be problematic from a water quality perspective. Since industries tend to use large quantities of water, often through a single connection, and also pay fully for their water use at a relatively high tariff, they often represent a very significant component of the water supplier s total annual water income. It is for this reason that industrial water users should receive some level of special attention by the municipality to ensure that they are properly metered and properly billed. This is one of the most important issues that a water supplier should address when dealing with the commercial losses component of its water balance. To highlight this issue, a project recently undertaken by Ekurhuleni Metropolitan municipality (EMM) is discussed in detail in Appendix F. Since the problems relating to the accurate metering and billing of large consumers are not limited 19

37 to Ekurhuleni Metropolitan municipality, there is enormous scope for the replication of this project throughout large and small Metros and municipalities in South Africa. In many municipalities, the metering and billing of large consumers is poor, with numerous meters buried or broken or old and many un-metered connections. In light of the savings achieved through this initiative undertaken by Ekurhuleni Metropolitan municipality it is anticipated that savings can be achieved in other municipalities. Consumers who use a significant volume of water each month and are metered through a bulk meter are very important customers to the water supplier. The bulk consumer meters for such customers can effectively be considered as the cash registers for the municipality. The metering of large consumers is therefore of critical importance to the water supplier as it is a key element of their revenue stream and the revenue generated from a small number of large industrial consumers can often exceed the remaining revenue generated from the residential customers. It is much easier to monitor, bill and control the water supplied to a small number of bulk customers compared to a large number of smaller domestic water users. Figure 16: Typical bulk industrial meter in Ekurhuleni 20
38 2.9 Domestic metering and billing The metering and billing of domestic consumers should not present problems to municipalities since water is needed by everyone and Government is asking all users to pay for their services. Unfortunately the payment issue is a serious problem in many areas and it will not be solved overnight. If residents can be encouraged to pay for the water they use, many of the existing problems faced by many municipalities will soon disappear. Currently, there appears to be insufficient political support to enforce payment and the issue of nonpayment is likely to remain a problem throughout South Africa for years to come. Nonpayment is often accompanied by excessive domestic water use and a vicious cycle is established where high water consumption leads to high water bills that cannot be paid since many of the consumers are unemployed and cannot afford to pay high water accounts. Once a customer has taken the decision that they will not pay for their water use, there is no incentive for them to use water efficiently and so in such cases the levels of leakage and general wastage become significant. With low payment levels, the municipality will eventually become bankrupt or have to reduce the funds spent operating and maintaining the water supply system which will deteriorate over time and leakage levels will continue to increase. The level of service delivery will therefore decrease, visible leaks will become more common and the image of the municipality will be damaged. Residents experiencing the poor service levels will not be willing to pay their water accounts and thus the cycle continues in a downward spiral as shown in Figure

39 Figure 17: The vicious cycle One final word of caution when considering the issue of domestic metering and billing concerns the recent trends in the use of smart metering, which has been very successful in some parts of the world. Such metering often eliminates the need for meter readers and, through the use of electronic meters and/or meter reading devices, will also eliminate many of the meter and billing inaccuracies. If implemented properly, this technology offers great potential for improved metering and billing but there are a number of important issues to be considered before embarking on the use of such equipment. The most important and critical issue which often appears to be overlooked is the need to engage with the community in advance and secure a commitment from the consumers that they are willing to accept the new system and pay their water accounts. If this is not fully resolved before such metering systems are implemented they will fail completely. In many 22
40 cases, the reasons for withholding payment are linked to other underlying issues such as poor levels of water supply or very high levels of household leakage. If these are the reasons for poor payment levels, no new smart metering system will help and it will in fact simply aggravate an already dire situation. In such cases, the underlying supply problems must be addressed before any new metering system can be implemented. Another consideration concerns the relatively high initial cost of the equipment as well as the potential loss of employment opportunities for existing meter readers. In many water-supply systems throughout South Africa, there is already insufficient budget to maintain and repair the network in order to provide a reliable and safe water supply. In such cases, it may be considered unacceptable by the customers to spend many hundreds of millions on new meters despite the expectations that the new systems will solve the billing and cost recovery problems. On the issue of meter readers, there is already such high unemployment in most parts of South Africa that any job losses will be very unpopular. Any proposal to introduce sophisticated technology; often imported from overseas, which may eliminate job opportunities in areas experiencing high levels of unemployment must therefore be very carefully considered Pipe replacement and repair When to repair and when to replace is a question that many water distribution managers struggle to resolve. Pipe replacement is often the most expensive water loss reduction intervention that can be implemented. At some point in the life of a pipeline, however, the repair of the pipe becomes impractical (see Figure 18 which is a genuine section of pipe as it was removed from the ground) and the only solution is to either reline or replace the pipe both of which are extremely expensive options. There are currently two main schools of thought when it comes to pipe replacement in South Africa. One approach that was implemented in the ethekwini Metro was the blanket replacement approach where all pipes of a certain type and or age were replaced. In this case, it was decided to replace all of the asbestos cement pipes in the network. This was a massive undertaking involving pipe replacement of mains at an estimated cost of almost R1 billion. 23

41 Figure 18: A case where pipe replacement is clearly appropriate An alternative approach to blanket replacement has been introduced in Tshwane Metro in which certain types and age of pipes are replaced according to the incidence of burst pipes as recorded and monitored on the municipality s management information system. This approach involves the replacement of pipes as they deteriorate to a level where the occurrence of new leaks becomes so high that the pipes are effectively no longer suitable for use. This approach requires the collection and analysis of all burst information which is part of a sophisticated GIS/MIS system. Such information and statistics on pipe bursts is invaluable when used to determine whether or not it is time to replace a section of pipe and is one of the factors contributing to the lower than average leakage experienced in Tshwane Metro. Both of the above mentioned approaches are supported by the respective water managers who operate and manage large water reticulation systems. In cases where funding is a major constraint, then the option of selective replacement will most likely be the appropriate route to follow since there will simply be insufficient funds available to complete a full replacement of some pipe type. 24
42 Great care should be taken when considering any large-scale pipe replacement project and it is recommended that some form of pilot area should be tested before embarking on any full scale project. Numerous pipe replacement projects have been undertaken where the leakage has in fact increased after long lengths of pipework have been replaced. Pipe replacement is the most expensive water loss reduction intervention in most cases and it should be considered as the action of last resort after other options including pressure management and leak repair have been exhausted Co-operation between technical and financial departments in municipalities One of the most serious problems facing many municipalities in South Africa with regard to water loss control is the divide between the technical and financial departments within the municipalities. In most cases, the technical managers who are responsible for the supply of water to all customers of the municipality have little control over the billing of the water sold to the customers or the use of the funds recovered to sustain the water supply system. Too often, the sale of water is seen as a cash-cow to the municipality and much of the income generated from water sales is used to fund other more important matters. As a result of this practice, there has been a general lack of re-investment in water-supply systems throughout South Africa, which eventually results in a poor level of service to the customers. Burst pipes cause water shortages and water quality problems and in extreme cases will eventually lead to intermittent supply. It is essential that water-supply managers appreciate the need to reinvest large amounts of capital in maintaining the water-supply infrastructure. A figure of 2% of the replacement cost of the water-supply system annually is required to maintain a 50-year replacement cycle. That is the norm for a properly managed water supply system operating at an average water pressure of around 50m. Unfortunately if the financial department is not working closely with the technical department, the 2% needed to maintain the system will rarely be allocated and the system will gradually deteriorate. Many municipalities do not even know the replacement value of their water-supply infrastructure, and have little or no idea how much they should be allocating to maintenance. It is usually safe to assume that the budget allocated for maintenance is well below what is needed. In a recent assessment undertaken in Australia, it was established that the annual budget required to cover the depreciation of assets for the water supply infrastructure for a selection of Australian and New Zealand municipalities was between 25% and 45% of the annual operating budget for the whole of the water department. (See Figure 19 courtesy Tim Waldron). In other words, the 2% of the 25

43 replacement value of the water-supply infrastructure needed just to maintain the status quo represents almost half the total budget allocated to the water-supply department. In South Africa, there has been such a long period of under-investment in many water-supply systems that even 2% of the replacement cost may not be sufficient to adequately maintain the watersupply systems due to the backlog that has developed. It may therefore be necessary to provide a larger budget for several years to address the maintenance backlog after which the 2% should be sufficient. Figure 19: Annual budgets allocated for depreciation of water assets Basic water balance The South African Water Research Commission (WRC) has been providing support to municipalities to address leakage and wastage from their potable reticulation systems since the early 1990s. South Africa was one of the first countries outside of the UK to fully recognise the benefits of adopting the Burst and Background Estimate (BABE) methodology, which was initially developed by the UK water Industry when the major water suppliers in England and Wales were privatised in the early 1990s. The aspect of non-revenue water (NRW) measurement and benchmarking has been one of those important interventions which the WRC has being pursuing and developing over the years. Complementing this, the WRC has supported the development of various models to assist water suppliers in understanding and ultimately reducing their leakage. These included the SANFLOW night - flow analysis model (WRC, 1999, The PRESMAC pressure management model (WRC, 26
44 2001) the ECONOLEAK active leakage control model (WRC, 2002) and finally the AQUALITE water balance model, which is used to assess the levels of NRW based on the IWA Water Balance. All of the models are discussed in more detail in Appendix D. Unavoidable annual real losses An interesting and important concept that was recently developed (Lambert et. al., 1999) concerns the level of physical leakage (real losses) in a system that theoretically cannot be avoided. It is widely accepted that no system can ever be completely free from leakage no matter how new or well managed. The concept of unavoidable annual real losses (UARL) is now one of the most useful and important concepts used in component based leakage management. Effectively, it is a simple concept based on the fact that no system can be entirely free from leakage and that every system will have some level of leakage which cannot be reduced any further. Even a new reticulation system with no use will have some level of leakage, although it may be relatively small. The minimum level of leakage for a system is the lowest level of leakage that can be achieved for the given system based on the following assumptions: The system is in top physical condition and is well-maintained; All reported leaks are repaired quickly and effectively; Active leakage control is practised to reduce losses from unreported leaks. Considerable work was undertaken to assess the minimum level of leakage for water distribution systems (Lambert et. al., 1999) and, after careful analyses of many systems throughout the world a relatively simple and straightforward equation was developed. The standard form of the equation is as follows: UARL = (18 * Lm * Nc + 25 Lp ) * P Where: UARL = Unavoidable annual real losses (/d); Lm = Length of mains (km); Nc = Number of service connections (main to meter); P = Average operating pressure at average zone point (m); Lp = Length of underground pipe from street edge to customer meter (km). 27
45 The basic equation is based on an average length of pipe from the water main to the customer meter of 10m. The third term (the Lp term) is therefore only used in cases where the customer meter is located in excess of 10m from the water main. In countries such as South Africa where the customer meter is located at the street edge, the equation can therefore be simplified to the following: UARL = (18 * Lm * Nc ) * P To show how easily the UARL can be calculated for a system a simple example can be used. If a system has 114km of mains, service connections all located at the street property boundary edge and an average operating pressure of 50m, the UARL can be calculated in the following manner: UARL = (18 * * * 0) * 50 Litres/day = litres/day = litres/day = m 3 /day = m 3 /year = 66 litres/connection/day Performance Indicators including the ILI Selecting an appropriate performance indicator to quantify and monitor leakage from a water network is often a contentious issue as there are several schools of thought in this regard. What is generally accepted by everyone around the world is that percentages should not be used as they can be extremely unreliable and will often give the completely wrong picture. This statement can be explained using a very simple example. In a water-supply system which is supplied with 150 million m 3 /annum, the leakage is known to be 50 million m 3 /annum and the water use is 100 million m 3 /annum. The leakage in this case is ± 33.3%. A drought occurs and the municipal manager is tasked with reducing the water use in the area and he implements water restrictions resulting in the water use dropping from 100 million m 3 /annum to 50 million m 3 /annum. The total water entering the system is now 50 million m 3 /annum consumption and 50 million m 3 /annum leakage. The percentage leakage has now increased to 50% despite the fact that in reality the leakage has remained the same. This simple 28
46 example demonstrates the danger of using percentages when discussing leakage. Despite general agreement internationally on why percentages must not be used; they remain the indicator of choice in most parts of the world. If it is accepted that percentages will always be used, they should always be accompanied by some form of warning and if possible, one of the other more reliable indicators should also be included. There are several other performance indicators which each provide a different picture of the leakage from the system being analysed. They are often helpful in providing a better picture of the leakage levels rather than simply accepting the usual percentage. The three recommended performance indicators are discussed below. The most basic indicator is expressing the losses in litres/service connection/day or m 3 /km mains/day. If a system has more than 20 service connections per kilometre, it is recommended that litres/service connection/day be used. In more rural systems with less than 20 connections per kilometre, it is recommended that m 3 /km mains /day be used. A more sophisticated and involved indicator can be used in cases where the average system pressure is taken into account. This intermediate performance indicator (PI) is basically similar to the basic version discussed above for systems with more than 20 connections per kilometre of mains. The losses are expressed in terms of litres/service connection/day/metre of pressure. This PI takes the average system pressure into consideration, but does not allow for the actual density of connections and average length of private un-metered supply pipe. Finally if there is information on the length of mains, the number of service connections and the system pressure then a more detailed PI called the ILI can be used. The Infrastructure Leakage Index (ILI) is now widely used throughout the world as an indicator of physical leakage from a water-supply system. It is a single number which is dimensionless and is the ratio of the current annual real losses to the unavoidable annual real losses (as mentioned in the previous section). Full details of the ILI calculation are provided in the original paper by Lambert (1999). It is a very useful indicator which should be used whenever possible. A value of 1.0 suggests that the actual leakage is equal to the minimum level of leakage that can in theory be achieved in the specific zone. If the ILI is 10.0 then it suggests that the actual leakage is 10 time higher than it could be. Once the ILI exceeds 10 or 20 it becomes rather academic as the purpose of the indicator is to highlight whether or not the zone has a leakage problem. Any value of 10 or above usually suggests that there is a very serious leakage problem and the actual number becomes less important. 29
47 Details of various NRW assessments Four NRW assessments have been published by the WRC in the last 20 years. The initial NRW assessment, undertaken in 1999, eventually used only 20 datasets which were considered to be of an acceptable quality from a potential set of approximately 600 water suppliers. The assessment suggested that the average NRW for the 20 water suppliers was in the order of 25%, with an average ILI value of 6.0. Most of the acceptable datasets were provided from the larger municipalities, which were the only water suppliers at this time who collected the appropriate base data and meter readings. As a result of this initial assessment, the WRC commissioned a follow-up assessment in In the 2005 assessment (WRC, 2005) information from 60 water suppliers was obtained from which 30 acceptable datasets were identified representing just under 50% of the total municipal water supplied in South Africa. In this assessment, the percentage NRW was not calculated due to the IWA recommendations on avoiding the use of percentages when dealing with NRW. Unfortunately, most of the municipalities and politicians wishing to use the results insisted that the percentages were included in all future reports. As a result they were again included although it is recommended that other performance indicators such as the ILI are also used. The ILI, which provides an indication of the physical leakage (not the overall NRW), was however calculated for the 30 municipalities and an average value of 6.3 was derived. Once again, the value of the assessment was clear to the WRC as well as the Government which commissioned a third assessment to be undertaken. The third assessment was undertaken in 2007 (WRC, 2007) and involved 100 datasets from which 62 were included in the final assessment, representing almost 60% of the total municipal water use in South Africa. In this assessment many of the smaller municipalities were included and the NRW was estimated to be 36%, with an average ILI of 7.6. The percentage NRW was again included in the assessment despite the fact that it was accepted that percentages can be very misleading. Some of the high level committees were uncomfortable with the use of the ILI and other recommended performance indicators with the result that percentages were used albeit with a health warning to highlight that they can be misleading in certain cases. 30
.")
48 The 2012 NRW assessment Following the success of the 2007 assessment in raising the issue of NRW to a national platform where it was discussed at length by Government, a 4 th assessment was undertaken between 2010 and 2012, the results of which were officially released in March 2013 (WRC, 2012). This assessment is the most comprehensive and detailed assessment of NRW undertaken in South Africa and involved water balance information from more than 130 municipalities. The project was supported not only by the WRC but also the Department of Water Affairs. The data gathered from 132 of the possible 237 municipalities supplying water to more than 40 million residents represents over 75% of the total volume of municipal water supply in South Africa. The results indicate that the current level of NRW estimated for the country as a whole is almost 37% with an average infrastructure leakage index (ILI), which is an indicator of the physical leakage, of 6.8. The NRW figure for South Africa is similar to the estimated world average of 36.6% but is considered high in comparison to other developed countries but low when compared to other developing countries. Once again, it must be stressed that percentages can be misleading and the values provided in Figure 20 should therefore be used with caution. The ILI of 6.8 is considered to provide a realistic indicator of physical leakage for the South African systems and it is interesting to note that the various estimates of ILI over the past 12 years have all been between 6 and 8. Again, this would be considered high for most developed countries but low for most developing countries, and highlights the fact that levels of physical leakage are generally high in South Africa. 31

49 Figure 20: National water balance for SA from WRC Report (WRC, 2012) It should also be noted that in South Africa, every water supplier is categorised according to the size of the population supplied and whether the area is urban or rural. The results from the breakdown into the different categories are provided in Table 1. Table 1: NRW figures for South African municipalities (2012) Category Population Input (m 3 /a) NRW (m 3 /a) Revenue Water (m 3 /a) A B B Urban Total B B Rural Total National Total Extrapolated l/c/d The figures provided in Table 1 are based on an estimated total urban and rural consumption of approximately 4 292million m 3 /annum, which was considered to be realistic for the country as a whole and this figure was used in the calculations to generate the extrapolated values provided in the last row of the table. The latest NRW study undertaken for the WRC and DWA represents a major advance in the understanding and assessment of water losses from municipal water supply systems in South Africa. It is the most comprehensive assessment yet undertaken and despite the 32
50 many problems experienced with data collection from many of the smaller municipalities, it was possible to gather information for more than 75% of the water supplied in South Africa. The overall NRW for South Africa is estimated to be 1 580million m 3 /annum, which is approximately one third of the total water supplied. Conservatively, this represents an annual loss of over R7 billion based on an average bulk water tariff of approximately R5/m 3. The average ILI value for all of the South African municipalities of 6.8 is in line with the world average. This figure would be above average (i.e. bad) when compared to most developed countries and well below average (i.e. good) when compared to most developing countries. Effectively, the ILI value of 6.8 tends to support the perception created from the percentage non-revenue water figures for South Africa (36.8%) where there is clearly a high level of wastage or water losses in the country and considerable scope for improvement. It should be noted that the figures are based on the Standard IWA Water Balance in which the Revenue Water figures provided by the financial departments are assumed to be correct. In South Africa, however, there can be a significant component of revenue water which is never paid for by the consumers. Preliminary estimates of this component suggest that if this is taken into account, the level of NRW may increase by up to 10%. Investigations are continuing to try and quantify this element with greater certainty so that future assessments can provide a more complete and accurate water balance Community awareness and education This item has deliberately been left to the end, not because it is the least important of the interventions discussed, but because it is the most important. Too often, well designed and implemented technical interventions fail miserably purely due to the fact that the community they serve are not included in the overall process with the result that they do not buy-into the project. In extreme cases, the community representatives may go out of their way to ensure that some technically sound project fails. Proper consultation with the community is therefore an essential element of any technical WDM intervention (see Figure 21) and is discussed in Appendix H. 33

51 Figure 21: Discussing WDM intervention with local residents It is unfortunate that community awareness and education activities are difficult to monitor with regard to the cost of the activities compared to the savings achieved which are often impossible to quantify. As it is therefore difficult to develop a cost-benefit analysis for the proposed activities, they are often not supported at the political level where funds are allocated. It is therefore necessary to incorporate the costs associated with the community awareness and education activities as part of every technical intervention when undertaking the cost-benefit calculation for the technical intervention. 34
52 3 REFERENCES 3.1 Some useful references Authors Title Publisher Reference Alegre, H., Hirner, W., Baptista, J. and Parena, R, 2000 American Water Works Association Engelbrecht, M, Meyer, N, Wright, D, (2009) Performance Indicators for Water Supply Services Manual of Water Supply Practices: Water Audits and Leak Detection: AWWA M36 Large scale pressure management implementation in the City of Cape Town IWA Publishing Manuals of Best Practice Series, 2000 Available from the AWWA, 6666 West Quincy Avenue, Denver, Colorado 80235, USA. IWA Water Loss Conference, April ISBN ISBN Farley, M & Trou, S, April 2003 Lambert, A.O.,1997 Lambert A., Brown T.G., Takizawa M., Weimer D, 1999 Lambert, A, Myers, S and Trow,S., 1998 Lambert, A and Mckenzie R. (2002). Ledochowski, W Liemberger, R and Mckenzie, R Losses in Water Distribution Networks A Practitioner s Guide to Assessment, Monitoring and Control Pressure Management/Leakage Relationships: Theory, Concepts and Practical Applications A Review of Performance Indicators for Real Losses from Water Supply Systems Managing Water Leakage: Economic and Technical Issues. Benchmarking of Water Losses in New Zealand (Incorporating the User Manual for the Benchloss NZ Software: Version 1A). User An Analytical Method of Locating Leaks in Pressure Pipelines.. Accuracy Limitations of the ILI. Is it an Appropriate Indicator for Developing Countries? IWA Publications, ISBN Portland Customer Services. sales@portlandservices.com Conference on Minimising Losses in Water Supply Systems, Apr IQPC Ltd, London AQUA, Dec 1999 ISSN Financial Times Energy Publications, Maple House, 149 Tottenham Court Road, London W1P 9LL New Zealand Water & Wastes Association (2002) Transactions of the South African Institution of Civil Engineers, December 1956 pp Proceedings from the International Water Association Specialist Conference: Leakage 2005, Halifax, Nova Scotia, Canada. pp September ISBN ISBN X; ISBN for CD is
53 Authors Title Publisher Reference Maddaus Water Management, 2014 Preparing Urban Water Use Efficiency Plans May, J, 1994 Pressure Dependent Leakage World Water and Environmental Engineering McKenzie, R., Wegelin, W. and Rohner, K., (2000) Mckenzie, RS, 2001 Mckenzie, R.S., Meyer, N and Lambert A.O., McKenzie, R., 2002 Mckenzie, R.S., 2002 Mckenzie, RS, Wegelin, W and Meyer, N McKenzie, R., Mostert, H and Wegelin, W.,( 2003) Mckenzie, R and Lambert, AO. (2004). Mckenzie, R, Seago, C and Bhagwan, J. (2004). National Water Council Standing Leakage Reduction Through Pressure Management in the Greater Johannesburg Area Greater Johannesburg Metropolitan Council Water Conservation and Demand Management Strategy Calculating Hour-Day factors in Potable Water Distribution Systems - HDF User Guide. Khayelitsha: Leakage Reduction through Advanced Pressure Control Development of a Windows based package for assessing appropriate levels of active leakage control in water distribution systems Leakage Reduction Projects Undertaken by Rand Water Leakage Reduction through Pressure Management in Khayelitsha, Western Cape: South Africa. Best Practice Performance Indicators for Non-Revenue Water and Water Loss Components, A Practical Approach. Assessment of Real Losses in Potable Water Distribution Systems: Some Recent Developments Report No. 26, Technical Working Group on Waste of IWA Publishing ISBN American Water Works Association Annual conference, Denver, Colorado. June 11 to 15, UN Habitat in association with Greater Johannesburg Metropolitan Council South African Water Research Commission, Report Number Available from the internet on Journal of the Institution of Municipal Engineering of South Africa, Volume 27, No 8, pp43 to 47, August South African Water Research Commission, Available from the internet on Rand Water in association with UN Habitat Paper presented at the Australian Water Association Annual Conference, Perth, 7-10 April, Water 21, Magazine of the International Water Association, August Paper presented at the International Water Association (IWA) World Water Congress, Marrakech, September UK Water Industry TT 184/02 ISBN Report TT 169/02, ISBN ISBN ISBN X
54 Authors Title Publisher Reference Technical Committee,1980 Office of Water Services (UK), 1998 Seago, C, Mckenzie, R & Bhagwan, J Seago, CJ, Mckenzie, RS and Bhagwan, J. (2006) South African Bureau of Standards, 1999 Thornton, J, 2002 UK Water Industry, UK Water Industry, UK Water Industry, UK Water Industry, UK Water Industry, UK Water Industry, UK Water Industry, UK Water Industry, UK Water Industry, Water. Leakage Control Policy and Practice. 1997/98 Report on leakage and water efficiency Benchmarking Leakage from Water Reticulation Systems in South Africa. An Evaluation of Non-Revenue Water in South Africa. Code of Practice for the management of potable water in distribution systems. SABS 0306 Water loss Control Manual Managing Leakage, Report A: Summary Report Managing Leakage, Report B: Reporting Comparative Leakage Performance Managing Leakage, Report C: Setting Economic Leakage Targets Managing Leakage, Report D: Estimating Unmeasured Water Delivered Managing Leakage, Report E: Interpreting Measured Night Flows Managing Leakage, Report F: Using Night Flow Data Managing Leakage, Report G: Managing Water Pressure Managing Leakage, Report H: Dealing with Customer s Leakage Managing Leakage, Report J: Leakage management Techniques, Technology and Training OFWAT ISBN Paper presented at the 2004 Biennial Water Institute of South Africa Conference, ICC, Cape Town, 3-5 May Paper presented at the Water Institute of South Africa Biennial Conference, Durban ICC, 22 to 25 May SABS, Private Bag X191, Pretoria, South Africa. ISBN McGraw Hill or through ISBN the American Water Works Association. UK Water Industry ISBN: UK Water Industry ISBN: UK Water Industry ISBN: UK Water Industry ISBN: UK Water Industry ISBN: UK Water Industry ISBN: UK Water Industry ISBN: UK Water Industry ISBN: UK Water Industry ISBN:
55 Authors Title Publisher Reference Waldron, T, 2001 Managing and reducing losses from Water Distribution Systems : Manual 1 - Introduction Queensland Environmental Protection Agency & Wide Bay Water. ISBN Waldron, T Managing and reducing losses from Water Distribution Systems : Manual 2 Water Audits Queensland Environmental Protection Agency & Wide Bay Water. ISBN Waldron, T Managing and reducing losses from Water Distribution Systems : Manual 3 The Economics of Water Loss Management Queensland Environmental Protection Agency & Wide Bay Water. ISBN Waldron, T Waldron, T Managing and reducing losses from Water Distribution Systems : Manual 4 Establishing Pressure Management Zones and District Metered Areas: The Toolkit Managing and reducing losses from Water Distribution Systems : Manual 5 Advanced Pressure Management and PRV Selection Queensland Environmental Protection Agency & Wide Bay Water. Queensland Environmental Protection Agency & Wide Bay Water. ISBN ISBN Waldron, T Managing and reducing losses from Water Distribution Systems : Manual 6 Real Loss Management Queensland Environmental Protection Agency & Wide Bay Water. ISBN Waldron, T Managing and reducing losses from Water Distribution Systems : Manual 7 Managing Apparent Losses Queensland Environmental Protection Agency & Wide Bay Water. ISBN Waldron, T Managing and reducing losses from Water Distribution Systems : Manual 8 Case Studies in Water Loss Management Queensland Environmental Protection Agency & Wide Bay Water. ISBN Waldron, T Managing and reducing losses from Water Distribution Systems : Manual 9 Rural Water Loss Management Queensland Environmental Protection Agency & Wide Bay Water. ISBN X Waldron, T Managing and reducing losses from Water Distribution Systems : Manual 10 Executive Summary Queensland Environmental Protection Agency & Wide Bay Water. ISBN
56 Authors Title Publisher Reference Water Research Commission, 1999 Water Research Commission, 2001 Water Research Commission, 2002 Water Research Commission, 2002 Development of a standardised approach to evaluate burst and background losses in potable water distribution systems: SANFLOW User Guide Development of a pragmatic approach to evaluate the potential savings from pressure management in potable water distribution systems - PRESMAC User Guide. Leakage Reduction through Pressure Management in South Africa: Concepts and Case Studies. Development of a simple and pragmatic approach to benchmark real losses in potable was distribution systems in South Africa: BENCHLEAK Report TT 109/99 to the WRC by R Mckenzie Report TT 152/01 to the WRC by R Mckenzie Report TT 186/02 to the South African Water Research Commission by R Wegelin, W and Mckenzie, R Report TT159/01 to the WRC by Mckenzie, R and Lambert, AO. ISBN ISBN ISBN ISBN: Water Research Commission, 2002 ECONOLEAK: Model to evaluate the most appropriate frequency for undertaking Active Leakage Control Report TT169/02 to the WRC by Mckenzie, R and Lambert, AO. ISBN: Water Research Commission, 2005 Water Research Commission, 2007 Benchmarking of Leakage from Water Reticulation Systems in South Africa. An Assessment of Non-Revenue Water in South Africa. Report TT 244/05 to the South African Water Research Commission by Mckenzie, R and Seago, C, Report TT 300/07 to the South African Water Research Commission by Mckenzie, R and Seago, C, ISBN: ISBN Water Research Commission, 2009 AQUALITE Water Audit Model: User Guide. Report TT 315/07 to the South African Water Research Commission by Mckenzie, R. ISBN: Water Research Commission, 2010 Municipal WDM Balanced Scorecard: User Guide Report TT 523/12 to the South African Water Research Commission by Mckenzie, R. ISBN: Water Research Commission, 2013 The State of Non-Revenue Water in South Africa Report TT 522/12 to the South African Water Research Commission by Mckenzie, R Wegelin, W and Siqalaba, Z. ISBN:
57 Authors Title Publisher Reference Water Resources Group 2030 Managing Water Use in Scarce Environments: A catalogue of case studies Published by the 2030 Water Resources Group Wegelin W, & Mckenzie, RS.,(2005) Water Services Association of Australia Vickers, A Sebokeng/Evaton Pressure Leakage Reduction: Public Private Partnership. Water Reticulation Code of Australia: WSA Handbook of Water Use and Conservation Proceedings from the International Water Association Specialist Conference: Leakage 2005, Halifax, Nova Scotia, Canada. pp September Available from Water Services Association of Australia Inc, 469 Latrobe Street, Melbourne, Victoria 3000, Australia Available from WaterPlow Press, PO Box 2475, Amherst, MA , USA. ISBN ISBN Some useful websites Organisation or Company American Water Works Association Web Site 40 Details of Site American based web site with details of useful publications and information on all aspects of water supply including considerable information and publications on water conservation. Aqualoc Australian based company providing flow restricting devices for taps. Con-Serv Australian based company providing flow restricting devices for taps and low flow shower heads. Caroma Australian based company providing low flow showerheads and dual flush toilets. Delrama Ltd Australian based company providing low flow showerheads. Department of Water Affairs and Forestry (South Africa) Environment Agency (United Kingdom) Useful site: can download the SA Water Services Act (No. 108 of 1997) and National Water Act (No. 36 of 1998). Useful web site containing many articles and reports, many of which can be downloaded free of charge. Also provides access to the Demand Management
58 Organisation or Company Web Site Details of Site Bulletin which is extremely useful and informative to anyone considering WDM initiatives. Enviroloo Ltd South African based company involved with the manufacture and distribution of waterless toilets. Ecosan Pty Ltd South African based company involved with the manufacture and distribution of waterless toilets. Flexispray Ltd Australian based company providing low flow showerheads. Gem Flow Ltd Australian based company providing flow restricting devices for taps. Interbath Ltd Australian based company providing low flow showerheads. Queensland Government Environmental Protection Agency Web site with large quantity of useful information on many aspects of the environment including considerable material on water conservation. Rand Water Largest supplier of potable water in Africa and joint sponsor of this manual RST Water Saving Details of low flow shower heads Systems Pty Ltd Save-a-Flush Pty Ltd UK based company specialising in the manufacture and distribution of toilet displacement devices. South African Water Research Commission South African Department of Water Affairs and Forestry Government research organisation responsible for the development and distribution of many products to assist water suppliers in all aspects of water resource management, WDM and water quality issues. Web site containing information on many issues related to WDM including the government s policy document as well as various water acts etc. Technolog Ltd. UK based company specialising in pressure management controllers, loggers and remote logging equipment. United Nations Centre for Human Settlements Waterless Advantage Pty Ltd South African based company involved with the manufacture and distribution of waterless urinals Australian based web site providing information and publications on various water supply and WDM related issues. 41
59 Organisation or Company Water Services Association of Australia 2030 Water Resources Group Web Site Details of Site Australian based web site providing details of the Water Conservation 5A Rating and Labelling Scheme managed by the WSAA. USA based NGO WRP Pty Ltd South African based consultant specialising in Water Conservation and WDM plus training in all aspects of WDM 42
60 4 APPENDIX A: BURST AND BACKGROUND LEAKAGE 4.1 Understanding leakage Before embarking on any major WDM initiative, it is first necessary to understand the problem to ensure that the interventions being proposed are appropriate and cost effective. With regard to physical leakage (often referred to as real losses), there are 3 main sources of leakage namely: Background leakage Burst leakage on mains and connections Internal plumbing leakage inside the properties It is important to understand the differences between the three main sources of leakage to ensure that the proposed interventions will address the problem and provide real savings Background leakage Background leaks are basically very small leaks that tend to run unnoticed, sometimes for years and may not create any problems until they eventually grow into larger leaks at which point they are called bursts. Every water-supply system will have some level of background leakage and it is impossible to completely eliminate such leakage as the leaks are so small (see Figure 22) that they are virtually impossible to detect. Even if the background leaks could somehow be detected, it would not be cost effective to repair them since the costs involved would be magnitudes higher than the value of the water that would be saved. It is, however, important to appreciate that such leakage will always exist in every water reticulation network and that although each leak may in itself be very small; if the system has many hundreds or thousands of such leaks they can sometimes represent a significant loss of water to the municipality. Although background leakage can never be eliminated completely, it can be controlled to some extent through pressure management or as a last resort by pipe replacement. Replacing the pipes is usually the most expensive option to be considered and should generally be considered as a last resort. 43

61 Figure 22: Typical background leak Burst leakage Most leaks tend to start off as small background leaks which grow over time until they are large enough to be considered as burst leaks. The normally accepted definition of burst leakage is that they are over 250 litres/hr which was initially selected because this was the typical level at which such leaks could be detected using normal leak detection equipment. With more modern equipment, however, it is possible to identify leaks which are less than 250 litres/hr and so the actual limit at which a leak is considered to become a burst has become a rather academic point. Basically burst leakage can be thought off as any leak that is large enough to be detected and economically viable to detect and repair. As the value of water increases, the limit at which a background leak becomes a burst leak may well reduce since it will become cost effective to search for and repair smaller leaks. Burst leakage occurs on both mains and connections. Such leaks on mains tend to be spectacular and can range in size from below 2 m 3 /hr to more than m 3 /hr although the average mains leak is likely to be between 2 m 3 /hr to 4 m 3 /hr Internal plumbing leakage In most countries around the world, internal plumbing leakage is the problem of the householder and not the water utility. In South Africa, however, this is not the case due to Free Basic Water and the fact that municipalities will not cut off water to households, particularly in medium- to low-income areas. In such areas, the internal plumbing leakage 44
62 can often be high and in extreme cases may dominate the water use in the area. For this reason, internal plumbing leakage is one of the key problems facing municipalities throughout the country. Normal household water use in a medium-sized property with a garden and some grass that is occasionally watered should be around 30 m 3 /month. In cases of smaller properties without any garden watering, the monthly consumption tends to average at around 12 m 3 /month. In cases where internal plumbing leakage is a problem, the average figure can increase to above 50 m 3 /month with some individual properties using more than 200 m 3 /month. These figures are rough estimates which are provided to give some idea of how much water a specific area should be using every month and it is surprising to find that the 12 m 3 /month ties in very well with the water used in similar sized properties in Sao Paulo in Brazil (personal communication Francisco Paracampos: SABESP). 4.2 Where is the leakage? Identifying burst leakage is usually quite simple and straightforward, especially if the leaks come to the surface where they can be easily spotted by visual inspection. If the leaks do not surface, it is more difficult to quantify the level of leakage in the area and to know if the main source of leakage is background leakage, burst leakage or internal plumbing leakage. Many municipalities struggle to identify the main source of leakage and can waste money on actions that are neither needed nor cost effective. It is very important to know the main source of leakage before trying to fix it and to assist in this dilemma there are a few simple checks that can be undertaken. The water supply to a typical household is shown in Figure 23 from which it can be seen that there is a water main connected to a household supply pipe which in turn supplies the pipes inside the property. Various fittings are connected to the water supply pipes inside the house and there are some connections from the basins, baths, showers and toilets to the sewer network which take way the dirty or leaking water. 45

63 Figure 23: Typical Household pipework When identifying the source of the leakage, the following issues should be considered: Most burst leakage will find its way into the stormwater system and/or a natural stream or river. This applies to both large mains bursts and the more common connection bursts on the connection pipe between the main and the consumer meter. It is often useful to monitor any unusual flow of water in a stormwater sewer or culvert/stream, particularly during the dry season when there should be little or no flow of water at that time. Burst leakage on the connection pipe after the consumer meter is on private property and will often cause a wet patch on the private property which can run undetected for many months if it is not causing any inconvenience. This leakage tends to run into the soil and may not find its way into either the sewer or stormwater system. Such leaks are difficult to detect and the only means of detection is through inspection of the water meter at the property which will run continuously, even when the customer is not using any water checking the meters at night-time is an excellent way of picking up such leakage, however, the leak may be inside the property (plumbing leakage) or on the connection pipe. 46
64 Internal plumbing leakage will usually result in high sewer flows. In areas where internal plumbing leakage is a serious problem, the sewer flows will be very high at night -time and the sewage entering the treatment plant at night may be crystal clear in cases of extreme plumbing leakage. This is a serious issue in parts of South Africa where the internal plumbing fittings are sub-standard and payment levels for water are very low. Background leakage is difficult to quantify and is normally determined from the analyses of the minimum night flow (see Section 5.2 in Appendix B). Such leakage rarely enters either the sewers or stormwater since the individual leaks are so small. The leakage usually disappears into the surrounding soil. 4.3 Active and passive leakage control Passive leakage control (PLC) is the process of repairing leaks once they have been reported while active leakage control (ALC) is the more complicated process of investigating an area in order to identify leaks that have not been reported. Internationally ALC is considered to be one of the most important interventions of water loss control and is a multibillion dollar business worldwide. Many companies manufacture and sell leak location equipment designed specifically to find leaks that are not obvious from visual inspection. Such leaks can run undetected for months if not years in some cases and the volumes of water lost through such leaks can be enormous. Many international presenters start their presentations by explaining that 90% of all leaks do not appear on the surface and thereby suggest that ALC is essential in all cases. While this figure of 90% may be appropriate in some parts of the world, it is not the case in most parts of Southern Africa. To understand why some leaks come to the surface and others remain below ground and effectively invisible from surface inspection, it is necessary to consider several factors. The most important factor is possibly the depth at which the pipe has been buried. If the pipe has been laid 2m below the ground surface, there is less chance of a leak surfacing compared to a pipe that is buried only 1m below the surface. In many countries, particularly in the northern hemisphere, pipes are laid 2m or more below the surface in order to escape the effects of the frost and long winters where temperatures can remain below freezing for months at a time. In most developing countries, such extreme low temperatures are uncommon and pipes tend to be laid at only 1m below the surface and sometimes even less. It is therefore to be expected that leaks will tend to come to the surface in countries where the pipes are close to the surface. Other considerations are of course, the soil type as well as the average system 47
65 operating pressure. If the water pressure is high, there will be greater chance of a leak surfacing than in cases where the system pressures are very low. In South Africa, the system pressures are high and the pipes are shallow with the result that more leaks reach the surface and can be identified from visual inspection. Another important consideration concerns areas which are at or near sea level with the result that the groundwater is close to the surface. In such areas, even if a leak will come to the surface, it may be confused with normal groundwater and therefore be difficult to detect from visual inspection. From several case studies undertaken in South Africa, it appears that in most areas, the leaks do in fact come to the surface and are therefore visible. Obviously some leaks will not come to the surface and the only way of identifying these leaks is to search for them using some form of leak location equipment. The actual split between leaks that are visible on the surface and other leaks that are not visible is a debatable point and will vary from area to area. It is the view of the author that in South Africa the split is likely to be more towards visible leaks unless the area is dolomitic in which case, the leaks will not surface in most cases. Undertaking ALC does not solve the problem, and in all cases the municipality must still ensure that all leaks reported or detected are repaired quickly and effectively. A municipality that has a proper and efficient PLC process in place can drive leakage down to acceptable levels while a municipality undertaking ALC on a regular basis but does not repair the leaks quickly or properly may have a serious leakage problem. At the very least, a municipality should ensure that all visible and reported leaks are repaired quickly (target should be within 24 hours) and effectively. ALC is cost effective in some cases, but should not be undertaken in a blanket fashion but rather in a targeted fashion where specific problem areas are first identified (e.g. minimum night flow analyses) after which they should be prioritised for investigation and finally investigated when appropriate. There are far too many cases where municipalities buy expensive leak location equipment that gathers dust in some office or store room especially at financial year end when budgets must be used or lost. If money must be spent, then rather buy some loggers or meters to monitor or measure what is going on in the system and only purchase leak location equipment if it is to be used. 4.4 Implementing active leakage control As mentioned previously, ALC is the proactive approach of sending leak detection and repair teams into areas to search for and repair unreported bursts. The procedure for active 48
66 leakage control normally involves a series of steps which include, but is not limited to, the following: Administration and set-up costs Manpower inspection costs Supervision costs Mains repair costs Connection repair costs Various other small costs Passive leakage control, as the name implies, involves the passive approach of waiting for leaks to be reported after which the leak repair teams are dispatched to locate and repair reported bursts. This approach is considerably cheaper to operate and manage compared to the approach of active leakage control. It can, however, also result in many unreported bursts running for many months, if not years, before they grow to such an extent that they are finally reported. Reports of relatively large leaks running undetected for many years are common in most water utilities. While PLC is clearly not ideal from the viewpoint of reducing leakage, the key issue is to determine whether it is more cost effective to use teams of plumbers to detect and repair leaks or simply to react to customer complaints when the leaks become so large that they are reported. This is effectively the question answered by the ECONOLEAK Model which attempts to provide an indication of how often the leak detection and repair teams should visit a particular water supply system. In some instances, it is cost effective to investigate a system every 6 months, while in other instances it may not be cost effective to carry out such investigations more frequently than every two years. The ECONOLEAK model considers active leakage control intervals at every 6, 12 and 24 months which should be sufficient for most systems in South Africa. If it is found that the model suggests implementing active leakage control at some interval outside the 6- to 24-month range, then there is likely to be some other factor dominating the calculation such as the cost of water which may be outside the normal range. 4.5 Duration of reported and unreported bursts A key issue to be considered when addressing leakage concerns the length of time over which a leak will run. Obviously, reported bursts are identified and repaired much quicker 49
67 than the unreported bursts, but in both instances there is a clearly defined period over which the leak will run. Unfortunately, relatively few municipalities in South Africa collect and process the data that are necessary to estimate the average running time of the various leaks. For this reason, the default values suggested in the UK can always be used as a starting point for any municipality wishing to develop its own active leakage control strategy. In summary, the running time for any particular leak can be considered as the sum of three components namely: Awareness Location Repair The awareness time for a leak will depend upon the size of the leak, its visibility to the public and its impact on water users in the system. A serious leak that is highly visible and causes low water pressures to certain consumers will be brought to the attention of the water supplier within hours. A smaller leak, however, that causes no real problems and perhaps runs directly into a stormwater drain may run undetected for several days, months or even years. If no form of active leakage control is practised by the water supplier, such leaks can run indefinitely or until they become sufficiently large to draw some attention. The awareness time for a leak can vary considerably from system to system, and will also depend upon how diligent the consumers are with regard to reporting leaks. It is important to understand the issue of awareness, location and repair of leaks as it is generally assumed that large leaks will result in greater wastage than small leaks. For this reason, the repair of small leaks is often given a low priority. In many cases, however, this is not the case and the overall leakage from a small leak can exceed the water lost from a large leak. Consider a typical mains leak which will normally run at approximately 3 m 3 /hr or 72 m 3 /day as shown in Figure 24. This type of leak is normally highly visible and often causes low pressure problems to some consumers. As a result of the inconvenience caused, the leak is reported within a few hours and repaired as a priority in less than a day. This type of leak will typically run for approximately 1.1 days and result in leakage of ± 80 m 3. 50


68 Figure 24: Typical duration and loss through a mains leak Figure 25: Typical mains burst If, however, a relatively small leak develops on a connection pipe, which is by far the most common type of leak in all water reticulation systems, it will run at approximately 25 m 3 /day which is considerably less than the mains leak. In view of the fact that the leak may not cause such widespread disruption as the mains leak, it is not considered to be a high priority. It may also take a few days for the customer to notice the problem, after which it may take 51


69 several more days before the water supplier has sent out a team to find the leak and assess the situation. Furthermore, it may then take a few more days to dig up the water pipe and repair the leak. In total, it takes an average of 16 days from the time a connection leak occurs until it is repaired. This type of leak will typically result in losses of 400 m 3 as shown in Figure 26. Figure 26: Typical duration and loss through a connection leak Figure 27: Typical connection leak before the meter 52

70 If the leak occurs on the consumer s property after the meter, the situation can be even worse from a leakage viewpoint. In such cases as shown in Figure 28, the consumer may not pick up the leak for several weeks or even months. After identifying the leak, the location and repair may also take many days or weeks to complete, with the result that such leaks normally run for approximately 46 days. The water lost through such a leak will average out to approximately m 3 as shown in Figure 29. It is important to realise that the water lost through burst leakage is dependent on the awareness, location and repair times for the water supplier and the performance of different water suppliers can vary significantly, depending upon where they place their priorities. Figure 28: Property leak after the meter (Courtesy Niel Meyer) 53
71 75 Flow (m 3 /d) 25 A - awareness L - location R - repair Property Burst: m 3 46 days A L R Time (days) Figure 29: Typical duration and loss from a property leak In the UK, many water companies decided to repair leaks on customer s properties free-ofcharge rather than leave such leakage to the customer. Part of this strategy was based on the fact that many customers are not metered individually and such leaks result in a loss to the water company. In cases where the customer is charged for the water, the water supplier may decide that such leakage is not a priority issue since the water is being paid for and the water company is not losing any revenue as a result of the leak. In South Africa the situation is probably somewhere between the two extremes in that many water suppliers supply water to customers who either have no meters or pay a fixed tariff each month. In such cases, the water supplier may decide that it is in its best interests to locate and repair all leaks on the customer s property. In other cases, the water supplier may decide that such repairs will be the customer s problem. 4.6 Addressing visible leaks Visible leaks need no explanation and there is no excuse for not fixing them as a matter of priority. Municipalities that want to spend money on smart metering or expensive infrastructure cannot justify such expense if they do not first address visible leaks. Before considering any other intervention, the repair of visible leaks is without question one of the most cost-effective interventions that can be undertaken. On a cautionary note, however, it should be noted that by repairing all visible leaks, the system pressure will increase which, in turn, will encourage new bursts to occur. The losses through existing bursts will also increase as they will flow at a faster rate. If the underlying problem is due to excessive water pressure, then the pressure issue should be addressed simultaneously with the leak repairs. If the pressure is not managed, then the leaks will simply re-appears somewhere else in the network, and the overall leakage will simply revert back to its previous levels. 54
72 5 APPENDIX B: LOGGING AND MINIMUM NIGHT FLOW ANALYSIS 5.1 Importance of logging Logging of pressures and flows is one of the most important aspects of any WDM programme and one that is generally neglected if not ignored completely. In recent years, with the advent of GSM and GPRS based loggers it is now possible to capture and transmit logging information with relative ease. Such information, if used properly, can help water managers to manage their water distribution systems effectively and efficiently, and they can often identify problems before they become major crises. There is no substitute for reliable real-time flow and pressure information and where available, it will facilitate the analysis of minimum night flows which was the original foundation of any proper WDM programme. Over the years, more effort seems to have been placed on high-tech electronic solutions and software which eliminates the need to visit the site or to get one s hands dirty. Recording and analysing minimum night flows has, in fact, become less common as the new technology and software models eliminate the need for any such analyses. In reality, many water reticulation managers have lost the ability to properly manage their systems in many parts of South Africa and there is a real need to move back to the basics and start using logging results to monitor the water reticulation systems and to find problems. Reliable logging information provides a manager with realtime data on what is really happening in the system as opposed to what the hydraulic models say should be happening. In many instances, the modelled flows and pressures bear little resemblance to what is being measured on the ground. Such discrepancies are not a reflection on the software models that are used to design the reticulation systems since the results from such models are only as reliable as the information on which they are based. When the model results and reality diverge, the problem is most likely due to operational issues such as valves which are closed when they should be open or vice versa. In the remainder of this section, the value of real-time flow and pressure logging information will be discussed to highlight some of the common issues that will be found in most water reticulation systems. 5.2 Interpretation of minimum night flows This section explains how the minimum night flow in an area can be used to identify the possible leakage in an area as well as to help identify some of the more common operational problems. Before proceeding to interpret various logging results, it is useful to recap on the basic methodology for assessing the level of leakage in a zone from the analysis of the 55

73 measured minimum night flow. This is fully discussed in the original SANFLOW User Guide (WRC, 2001) and is not repeated in detail below. A basic summary of the approach is, however, provided to highlight the ease with which the minimum night flow can be assessed. The measurement of background night flows is one of the most important actions that can be taken to identify leakage problems. It is often possible to identify many problem issues by simply looking at the minimum night flow. The minimum night flow is usually found to occur sometime between midnight and 4 am when the consumption in the network is at its lowest. Figure 30 provides a typical plot of the flow entering a zone metered area. Figure 30: Typical flow logging for zone showing minimum night flow Having logged a zone meter in order to establish the minimum night flow, it is then necessary to figure out what it all means. The key issue is to establish whether or not the zone has a problem or if it is healthy and has no problems. In order to achieve this objective, a very simple and pragmatic approach was developed using the Burst and Background Estimate (BABE) methodology whuch was originally developed by the UK water industry to assist 56


74 managers in identifying and controlling leakage. In this approach, the minimum night flow is considered to consist of three main components namely : Normal legitimate night use Background losses Burst pipes This breakdown is shown in Figure 31 from which it can be seen that the normal use and background losses have been further divided into smaller components each of which can be estimated using some simple and basic assumptions that tend to be surprisingly close to what is found in the field. The bottom line is that the normal night use and background leakage can be estimated for any specific zone, and the burst leakage is the unknown variable that must be determined. After logging the flow into a zone for a few days or weeks, the component of night flow due to bursts can be determined by simply subtracting the background leakage and normal night use from the measured minimum night flow. Figure 31: Interpretation of the minimum night flow 57
75 5.2.1 Normal night use The expected legitimate water use in a zone cannot be measured accurately every evening since it comprises a large number of small users sometimes more than It is impractical to try and measure the use for each small user during the period of the minimum night flow analysis. Instead, the expected normal night use is estimated based on certain norms and variables that have been refined over the years through practical research around the world. For the purpose of the analysis of the minimum night flow, the expected normal night use is split into three components namely: Normal domestic night use mainly toilet flushing Small non-domestic night use such as hotels and garages etc. Larger users such as hospitals or factories etc. (recorded individually) Normal domestic night use Normal domestic night use represents the water used during the night in a household and is predominantly due to toilet use. Use of water for making coffee or tea represents a very small portion of the overall household use and is effectively ignored. In some areas of South Africa, garden watering or the filling of swimming pools may be of importance; however, in most cases such water use is minimal between the hours of 00:00 and 04:00 when the night-flow monitoring is undertaken. Experience in various parts of the world has shown that approximately 6% of the population are active during each hour and that the water used per toilet flush is in the order of 10 litres. The normal household night use is therefore easily estimated from the product of the active population and the average use per hour. Normal night use = 6% of population * 10 litres per hour This may seem over simplistic which is true, however, it usually provides a reasonable estimate of what to expect in an area and will most likely err slightly on the high side. It should be noted that in areas with high internal plumbing losses, the water being used at night in the households will be much higher than the estimated normal night use. If this is the 58
76 case, the analysis of the minimum night flow will suggest very high burst leakage much of which will in fact be internal household leakage. The purpose of the analysis is to identify if something is wrong and if the assessment shows that there is very high burst leakage, then it must first be checked if in fact the leakage is burst leakage or a combination of burst leakage and household leakage. Checking the sewer flows will often provide an indication of the household leakage Small non-domestic night use The small non-domestic night use is more difficult to evaluate and depends, to a large extent, on the type of businesses (if any) operating in the zone. The assessment is not ideally suited for industrial areas or residential areas which have a high component of industrial use at night. Although each small non-domestic user is metered individually it is again impractical to record each of the meters during the night flow exercise. Instead, the users are lumped into various categories and a typical night use is assumed for the group. For example, there may be several all-night garages or all-night cafes where the unit use is relatively small although when added together the total use may be significant. A range of typical night use values for various different commercial enterprises has been produced based on extensive studies undertaken overseas and some guidelines are provided in the SANFLOW user-guide Large non-domestic users In some zone metered areas, it is often found that there may be one or more large water consumers whose consumption can have a significant influence on the night flow analysis. In such cases it is necessary to meter such consumers individually to determine how much water has been used during the night flow exercise. Only one or two such consumers would reside within a specific zone and therefore they can easily be checked during the night to assess exactly how much water they consume during the period of minimum night flow. Consumers falling into this category would include airports, large hotels, breweries, swimming pools, etc Background leakage Background leakage is the cumulative leakage from all relatively small leaks in the reticulation system. Such leaks occur from valves, joints, hydrants, stop-taps, meters, dripping taps, toilet cisterns, roof tanks etc. Individually such leaks are generally uneconomic to find and repair with the result that background leakage is accepted as a fact of life in all water reticulation systems within certain limits. 59
77 In general, background leakage can be split into three main components namely: Background leakage from each km of mains Background leakage from each connection Background leakage from each property Background leakage from mains There will always be some background leakage from any distribution system, some of which occurs from the water mains. Small leaks often occur at the pipe joints or from small cracks or holes in the pipes and the magnitude of the leakage is dependent upon the condition of the infrastructure and of course the operating pressure. For the purpose of the assessment of the minimum night flow, all leakage parameters used in the calculation are based on a standard operating pressure of 50m. When assessing the expected level of background leakage from systems operating above or below this pressure, the calculated background leakage must simply be adjusted upwards if the pressure is greater than 50m and adjusted downwards if it is operating below 50m. The adjustment for pressure is fully discussed in the SANFLOW User Guide and is not repeated in this report. Typical background leakage rates for normal diameter water mains suggest average values of around 40 litres/km of mains per hour. A new pipeline may have lower leakage, sometimes even below 20 litres/km /hr while older pipelines can have much higher leakage rates of 100 litres/km /hr or even higher Background leakage from connections Poor workmanship coupled with general wear and tear often results in leaks from pipe connections. In general, we usually work on the basis of one pipe connection to each property although in many systems a single connection can sometimes be used to supply multiple properties. This issue has been discussed and debated at many venues and in the view of the author, it is appropriate to assume that the number of connections or equivalent connections is equal to the number of properties except in cases of apartments where the actual number of connections should be used. Connection leakage is considered as the leakage occurring from the connection at the water main to the water meter at the property or to the property boundary in cases where no meters exist. In most water distribution systems, the connection losses are often the major source of loss from the system. For most purposes, a value of 3 litres per property per hour can be used which will provide a reasonable estimate of the expected background property leakage. 60
78 5.2.8 Background leakage from properties The third and final component of background leakage used in the calculation reflects the property leakage for each property after the consumer meter as opposed to the previous component, which relates to leakage on the connection pipe before the customer meter. This component is intended to allow for some leakage on the pipe from the meter to the property and also some leakage inside the property. Under normal circumstances, an allowance of 1 litre/property per hours is appropriate. A common criticism of this component-based methodology is often raised concerning areas where the most significant source of leakage is from the plumbing fixtures inside the properties. This has been mentioned previously but as it is such an important issue it deserves further explanation. In South Africa, household leakage is often the most serious leakage issue in the zone and the household leakage can dominate the whole water balance and therefore also the minimum night flow. In such cases, the household leakage will not be close to 1 litre/property per hour but may be several hundred litres per property per hour. In such cases, all of the other components of the minimum night flow analysis are irrelevant and the analysis with suggest that there is a huge burst problem. On closer examination, it will be found that there is no sign of such high burst leakage and from experience, the individual looking at the analysis results will often be able to confirm that the problem is most likely inside the properties. In reality, this is not a difficult issue to identify and in cases where household leakage is found to be the problem, it will usually be so significant and clear cut that there is no question about where the problem lies Calculation of unexplained bursts Having measured or estimated the various components of normal night use and background night use, the two figures are added together and then subtracted from the measured minimum night flow. The difference is the unexplained losses that are attributable to either unreported bursts or to errors in the assumptions made during the calculation. To demonstrate the analysis of a minimum night flow using the Burst and Background Estimate procedures, it is easier to make use of a simple example. In this example a case will be used where the average zone night pressure is at 50m which is the base pressure where no pressure correction factors are required. The basic information required for the calculation is provided in Table 2 61
79 Table 2: Basic information needed for MNF analysis Description Value Length of mains m Number of connections 600 Number of properties 672 Estimated population Average zone night pressure (AZNP) 50 m Measured minimum night flow (MNF) 14.4 m 3 /h Background losses from mains 40 l/km/h Background losses from connections 3 l/connection/h Background losses from properties 1 l/connection /h % of population active during night flow exercise 6% Quantity of water used in toilet cistern 10 l Number of small non-domestic users 30 Average use for small non-domestic users 50 l/h Use by large non-domestic users 1.2 m 3 /h Table 2 also includes the various default parameters that are normally used to calculate the background leakage and the normal night use as mentioned previously. Having established the default loss parameters it is now possible to estimate both the normal night use and the background leakage. The respective calculations are provided in Table 3 and Table 4. Table 3: Estimate of normal night use Description Calculation Value Domestic night use l 1.8 m 3 /h Small non-domestic use 50 l/h 1.5 m 3 /h Large non-domestic use m 3 /h 1.2 m 3 /h Total normal night use 4.5 m3/h Table 4: Estimate of background leakage Description Calculation Value Mains losses l/km/h 0.37 m 3 /h Connection losses 3 l/connection/h 1.80 m 3 /h Property losses 1 l/property/h 0.67 m 3 /h Total background leakage at 50 m pressure 2.84 m 3 /h 62
80 Pressure correction factor (50/50) Total background leakage at 50 m pressure 2.84 m 3 /h It should be noted that a pressure correction factor is indicated in the above table. In the case of this example the operating pressure is known to be 50m, which is considered to be the standard pressure. At standard pressure, no pressure corrections are required and it can be seen that the pressure correction factor is calculated to be 1.0 (i.e. no change). The topic of pressure correction is discussed in the SANFLOW User Guide (WRC, 2001). Now that the two main night time water use components have been estimated, it is possible to calculate the difference between the measured minimum night flow and the expected legitimate night time use. Table 5 provides the calculation that identifies the level of unexplained leakage in the given zone metered area. Table 5: Estimate of burst leakage Description Value Expected background leakage 2.84 m 3 /h Expected normal night use 4.50 m 3 /h Total expected night use 7.34 m 3 /h Measured minimum night flow m 3 /h Unaccounted-for leakage ( ) 7.06 m 3 /h As can be seen from the table, it is estimated that in this example the unexplained leakage is in the order of 7 m 3 /h. The remainder of this Annexure is devoted to the interpretation of various real logging results to demonstrate the value of such information. 5.3 Calculation of unavoidable annual real losses (UARL) The procedure to estimate the unavoidable annual real losses (UARL) was developed by Lambert during the period of the International Water Association s Task Force on Water Losses. The methodology is described in a paper in AQUA (Lambert et. al., 1999) and basically involves estimating the unavoidable losses for three components of infrastructure, namely: Transmission and distribution mains (excluding service connections); 63
81 Service connections, mains to street/property boundary; Private underground pipe between street/property boundary and customer meter. In South Africa, the third of these components can normally be ignored since customer meters are located close to the edge of the street. The parameters used in the calculation of the losses are indicated in Table 6. From this table it can be seen that the one variable common to all elements is pressure. This is also the one variable that is normally excluded from most commonly used leakage performance indicators such as percentage, leakage per connection per year and leakage per km of mains per year, etc. Each of the elements in Table 6 can be allocated a value appropriate to infrastructure in good condition, operated in accordance with best practice, based on the analysis of data from numerous systems throughout the world. The results are provided in Table 7. The parameter values indicated in Table 7 include data for minimum background loss rates and typical burst frequencies for infrastructure in good condition, and for typical average flow rates of bursts and background leakage at 50m pressure. The average duration assumed for reported bursts is based on best practice worldwide. The average duration for unreported bursts is based on intensive active leakage control, approximating to night flow measurements once per month on highly sectorised water distribution systems. Table 6: Parameters required for calculation of UARL Component of Infrastructure Background Losses Reported Bursts Unreported bursts Mains Length Pressure Minimum loss rate/km* Number/year Pressure Average flow rate* Average duration Number/year Pressure Average flow rate Average duration Service connections to street/property line Number Pressure Minimum loss rate/conn* Number/year Pressure Average flow rate* Average duration Number/year Pressure Average flow rate Average duration Service connections after street/property line Length Pressure Minimum loss rate/km* Number/year Pressure Average flow rate* Average duration Number/year Pressure Average flow rate Average duration * These flow rates are initially specified at 50m pressure 64
82 Table 7: Parameter values used to calculate UARL Component of Infrastructure Background Losses Reported Bursts Mains 20 * /km.h bursts /km.yr at 12 m 3 /h per burst* average duration of 3 days Service connections to street/property line Unmetered service connections after street/property line 1.25* /conn.h 2.25/1000 connections.yr at 1.6 m 3 /h per burst* average duration of 8 days 0.50* /conn.h per 15m length 1.5/1000 connections.yr at 1.6 m 3 /h per burst* average duration of 9 days Unreported Bursts bursts /km.yr at 6 m 3 /h per burst* average duration of 50 days 0.75/1000 conn.yr at 1.6 m 3 /h per burst* average duration of 100 days 0.50/1000 conn.yr at 1.6 m 3 /h per burst* average duration of 101 days * These flow rates are initially specified at 50m pressure Assuming a simplified linear relationship between leakage rate and pressure, the components of UARL can be expressed in modular form, for ease of calculation, as shown in Table 8. Sensitivity testing shows that differences in assumptions for parameters used in the Bursts components have relatively little influence on the Total UARL values in the 5 th column of Table 8. Component of Infrastructure Table 8: Calculated components of UARL Background Losses Reported Bursts 65 Unreported Bursts Total UARL Units Mains l/km mains/day per m of pressure Service connections to street/property line Unmetered Service connections after street/property line l/connection/day / m of pressure l/km underground pipe/day/metre of pressure NOTE: the UARL losses from Unmetered Service Connections after the street/property line can be ignored in the South African context, as all customers are metered and these meters are located close to the street/property line. The losses from the service connections (main to meter) tend to dominate
83 the calculation of UARL in most parts of South Africa, except at low density of connections (less than 20 per km of mains). Based on the figures provided in Table 8, the calculation of the UARL can be expressed as follows: UARL = (18 * Lm * Nc + 25 * Lp) * P Where: UARL = Unavoidable annual real losses ( /day) Lm = Length of mains (km) Nc = Number of service connections (main to meter) Lp = Length of unmetered underground pipe from street edge to customer meters (km) P = Average operating pressure at average zone point (metres) Example: A system has 114 km of mains, service connections all located at the street property boundary edge and an average operating pressure of 50 m. UARL = (18 * * * 0) * 50 /day = /day = /day = m 3 /day = m 3 /year = 66 litres/connection/day 5.4 Calculating average zone pressure As pressure is a key parameter in modelling and understanding leakage, it is worthwhile to adopt a systematic approach to its calculation. The procedure is as follows: For each individual zone or sector, calculate the weighted average ground level; Near the centre of the zone, identify a convenient pressure measurement point which has the same weighted average ground level this is known as the average zone point (AZP); 66
84 Measure the pressure at the average zone point, and use this as the surrogate average pressure for the Zone. AZP pressures should be calculated as average 24-hour values; night pressures at the AZP point are known as AZNPs (average zone night pressures). For relatively small sectors with well-sized mains in good condition, with reliable information on average zone inlet pressure at a single inlet point, preliminary estimates of average pressure can be made as follows: Measure or estimate the average pressure at the Inlet Point to the zone or sector, and estimate the average zone pressure, taking into account the difference in datum levels between the Inlet Point and the AZP point, assuming no frictional loss. To obtain average pressure for aggregations of zones, calculate the weighted average value of pressure using (preferably) number of service connections in each zone. If a network analysis model is not available, the approach used in Section 5.5 should be followed. If a network analysis model is available, follow the approach in Section Average zone pressures where no models exist Calculate weighted average ground level for each sector Split the distribution system conceptually into sectors defined by pressure management zones or district metered areas; break the system down into the smallest areas for which average pressures may be required. Next, for each sector, superimpose a plan of the distribution system over a contour map, preferably with 2-metre intervals. Allocate to each contour band one of the following infrastructure parameters (parameters are in order of preference): Number of service connections; Number of hydrants; Length of mains. Whichever infrastructure parameter is selected, the weighted average ground level can then be calculated as shown in Table 9. 67
85 Table 9: Example calculation of weighted ground level Contour Band (m) Lower Limit Upper Limit Mid-Band Number of Service Connections Contour Band Mid Point * Number of Connections Totals Weighted Average Ground Level = 3907 / 357 = 10.9 m Measure or calculate average zone pressure Obtain the average pressure at the Average Zone Point in the following manner: Measurements over a period of one year; Preliminary estimate based on average inlet pressure adjusted for difference in ground levels between inlet point and AZP. Example: In the sector data in Table 9, the average inlet pressure at a service reservoir is 1.5m below the overflow level (which is 65m above sea level). The average inlet pressure is ( ) = 63.5m above sea level; The ground level at the AZP point is 10.9m above sea level; The average zone pressure is therefore estimated as ( ) = 43.6m. 68
86 5.5.3 Calculate weighted average pressure for aggregation of zones The weighted average pressure for sectors of a distribution system, consisting of aggregations of individual zones with different average pressures, is obtained by calculating a weighted average for all the zones. If possible, the number of service connections should be used as the weighting parameter (if not available, use length of mains or number of hydrants). An example calculation is shown in Table 10. Area Reference Table 10: Example calculation of weighted ground level Number of Service Connections Average Zone Pressure Number of service Connections * AZP A B C D E F G H I Weighted average pressure for the whole area = 419,122/6932 = 60.5 m 5.6 Calculating average zone pressure where a model exists Because each node of a network analysis model will normally have a number of properties, a datum ground level, and an average pressure value, it is relatively easy to calculate the weighted average pressure for all the nodes in the model (or any defined part of it). It is worthwhile, however, to ensure that a weighted average ground level and an AZP point are defined for each zone/sector, as these will occasionally be required for test measurement. 69
87 6 APPENDIX C: LIVE LOGGING OF BULK METERS In the previous section, the value of logging pressures and flows was discussed in which many examples were provided to highlight specific problems that can be identified through the accurate interpretation of the logging results. Most of these logging results are recorded at bulk management meters. Such management meters are not used to generate revenue for the municipality but are used to help in the management of the reticulation system. In order for bulk management meters to be useful, they must be properly designed and must record the flows accurately. Most management meters are located inside a meter chamber which records the flow entering a specific area. The issue of sectorising has already been discussed to highlight the need for proper zones to be established so that the bulk management meters can be used to monitor the minimum night flow entering an area from which the leakage can be estimated. Bulk management meters are not only used to analyse the minimum night flow, however, they are also used to monitor the day-to-day operation of a zone. Through the availability of low cost GSM and GPRS based loggers, it is now possible to identify problems almost immediately as they occur. The Internet has opened up a new medium for monitoring system flows, and water managers can now examine what is going on in their system from virtually anywhere that has access to Internet communication. This includes smart phones, ipads and other similar devices. The value of such information is best explained through the use of some real examples which have been taken from the City of Tshwane s real-time logging database. Figure 32 provides a graph taken directly from the City of Tshwane s real-time logging system, which shows the flow recorded at the New Eersterus PRV installation, which contains both a meter and a PRV. The flow at the meter indicates that a serious leak of approximately 30 m 3 /hr has developed between the 14 th and 15 th of December This leak was identified by the municipality within a day and took a further 2 days to find and one day to repair. It was an interesting leak in that it occurred in an area of open ground where a construction vehicle had accidently knocked over a hydrant which had broken and was leaking into the open ground. No damage had been caused and there was no evidence of this leak from the nearby road as the water was flowing directly into a small stream. Without the monitoring system in place, this leak would not have been identified for weeks if not months. After finding the source of the leak, it was quickly repaired and the minimum night flow returned to the levels prior to 14 December. 70


88 Figure 32: Zone with sudden rise in leakage (courtesy City of Tshwane) The second example, also from the City of Tshwane shows a leak of 40 m 3 /hr that developed between 4 th and 5 th April 2012 near the Nellmapius area as can be seen in Figure 33. In this case, the leak was identified from the real-time logging system and took almost a week to find the leak and complete the repair. It is important to appreciate that not all leaks create problems or are immediately visible. Figure 33: Zone with significant leakage (courtesy City of Tshwane) 71

89 This specific leak was caused by the end cap on a 150mm-diameter pipe being damaged by a contractor once again in an area of open field where the water from the leak ran into a stream. The contractor did not inform the municipality of the damage caused to the pipe and it would have run indefinitely had the municipality not been actively monitoring the flow into the area. The third example shown in Figure 34 was identified through an alarm from the logger as soon as the leak occurred. As can be seen this was an enormous leak of around m 3 /hr from a 300mm-diameter pipe which had completely failed at high pressure. Figure 34: Massive leak and subsequent repair (courtesy City of Tshwane) Managers at the City of Tshwane were in contact with the office personnel at the Ekangala local depot within minutes of the leak occurring. It was a difficult leak to isolate and repair but was repaired within hours of it occurring. This leak did cause serious damage to the surrounding area and would have been identified with or without the real-time monitoring system. The system does, however, provide a record of the leak from which the volume of water lost and time taken to find and repair the leak can be established. 72

90 Figure 35: Leak and repair in Attridgeville (courtesy City of Tshwane) The graph shown in Figure 35 highlights a leak that had been running for some time and was repaired on 7 July after which the minimum night flow dropped by about 50m 3 /hr. This is a very sizeable leak, but had not been reported and was eventually identified and repaired by Tshwane Water Department. It is important to appreciate that it is not only small leaks but also large leaks that can remain undetected for many days, weeks, months or even years. The logging result from another project where real-time logging has proved very beneficial and highly cost effective is shown in Figure 36. This logging result may at first glance seem very complicated, but is in fact the flow and pressure logging into a large industrial factory. The results clearly highlight the impact of tank filling where a pump switches on and off throughout the day which, in turn, creates large pressure variations throughout the network in the vicinity of the factory. Such fluctuations should be discouraged where possible through the introduction of a more consistent supply regime. 73
")

91 Figure 36: Logging result from large industry (courtesy Ekurhuleni Metro) Figure 37: Detailed logging result from large industry (courtesy Ekurhuleni Metro) 74
92 The graph shown in Figure 38 provides an example of a relatively small leak which had been running inside a townhouse complex for many months. The residents of the complex had approached the municipality for assistance regarding their monthly water bill which had been slowly increasing over a period of two years. After installing the logger at the water meter to the complex, it was clear that there was a serious leak on the system of almost 15m 3 /hr. Figure 38: Example of leak in townhouse complex (courtesy City of Tshwane) Within a weekthe leak had been found and repaired and the water consumption dropped back to normal levels with a minimum night flow of only 0.3 m 3 /hr as can be seen in Figure 39. This particular example highlights the benefits for such logging on bulk meters into large consumers in this case a townhouse complex with approximately 50 properties. It can be seen that there are two flow records on each graph one shown in pink and the other in green. This is typical of a combination meter where there are two water meters in a single housing and therefore the logger must record both meters. The pink flow record represents the flow through the main meter while the green line represents the flow through the low-flow by-pass meter. In Figure 38, it can be seen that virtually the full flow passes through the main meter which is due to the large leak. In Figure 39, it can be seen that the low-flow bypass mater is again functioning properly and taking up much of the flow during periods of lower demand. Another nice example demonstrating the value of continuous monitoring of the bulk water use into an industrial facility is shown in 75


93 Figure 40, which clearly highlights a leak running at approximately 2m 3 /hr. Without continuous monitoring, the industrial user would simply have received an abnormally large water account and would not have realised the extent of the leak which is quite clear from the graph. This leak represents a loss or rather an additional expense of almost R per month to the industrial user based on the current industrial water tariff of R12/m 3 as applicable in the supply area. Figure 39: Post repair graph for townhouse complex (courtesy City of Tshwane) 76
94 Figure 40: Bulk consumer leak (courtesy Ekurhuleni Metro) 77
95 7 APPENDIX D: DESIGN OF PRV AND METER INSTALLATIONS 7.1 Introduction When designing a PRV or meter installation, there are certain key issues that must always be considered and many others that will simply help to create an installation that will be easy to operate and maintain in future. Unfortunately the general practice in many parts of South Africa is to award tenders for the design, construction and commissioning of an installation based on price, which invariably leads to a poor design and, in some cases, designs which are simply not functional. Although this section is aimed mainly at the design of bulk management meter installations, it is often worthwhile to consider whether or not a PRV may be used to control the pressure in the zone at some point in future. If such pressure management is a possibility, then it can often be worthwhile to design the installation in such a manner that it can accommodate a PRV in future. This will obviously have certain financial implications since the installation will be larger and therefore more expensive; however, it will be much cheaper than building a 2 nd installation at a later date and trying to cut in a new PRV. If the pipework is already designed to allow for the future installation of a PRV, it will be a relatively simple operation to install the PRV when necessary. When designing any installation, whether it is for a meter or a PRV, or both, there are a few items to consider namely: What type of meter will be used; Will a PRV be installed either as part of the installation or later; What type of isolating valves will be used; Is a by-pass required? Are air-valves required? Are thrust blocks required? Should the chamber be watertight or not? Are strainers required? 7.2 Basic dimensions of the chamber When designing a meter or PRV chamber it is important to allow sufficient space inside the chamber to assemble the various components and to allow for maintenance. Ideally, 78
96 headroom of over 1.8m should be provided to allow those servicing the fittings or monitoring the installation to stand upright. In addition, there should always be sufficient clearance between the walls and floors from the pipework to allow the use of a spanner without hitting the chamber. In cases where a strainer is used, care should be taken to ensure that the strainer itself can be replaced. Many chambers exist where the strainer is almost tight against the floor which creates problems when it must be cleaned or replaced. As a general rule of thumb, it is recommended that there is clearance of at least 300mm in each direction from any part of the pipework to the walls or floor of the chamber. Where possible the chamber should protrude above the surrounding ground to prevent water flowing into the chamber during a storm. Ventilation should be provided to prevent the build-up of potentially toxic gasses at the bottom of the chamber as these can be lethal and in some cases such gases have no smell. Unfortunately, providing ventilation ducts in some parts of South Africa creates unwanted access to the chamber and some municipalities tend to seal the chambers completely with thick concrete slabs. In such cases, care must be taken when entering the chamber to ensure that there are no toxic gasses, and the maintenance team should always involve more than one person. 7.3 Management meters When selecting the appropriate meters for a new installation, every water-supply manager will have their own preference based on their experience and knowledge of their system. There is no simple answer to this question, and what is appropriate for some installations may well not be appropriate for others. A full and very comprehensive description of flow metering is provided in the WRC publication by Van Zyl (2011) and such detail is not repeated in this chapter. A few practical issues, however, are discussed which are worth noting based on practical experience gained from the assessment of various meter and PRV installations from many parts of the world. When selecting the type of meters to use, several issues must be considered described in more detail below. Magnetic flow meters tend to be more accurate than mechanical meters although they are generally more expensive especially on the smaller sized meters below 300mm. On the larger sizes, the magnetic flow meters can become cheaper than large mechanical meters, and in many networks there is often a combination of mechanical meters on the smaller pipes and magnetic flow meters on the larger pipes. There are various requirements regarding the length of straight pipe before and after each type of meter and the supplier will provide details of these requirements for each meter. On paper, there is often little doubt that magnetic flow meters are the better option, even when dealing with some of the smaller sizes. The reality of the situation, however, is often quite different due to the fact that the 79
97 magnetic flow meters use some form of power supply either mains or battery operated. In both cases, the power supply can be vandalised or stolen. In South Africa and many other parts of the world, the issues of theft and vandalism sometimes result in the use of mechanical meters just to ensure that there is some form of metering in place. Mechanical meters are more susceptible to water quality problems and a strainer is always recommended which should be placed before the meter. The meter must always be placed after the strainer and before the PRV (if any). The length of straight pipe before and after the meter should be sized in accordance with the meter manufacturer s recommendations and the meter should be placed horizontally unless the meter manufacturer specifies otherwise. Mechanical meters will slow down with age and become less accurate with the result that they must be replaced or re-calibrated at regular intervals often every few years. In cases where a network has been drained and the water supply is re-instated, great care must be taken to recharge the system slowly or there is a risk that the sudden supply of water to the empty network will damage the mechanical meter. Magnetic flow meters are less sensitive to such issues although they can be at risk from lightning strikes which have little effect on the mechanical meters. 7.4 Strainers Strainers are often seen as a nuisance as they can become blocked with dirt and stones and must then be opened up and cleaned. For this reason, many water suppliers prefer not to include them in their installations because they just create problems. Unfortunately, they are essential and should be included in any meter or PRV installation to trap dirt and foreign objects that have managed to get into the pipework. The strainer is effectively a protection device to prevent the meter and/or PRV from being damaged should a stone or foreign object get into the pipeline. 80

98 Figure 41: Typical strainer before a PRV In the case of a magnetic flow meter, a strainer may not be necessary since there are no moving parts that can be damaged by foreign objects. If there is any possibility of installing a PRV downstream of the meter, however, it is always advisable to include a strainer in the installation. There are a number of different designs of strainers and the size of hole in the mesh should be carefully considered. If it is too small, it may create too much resistance to the flow of water in the pipe and in extreme cases can be ripped out of the body of the strainer fitting and itself become a foreign object see Figure 42. If the holes in the strainer are too large, they may allow small stones to pass through the strainer which are large enough to cause damage to the downstream valves and or meters. A properly sized and designed strainer will provide the protection required without compromising the flow through the installation. Sometimes, the strainers will catch only small pieces of rust and pipe lining while in other cases they may catch some serious stones which would cause significant damage to the downstream valves and meters as shown in Figure


99 Figure 42: Damaged strainer due to small hole diameter and very high flows Figure 43: Some rocks caught by strainer 82

100 Where possible, strainers should be fitted with quick-fit pressure measurement couplings (see Figure 44) front and back to allow the pressure drop through the strainer to be checked during normal maintenance procedures. If the strainer is blocked, there will be a significant pressure drop through the strainer which should then be opened up and thoroughly cleaned. The installation shown in Figure 44 also shows that the strainer must be a sufficient distance from the floor of the chamber to enable the strainer to be extracted for cleaning in such cases where the strainer must be removed from the bottom. Figure 44: Typical strainer in PRV chamber under construction 7.5 Air valves Air in pipelines can create serious problems and if there are no air valves in the pipeline, it can lead to a serious burst pipe and in other cases where the pipeline is being drained; it can lead to the collapse of the pipeline if it experiences significant negative pressure. A typical air-valve installation is shown in Figure 45, which shows the air-valve located above the 83

101 collector pipe. It should be noted that the collector pipe is simply a section of larger diameter pipe sitting below the air-valve, which allows greater opportunity for any air in the pipeline to be captured. Without this section of larger diameter pipe, the air may be swept past the airvalve and will build up somewhere downstream of the valve and eventually create a burst pipe. Air-valves should always be open and the small gate valve shown just below the airvalve should only be closed to service the air-valve. Air-valves are an essential component of any reticulation system and must be in good working order at all times. Figure 45: Typical air-valve and collector pipe 84

102 7.6 Pressure relief valves Pressure relief valves are sometimes used in installations to protect against the failure of the main PRV. In the event that the main PRV fails, the pressure into a zone would normally increase and may cause serious damage. As protection against such failure, it is sometimes useful to include a pressure relief valve, which allows the excess pressure to dissipate at the installation before entering the network. There are a number of different design approaches to this as shown in Figure 46 and Figure 47. Figure 46: Typical pressure relief valve (without surface release) Figure 46 is not an ideal example since if the main PRV should fail; the emergency pressure relief valve will open up and immediately flood the chamber. On the positive side, it will prevent full system pressure from entering the zone and once the chamber has flooded, the water will start to appear above surface and will be reported by someone as a major leak. The example in Figure 47 is a better design in that the emergency pressure relief valve has been connected to a pipe which will take the water to the surface. In the event of a failure, the pressure relief valve will open up, and there will be a serious flow of water above ground 85
 7.")
103 that will also appear to most observers as a major leak. In both cases the pressure relief valve protects the downstream pipework in the event of the main PRV installation failing. Figure 47: Pressure relief valve with surface outlet (courtesy City of Tshwane) 7.7 By-passes Whether or not to include a by-pass is often a question of budget as well as the preference of the municipality. A by-pass is used to re-direct the water around the main installation in the event of maintenance being undertaken on the main installation or a leak developing somewhere on the main pipework. If a by-pass is not provided, the supply into the zone must be cut off whenever maintenance is provided. In some cases this is not a problem and the 86

104 occasional shut-off may not be a problem. In other cases, it may not be acceptable to cut off the water supply into the area due to certain key water users such as a hospital or some large industry. A by-pass is often used in these cases to provide a continuous supply even in the event of maintenance being undertaken on the installation. Figure 48 shows a typical small installation where it was not considered necessary to include a by-pass. Figure 48: Small installation without by-pass Figure 49 shows a typical design for a PRV installation which includes a service by-pass. Once again, there are many possible design options and much depends upon the available budget as the client s requirements. In the case of a PRV installation which has a service by- 87
105 pass (as opposed to a low-flow by-pass), some clients will insist that the by-pass is fitted with its own PRV and meter despite the fact that the by-pass will only ever be used for an hour or two every year. In cases, where the by-pass does not have its own PRV, care must be taken to ensure that full system pressure does not enter the zone during scheduled maintenance. Normally, the by-pass is significantly smaller in diameter than the main supply pipe, which will help to reduce the pressure into the zone during the maintenance work. If necessary, the flow through the by-pass can be throttled to some extent by only partially opening the gate valve on the by-pass. Using a gate valve to throttle flow is very poor practice and is not recommended; however, in an emergency it is preferable to supplying full pressure into a zone which could create bigger problems. 7.8 Puddle flanges Another important aspect of the design shown in Figure 49 is the use of the two Puddle Flanges which secure the pipework to the chamber walls and eliminate the need for thrust blocks in the chamber. This design is often used in cases where the chamber is constructed of reinforced concrete and would not be recommended in cases where brickwork is used. The puddle flanges provide a solid restraint for the pipework within the chamber which effectively eliminates the need for any thrust blocks inside the chamber since the whole chamber effectively becomes a large thrust block. For the pipework to move the whole chamber will have to move, and this form of construction is ideally suited to large installations. In addition, the installation shown in Figure 49 makes use of two dismantling joints, one on the main pipework just after the meter and the other on the by-pass. Such joints are not favoured by all municipalities, and it is important to ensure that they are strong enough to handle the upstream pressures. This is discussed further later in this section. 88

106 Figure 49: Typical PRV installation with service by-pass The actual installation as built from Figure 49 is shown in Figure 50. Due to the use of the puddle flanges the whole installation is effectively rigid and does not require any further thrust blocks. The installation will be completed by the inclusion of the missing air valve which has yet to be added and the various temporary supports will be replaced by permanent concrete blocks to provide basic support. 89

107 Figure 50: Actual installation shown in previous figure In some cases, it may not be possible or desirable to have the main pipework in line with the existing pipework, and the installation itself can be constructed on what would normally be considered the by-pass while the main line actually becomes the bypass. Such an installation is shown in Figure 51, which was designed to the municipality s requirements where they wanted to ensure that the main line could be re-instated sometime in future if needed without creating any additional head loss. This type of installation may be useful in cases where the future growth in the area is unknown and there is a possibility that sometime in the future, the full system pressure may be needed. Had the installation been based on the previous design shown in Figure 49, there would have been some head loss through the installation, even if the PRV was fully opened or removed completely due to the various restrictions in the pipework. 90

108 Figure 51: Alternative design where main line remains intact 7.9 Dismantling joints Dismantling joints are usually included in most installations to enable the components of the installation to be removed where necessary for replacement or maintenance purposes. Some clients do not like to use dismantling joints in such installations due to the possibility of the joint failing under extreme pressure conditions. In some parts of Johannesburg for example, the dismantling joints have been replaced by sections of welded pipe. In such cases, the pipe must be physically cut if any component is to be replaced after which the cut section must be re-welded. This is a very secure approach but does require the use of cutting and welding equipment when any components are being replaced. If a dismantling joint is used and it is not installed properly, then any small movement can result in the pipework jumping out of the joint and creating a serious leak in the chamber. To prevent this from happening, it is recommended that all dismantling joints used in such installations should be fully restrained as shown in Figure 52 and not simply the basic joints. Figure 52 shows a typical dismantling joint installed in a high pressure PRV installation. As can be seen, the connecting pipework has been designed with a welded flange which is bolted to the flange of the strainer once the coupling has been tightened. Once all of the restraining bolts have been tightened, this joint cannot move and there is little possibility of any problems while allowing for the installation to be dismantled in future if necessary. 91

109 Figure 52: Flange adaptor with restrained dismantling joint (bolts not tightened) While the restrained couplings are an acceptable design in any high pressure installation, the unrestrained couplings as shown in Figure 53 can create problems and should not be used. The example shown in the figure is in an area that experiences very high pressures and the by-pass has no other form of restraint at either end. When the water is directed through the by-pass, the pipework can move as the pressure attempts to push the joint open. If the joint has been poorly fitted, there is real danger that it can open up suddenly often with serious and potentially lethal consequences. It is therefore recommended that all dismantling joints used in high pressure installations should be fully restrained. In cases where the municipality opts to use the cut and weld approach, it is important to ensure that the weld inside the pipe does not rust as it will eventually become an area of weakness which can ultimately fail. Unfortunately, it is very difficult to prevent rusting of the joint inside the pipe and such joints will sometimes give problems. 92

110 Figure 53: installation with unrestrained coupling on by-pass 93

111 8 APPENDIX E: COST OF LEAKAGE There is often little or even no appreciation of the value of water being lost through leakage. Before discussing how to get the basics under control it is perhaps useful to highlight the true value of water that is lost through visible leaks. A few real examples are provided where logging results were used to confirm the actual volumes of water lost. For the purpose of this section a simplistic approach to the value or cost of water has been used, which it is acknowledged is not always applicable. The value of the water lost through the leak has been based on a unit cost of R5/m 3 which is a realistic 2013 bulk water cost in many parts of South Africa. It is however, less than half the normal commercial rate charged by most municipalities. Figure 54: Large mains leak on 600mm-diameter main at 260m pressure Value of water lost = ± 200m 3 /hr * ± 3hrs * R5 /m 3 = ± R The first leak shown in Figure 54 is from a high-pressure, large-diameter transmission main, which was running at a pressure of ± 260m. This specific leak had a very high flow rate of ± 200m 3 /hr and created a huge water feature which was obvious to all nearby residents. It 94

112 was immediately reported to the water authorities and the pipeline was closed within 3 hours to allow the repair to be undertaken. Despite the fact that this leak was very large and created an impressive spectacle which was documented in the local newspapers, the value of the water lost through the leak was a modest R Figure 55: Leak on 600mm-diameter main at pressure of 230m (courtesy N Meyer) Value of water lost = ± 300m 3 /hr * ± 4hrs * R5 /m 3 = ± R The leak shown in Figure 55 is from the same high pressure 600mm-diameter transmission main running at a pressure of ± 200m. This specific leak was caused by a construction team which damaged the top of the pipe with an excavator. This leak was measured from the logging results to be at a flow rate of ± 300m 3 /hr and it was stopped within 4 hours and subsequently repaired. 95

113 Figure 56: Leak on 110mm-diameter upvc main at ± 60m pressure Value of water lost = ± 20m 3 /hr * ± 3hrs * R5 /m 3 = ± R 300 The leak shown in Figure 56 is from a medium-sized water main of 110mm diameter on a plastic upvc pipe. This leak was highly visible and was immediately reported to the water supplier who reacted quickly to address the problem. The leak was repaired within 3 hours and the total volume of water lost was only ± 60m 3. Such leaks are often easily identified on the flow logging results for an area in cases where continuous logging is being maintained. Such logging results are useful in assessing both the magnitude of the leak as well as the total running time associated with the water loss. 96

114 Figure 57: Mains leak on 315mm-diameter upvc pipe at ± 50m pressure Value of water lost = ± 40m 3 /hr * ± 6hrs * R5 /m 3 = ± R The leak shown in Figure 57 is from a larger water main of 315mm-diameter on a plastic upvc pipe. The pressure within the reticulation system at this point was ± 50m, and it was estimated that the flow rate was ± 40m 3 /hr. Due to the fact that this leak occurred in the early hours of the morning it was not reported for over 3 hours and as such ran for just over 6 hours before being repaired. The water lost is valued at approximately R This example clearly highlights the importance of reporting and repairing leaks as quickly as possible. Just a 3-hour delay can result in the cost of the water losses doubling and if leaks are allowed to run for days, months or years, the financial consequences can be dramatic as the following examples will show. 97

115 Figure 58: Small connection leak on 25mm-diameter upvc pipe at ± 50m pressure Value of water lost = ± 1m 3 /hr * ± 3 months * R5 /m 3 = ± R The leak shown in Figure 58 is from a 25mm-diameter upvc connection pipe just before the meter. The pressure within the reticulation system at this point was ± 50m. This leak had a lower flow rate of only ± 1m 3 /hr, but was not reported by the home owner and ran unchecked for more than 3 months. Although the flow from this leak is relatively small compared to those shown previously, the total volume of water lost through the leak far exceeds that from any of the previous examples. This once again highlights the significance of the run-time of the leak and the need to encourage all water users to report all leaks to the water supplier. The water supplier, in turn, must ensure that systems are in place to facilitate the reporting of all leaks and of greater importance to make sure that all reported leaks are repaired quickly and effectively. It is normal practice for a water supplier to have a target time of 24 hours within 98

116 which to repair all reported leaks. If it is found that the average repair time is greater than 24 hours, it suggests that additional resources in the form of personnel and equipment may be required. Figure 59: Hidden connection pipe burst on 25mm upvc pipe at ± 60m pressure Value of water lost = ± 0.5m 3 /hr * ± 3 years * R5 /m 3 = ± R The leak shown in Figure 59 is a real example of a 25mm-diameter upvc connection pipe which was found to be leaking directly into a storm-water catch-pit. The pressure within the reticulation system at this point was ± 60m, and it was estimated that this leak had a flow rate of ± 0.5m 3 /hr. Although the leak was relatively small, it was estimated by the water supplier that this leak had been running for more than 3 years. This example once again highlights the importance of the leak run-time since despite the fact that the leak was the smallest of all leaks discussed in this section, the total volume of 99

117 water lost through this leak was by far the highest. In this case, the water supplier did not undertake active leakage control measures at regular intervals and, therefore, such leaks could theoretically run indefinitely since they were not causing any visual flooding and the home owner was unconcerned about a slight drop in water pressure. Figure 60: Leak on 63mm-diameter pipe that resulted in a R3.5 million loss The final example presented is another real example of a leak detected during the auditing of an industrial area in Gauteng. In this particular case, the industrial premises had a connection which was metered; however, the meter had been buried for years and was not captured on the billing system. The 63mm-diameter upvc connection pipe to a small block with two toilets had been damaged as shown in Figure 60 and was leaking at a measured rate (as logged) of 25m 3 /hr as can be seen in Figure 61. The volume recorded on the water meter which was 3 years old stood at over m 3 with a cost to the municipality of over R3 million. Had this water been sold to the industrial user, the cost would have been in excess of R6 million. 100

118 It was highly unfortunate that this leak flowed directly into a sewer as shown in Figure 61 and therefore created no damage or visible water feature with the result that it remained undetected for over 3 years. If the municipality had not undertaken water audits on all of its industrial consumers, this leak would most likely still be running. Figure 61: Leak on 50mm upvc supply before repair 101
119 Figure 62: Leak on 63mm upvc pipe flowing into stormwater manhole The logging results after the repair of this specific leak are shown in Figure 63, which clearly highlights the significance of what was a relatively large leak that ran for a very long period of time. The direct cost of the water to the municipality was in excess of R3 million over a 3- year period. In summary, it is essential that municipalities deal with leakage in their systems and appreciate the value of the water that can be lost through even a small leak which is left unattended for months if not years. This is one of the most important and basic duties of all water providers fix the visible leaks quickly even if they are considered to be small. A small leak running for a long period will almost certainly result in greater losses than a very large leak which is fixed within 24 hours. 102

120 Figure 63: Logging results on 50 mm upvc supply after repair Value of water lost = ± 24m 3 /hr * ± 3 years * R5 /m 3 = ±R It should be noted that the above calculation is based on the cost of water to the municipality and not the cost of water to the consumer, which would have been more than double if the sewage charge is also included. 103
121 9 APPENDIX F: VARIOUS FORMS OF ACTIVE LEAKAGE CONTROL Active leakage control (ALC) is a multi-billion dollar industry worldwide and there are many large companies that specialise in developing and manufacturing various types of equipment to find leaks. Despite the claims of the various manufacturers, there is no silver bullet for leak location and no single piece of equipment that will find all the leaks in a particular reticulation system. In all cases, the most important factor is the skill of the operator. A skilful operator using the least expensive listening rod will find more leaks than a poor operator using the most expensive and sophisticated equipment available. There are so many new devices now available that it is impossible to try and describe them all in this book. In order to provide a broad overview of active leakage control, the following items will be discussed: Eyes and ears Listening rods Leak-noise correlators Step testing Ground penetrating radar Noise loggers Latest hi-tech equipment A short description of each method is provided in the remainder of this section. 9.1 Eyes and ears Before buying any leak location equipment, the first action that should be taken to address physical leakage is to visit the area and simply drive or walk around the area to gain a feeling of what is going on. If leakage is a serious problem, it will usually be quite evident unless it is inside the properties. Just walking down a few streets in an area will usually provide a good indication of whether or not it is necessary to purchase leak location equipment. In many leak reduction projects reviewed by the author, the purchase of leak location equipment is often one of the first items on the agenda and it can involve some very expensive equipment. In many of the projects, the equipment is purchased and never used. There are many cupboards and store rooms full of unused leak location equipment, much of which has been purchased at financial year end as a means of utilising an agreed budget. While, the purchase of leak location equipment is not necessarily to be frowned upon, it is important that the appropriate equipment is purchased and that it is used to find leaks. 104
122 If the initial visual inspection highlights a large number of clearly visible leaks which are running without being repaired, rather fix them first and only after the obvious leaks have been eliminated, should effort be placed on looking for leaks that have not come to the surface. In this regard, many WDM specialists from around the world continually quote the fact that 90% of leaks do not come to the surface and suggest that if you can see 10 on the surface, then there are another 90 that are hidden and finding them will require some leak location equipment. While this breakdown of visible and invisible leaks may be appropriate in some parts of the world, it is not appropriate in most parts of South Africa. Dolomitic areas may be the exception, but in general, the split between visible leaks and invisible leaks is not 10 to 90 and in many cases appears to be virtually the opposite. This observation will draw considerable criticism especially from those selling leak location equipment. The only way of determining the split is to undertake a pilot study in a small area before embarking on a citywide leak location exercise. If the pilot project demonstrates that it is worthwhile searching for the hidden leaks then a full-scale leak location exercise can be initiated based on real information. To proceed with a full-scale project before checking the facts, may waste valuable resources. In all cases, identifying and repairing the clearly visible leaks is always worthwhile, and should be the first action undertaken in any WDM programme. It should always be borne in mind that fixing leaks in a reticulation system will result in the system pressure increasing which, in turn, will push up the leakage through any existing leaks and cause new leaks to form. Any large-scale leak location and repair project should therefore be undertaken together with some form of pressure management where the system pressures can be reduced if necessary as the leaks are repaired. If the pressure is not managed properly, the system leakage will quickly revert to pre-leak repair levels and no benefit will have been gained. 9.2 Sounding (listening sticks and geophones) Leaks make a noise as the water escapes through a hole or crack in the pipes, and it is this noise that leak detections teams search for in order to find the leaks. Some leaks make a loud noise which is relatively easy to find while others make only a slight noise which is not easy to find. The noise from the leak travels through the pipeline and can be picked up nearby using some form of listening device. On metal pipes the noise can sometimes be heard over 100m away while on plastic pipes it may disappear within a few meters, and cannot be picked up unless the observer is right on top of the leak. Large leaks often make less noise than smaller leaks and therefore the noise may not always reflect the magnitude of the leak creating it. 105

123 Before entering an area to search for leaks, it is first advisable to undertake some form of assessment to help identify areas where leaks are likely to occur. Monitoring the minimum night flow is an excellent approach as it tends to provide the real picture of what is going on in an area and can be used to quantify the likely leakage that will be found in the area. Similarly, Step Testing is also an excellent approach for identifying specific areas within a zone which have a leakage problem. Only after it has been established that there is a potential leakage problem in an area, should the Sounding exercise be undertaken. Sounding (see also Section 2.5) of a water distribution system is undertaken using a listening stick (Figure 64), which is placed against all valves and hydrants to detect noise emitting from possible leaks. The listening stick can be a simple stick with no smart electronic technology behind it or it can be a highly sophisticated electronic device that has many useful features to help the Leak Locator to find and pin-point the leaks. This approach will not identify the position of the leak but will normally indicate if there is a leak on a certain section of pipe. Figure 64: Basic Listening Rod Figure 65: Amplified Listening Rod A Geophone (Figure 65) is an amplified listening rod, which comprises a very sensitive microphone, an amplifier and headphones. Water leaks are detected by listening for noises made in pipelines caused by water escaping through the wall of the pipe. Usually there are two types of microphone. The first is a wand-type microphone (or listening stick as shown in Figure 65) to permit contact with fittings such as valves and hydrants. The second type is a more sophisticated (and expensive) ground microphone, which is moved along the ground or 106
124 road surface on top of the line of the pipe and is shown in Figure 66. The leak is pinpointed at the position of greatest noise intensity as detected by the ground microphone. Figure 66: Full ground microphone kit A simple Listening rod (Figure 64) with no electronics can cost as little as R1 000 or even less, depending on the make and quality. An Amplified Listening Rod can vary significantly in price, depending on the quality and the features provided. A high-quality unit without any special features will generally cost around R (Figure 65) and a more sophisticated unit with noise filters and extra bells and whistles can cost up to R (Figure 66). The 107
125 units are designed to pinpoint leaks as the unit is moved over the pipeline and the position of maximum noise will generally indicate the position of the leak (Figure 67). Figure 67: Finding leak with sounding rod 9.3 Leak noise correlation A leak noise correlator (Figure 68) is a device that can locate (pinpoint) the position of a leak to within a few centimetres by measuring, at two different locations on the pipe, the noise that arrives at these points having travelled along the pipe from the leak. Microphones or transducers are placed in contact with the pipeline (usually at fittings) on either side of the 108
126 leak. During the correlation scan, the leak noise will reach the closer transducer first and the signal is progressively delayed until the more remote transducer receives a similar leak noise. The time delay, the difference between the times that the leak noise reaches the two transducers, is measured, and the accurate position of the leak can be computed as shown in Figure 69. The leak noise correlator is used after the initial sweep has identified a suspected leak along a specific part of the main. Figure 68: Leak noise correlator (courtesy Seba) 109

127 Figure 69: Theory of leak noise correlation (courtesy Seba) 9.4 Step testing Step testing is an indirect method of locating leaks that involves the measurement of water flow in discrete areas. The flow in each discrete section is measured during the period of minimum night flow, when the water used by the consumers should be low. Sections of the zone are eliminated by closing the isolating valves while the minimum night flow is recorded continuously. If there is a substantial drop in the minimum night flow when a particular section of the zone is cut off, it suggests that there is a leakage problem in that area. The approach is shown in Figure 70, which indicates four steps from which it can be seen that there is a noticeable drop with steps 2 and 4 suggesting possible leakage in these areas. 110
128 Step Test between 1am & 3am :00:00 0:10:00 0:20:00 0:30:00 0:40:00 0:50:00 1:00:00 1:10:00 1:20:00 1:30:00 1:40:00 1:50:00 2:00:00 2:10:00 2:20:00 2:30:00 2:40:00 2:50:00 3:00:00 3:10:00 3:20:00 3:30:00 3:40:00 3:50:00 4:00:00 4:10:00 4:20:00 4:30:00 4:40:00 4:50:00 5:00:00 flow (litres/sec) S1 S2 S3 S4 time period (5 minute intervals) Figure 70: Results from a typical step-test (courtesy Tim Waldron) The concept of step testing is not restricted to actual exercises where sections of a network are taken out of service specifically to identify leakage. The concept can also be applied to any activity taking place within a zone where some section of the network is taken out of service even in cases where the activity is during normal demand periods. For example, Figure 71 provides the logging details for the inflow to a large industrial area in Ekurhuleni. A short section of pipe (about 200m) was isolated by closing two internal valves to allow the installation of a new water meter to a single industrial user during peak demand periods. It was only several days later, that the project manager for the construction noticed that there had been a sudden and highly significant drop of almost 350m 3 /hr into the area during the shut-off to the factory. On further investigation, it was found that the water used by the factory was generally not more than 5 m 3 /hr and that the remaining 345m 3 /hr could not be explained. It was traced back to an enormous leak on the specific section of pipeline that had been isolated and by replacing this section of pipe, the leakage of 345m 3 /hr was eliminated. This is a classic example demonstrating the concept of step-testing without actually undertaking an official step testing investigation during the period of minimum night flow. It is clearly worthwhile checking the impact of closing any part of a network on the flow into the network and it need not always be undertaken at night-time when the demand is at its lowest. 111

129 If accurate logging results are available, it is often possible to identify individual leaks on small sections of pipeline in cases where shut-offs are being undertaken for other reasons. It is therefore an excellent form of leak detection if the inflow to an area is logged continuously whenever any maintenance is being undertaken since the results can be analysed in the same manner as those from an official Step-Test. Obviously this form of unofficial step testing may not pick up small leaks as the influence of the leaks will often be masked by changes in the consumption, particularly in industrial areas where pumps can be switched on and off suddenly resulting in significant variations. It is, however, always worth checking as in some instances, the logging results can highlight significant leakage. Figure 71: Typical "shut-off" for industrial consumer 9.5 Ground penetrating radar Ground penetrating radar (Figure 72) operates on the principal of emitting a radar pulse through an antenna into the ground. This pulse is reflected back from the various interfaces in the ground. By moving an antenna slowly over the surface, a picture is built up of what is below the surface (Figure 73). The picture can be viewed on a monitor whilst scanning is in progress. The data can be recorded on tape for further analysis and record purposes. Water in the ground is particularly reflective to radar, which thus enables radar to be used to locate water in the ground. Further investigative work is then required to determine if the water is groundwater or leakage from pipelines. 112


130 Figure 72: Ground Penetrating Radar Figure 73 shows the image of a leak discovered by acoustic methods and confirmed by GPR. The additional water in the ground is very reflective to radar and shows up as the brighter blue and purple areas, with the main at the top, apparently rising and falling due to the compressed scale of the image. Figure 73: Typical GPR Image 113
 the selfcontained noise logging devices (see Figure 74) to various hydrants and valves throughout the water distribution system.")
131 9.6 Noise loggers Noise loggers are a relatively new and innovative technology that is rapidly being accepted by many large water suppliers. The basic approach involves attaching (magnetic) the selfcontained noise logging devices (see Figure 74) to various hydrants and valves throughout the water distribution system. The units each record any leakage noise during a predetermined period and the information can be captured remotely from a vehicle equipped with a receiver. In this manner the information from all of the noise loggers can be captured quickly and efficiently by one technician. After the information has been captured, it is processed using accompanying software, which provides an indication of the likelihood of a leak in the vicinity of each noise logger. Noise loggers are not used for pinpointing leaks, but rather for identifying areas where a leak is likely to be found. The location of the leak must again be determined using a correlator or amplified Listening Rod (Geophone). Figure 74: Noise logger (Courtesy S Hamilton) In most situations, it is found that there is no single technique, which will find all leaks in a system and the personnel using the equipment are often more important that the equipment 114

132 being used. The most effective approach for leak detection is often to make use of a combination of techniques. In most cases, this will involve a broad sweep of the area using sounding, GPR, step testing and sometimes noise loggers which are used in sets (see Figure 75. After the initial sweep is completed, the leak noise correlator and/or the ground microphone are the best techniques for pin-pointing the leaks. Figure 75: Typical set of Noise Loggers 115


133 Figure 76: Possible permanent installation of noise loggers (Courtesy: Seba) Figure 77: Typical employment of noise loggers (Courtesy S Hamilton) 116
134 Leak detection should not be regarded as a once-off exercise. Different size leaks emit different noise intensities. Small leaks generally emit a higher intensity of noise and are generally picked up first. Larger leaks may still be present. Once initial leak repairs have been undertaken, the area should be tested again to ensure that larger leaks have not been overlooked. The best approach for undertaking a leak detection exercise, especially in a central business district (CBD) area, is to make use of a combination of techniques. Some methods are better suited for a rough first time sweep of an area, while others can be used to pin-point the exact location of leaks. 9.7 Other advanced techniques New leak detection techniques are continuously being developed to meet the needs of this multi-billion dollar industry. The problems are becoming more difficult to solve through the greater use of plastic pipes which do not transmit the noise from the leak to the same extent as metal pipes. To overcome this problem, a number of relatively new products have been introduced into the growing leak detection market. While it is not possible to discuss every new product, a few of the more popular are mentioned below Smart Ball The smart ball, as the name suggests, is basically an electronic device which is encased in a protective wire ball which folds down into a small cylinder for the purpose of inserting and recovering from the pipeline. This device is inserted into a fully pressurised pipeline through a special fitting which is attached to a fire hydrant. Once inside the pipeline, the wire frame pops open to form a protective ball around the electronics and it rolls down the pipeline being pulled along by the flow of water. The device records its position as it moves along the pipeline and also records any noise it picks up along the way. Basically it identifies leaks as it passes them in the pipeline. At the end of the section of pipeline being examined, the ball is recovered using a net which is once again inserted through a valve or fire hydrant and the unit is pulled up in a similar manner to which it was inserted. Once recovered, the unit is interrogated from which the locations of any leaks picked up on route are identified. SmartBall is a free-swimming data acquisition system suitable for detecting leaks in fluid pipelines. The system consists of the following components: An aluminium sphere containing and acoustic sensor and other sensors, acoustic transponder, data processor, memory device and batteries. The sphere is enclosed in an open-cell foam ball. The purpose of the ball is two-fold: 117
.")
135 To ensure that the device travels silently through the pipeline, minimising apparatus noise and maximizing acoustic sensitivity. To allow the overall diameter of the device to be optimised for pipe diameter, in-line valve clearances, flow velocities and maximum pipe grade (slope). Above-ground tracking devices (SmartBall Receivers and acoustic sensors) which are used to track the progress of the ball through the pipe, by monitoring acoustic transmissions from the ball, with timing referenced to a GPS clock. Pressurised insertion equipment (see Figure 78) Pressurised retrieval equipment consisting of a net assembly and in-pipe video camera (see Figure 79) Figure 78: Smart Ball insertion equipment (courtesy S Hamilton) The current version of the SmartBall can operate for up to 15 hours in a water pipeline, depending on water temperature. The maximum length of pipeline that can be surveyed is determined by the flow rate in the line. For instance, with a flow rate of 1 m/s and a maximum operating life of 12 hours, the SmartBall can survey up to approximately 40km. The size of leak that can be detected is determined to some extent by the ambient noise frequency range and level within the pipe; however it is generally less than 0.5 l/min. The type of leak (weeping joint, pinhole) is not relevant. The on-board instrumentation allows the 118

136 velocity of the ball at all points along the survey route to be calculated during postprocessing. The on-board instrumentation allows the velocity of the ball at all points along the survey route to be calculated during post-processing. Thus, the location of any leaks can also be located. Because a cumulative error can occur using this method, the fact that the exact time that the ball passes the SmartBall receiver stations is known can be used to reduce this error. Hence, the leak location accuracy is a function (within 0.5%) of the distance between receiver locations. Figure 79: Smart Ball Retrieval equipment (Courtesy S Hamilton) 119

137 This device has received both good and bad reviews and, like every leak detection device, has its uses and its limitations Sahara and JD7 systems The Sahara and JD7 systems are both very similar and involve the use of a small camera/microphone mounted at the end of a probe which is inserted into a pipeline on a long umbilical cable. The probe is pulled along the pipeline by a small parachute which is pulled downstream by the flow of water in the pipeline. This form of leak location is relatively expensive and is best suited to work in relatively straight pipelines where deployments of up to 2km from a single insertion point are possible; other constraints may restrict the length that can be surveyed from each insertion point. Careful planning of the work will maximise the distance that can be surveyed. The Sahara and JD7 systems are deployed through a tapping made into the pipe (which must have a minimum internal bore of 50mm). Typically these insertion points may be airvalve connections, insertion flow meter tappings or special insertion points which have been created specifically for the purpose of leak location using such equipment. Figure 80: Concept of Sahara and JD7 leak location systems Since the equipment is inserted into the pipeline, care must be taken over sterilisation of the equipment and, in particular, the cable to prevent any possible contamination. The systems are designed to be used on live (pressurised) water mains with no disruption to customers. 120
138 Each survey team will consist of several operators who must be qualified to work within confined spaces and understand the equipment. The equipment inserted into the main is made from materials that are suitable for use in contact with drinking water schedule and relevant certification appended. All equipment is sterilised before insertion into the live main. 121

139 10 APPENDIX G: UNDERSTANDING LOGGING RESULTS The following logging results are provided to highlight the value of logging the flow and/or pressure into a zone metered area. Understanding and interpreting the results is a skill that is developed over time with practice and often allows the water manager to pick up problems before they become more serious. Description: The graph shows the pressure recorded at the critical point in a zone over a 3-day recording period. Interpretation: The zone exhibits a stable pressure profile with continuous 24-hour supply. The pressure pattern is typical of a residential zone with maximum pressure at night and minimum during the day. Max pressure is 50m and minimum pressure is around 30m. The maximum daily pressure appears to decrease as the week progresses which can often indicate a supply from a large reservoir which fills at weekends and gradually drops during week. There is no obvious pressure problem in this zone. 122
 is around 80 m 3 /hr.")
140 Description: The graph shows the flow into a zone over a 3- day recording period. Interpretation: The graph shows a stable supply pattern indicating continuous 24-hour supply. The graph suggests a typical demand pattern for a residential area with a morning and early evening peak. The minimum night flow (MNF) is around 80 m 3 /hr. The average daily flow (ADD) is around 150 m 3 /hr. The ratio of MNF to ADD is approximately 53% which without a detailed analysis of the MNF suggests high leakage. This zone has a serious leakage problem. 123

141 Description: The graph shows the flow into a zone over a 1- day recording period. This is in fact the same zone as used in previous example and is being presented to demonstrate that even a 1-day logging over 24-hours can be useful. Interpretation: The graph shows a stable supply pattern indicating continuous 24-hour supply. The graph suggests a typical demand pattern for a residential area with a morning and early evening peak. The minimum night flow (MNF) is around 80m 3 /hr. The average daily flow (ADD) is around 150m 3 /hr. The ratio of MNF to ADD is approximately 53% which without a detailed analysis of the MNF suggests high leakage. This zone has a serious leakage problem. 124
 is around 18m 3 /hr.")
142 Description: The graph shows the flow into a zone over an 8-day recording period. Interpretation: The graph shows a stable supply pattern indicating continuous 24-hour supply. The graph suggests a typical demand pattern for a residential area with a morning and early evening peak. The minimum night flow (MNF) is around 18m 3 /hr. The average daily flow (ADD) is around 70m 3 /hr. The ratio of MNF to ADD is approximately 25% which without a detailed analysis of the MNF suggests that there is substantial leakage, however, it is not particularly high and it is likely that there are other areas with a more serious problem. This zone has some leakage but it is not serious. 125
143 11 APPENDIX H: SOFTWARE AVAILABLE FROM THE WRC 11.1 Introduction In order to support government legislation and encourage efficient use of the available water resources in South Africa, the Water Research Commission (WRC) has initiated and supported numerous projects over the past 15 years. Although some very comprehensive and sophisticated software is already available both internationally and locally, it is often out of reach of many of the smaller municipalities who cannot afford to purchase such packages. The WRC has therefore concentrated on providing low cost software solutions to assist water suppliers in understanding and managing their non-revenue water. The new models are all based on the Burst and Background Estimate (BABE) methodology, which was first developed for the UK Water Industry in the early 1990 s. The BABE philosophy has since been accepted and adopted in many parts of the world as it provides a simple and pragmatic approach to the very complex and often confusing problem of leakage from water distribution systems. The approach was so successful that it is now recommended by many international water associations as the most systematic and pragmatic approach to leakage management. The BABE approach was first introduced to South Africa in 1994 through a series of courses and seminars presented countrywide at the request of the WRC. The methodology and concepts have since been widely accepted by most water suppliers throughout the country and through the efforts and initiatives of the WRC, South Africa is now regarded as one of the key players in this field worldwide. In the development of the BABE techniques, it was agreed that the following four principal issues concerning leakage management (see Figure 81) should be addressed: Logging and analysis of minimum night flows; Economics of leakage and leakage control; Pressure management; Benchmarking of leakage and auditing of non-revenue water 126

144 Figure 81: Four key considerations for managing physical leakage In order to address the four key components of the BABE methodology, four models were developed over a period of approximately four years as shown in Figure 82 and described in Table 11.Each model is a small self-contained program which addresses one specific issue. It was decided to adopt this simple and straightforward approach in order to avoid confusion and allow water suppliers to use one or all of the models as they consider appropriate. 127

145 Figure 82: Four models originally developed by the WRC All four models are available through the WRC and details of the models are provided in Table 11 for reference purposes. The models were all developed with support from Mr Lambert who also developed many of the original models for the UK water industry although they have been customised to some extent for use in South Africa. They are accompanied by detailed user manuals which provide background to the theory as well as tips on how to use the models. The software and accompanying manuals can be obtained directly from the WRC web site on Table 11: Details of BABE Model documentation Model Details ISBN Reference SANFLOW PRESMAC Model designed to provide an indication of the unexpected detectable leakage in a zone from the analysis of the minimum night flow. Model designed to estimate the potential for pressure management in a pressure zone based on logged flow and pressures over a WRC Referenc e Released TT 109/ & TT 152/ &
146 representative 24-hour period. BENCHLEAK Model designed to establish the components of non-revenue water in a water utility or zone metered area and associated performance indicators based on the latest IWA Task Force recommendations TT 159/ superseded ECONOLEAK Model to evaluate the most appropriate frequency for undertaking active leakage control TT 169/ AQUALITE Updated version of model designed to establish the components of nonrevenue water in a water utility or zone metered area and associated performance indicators based on the latest IWA Task Force recommendations. Replaces Benchleak TT 315/ WDM SCORECARD A basic scorecard based model used to develop a first order WDM strategy for a municipality quickly and effectively TT 523/ The State of Non-Revenue Water in South Africa A comprehensive report on the state of NRW throughout South Africa based on over 130 water balance assessments using the standard IWA methodology TT 522/ The four main BABE models developed through the WRC, shown in Figure 82, include the original BENCHLEAK water balance model, which was initially developed as a simple Excel spreadsheet and has now been superseded by the AQUALITE Model. The SANFLOW model used to analyse minimum night flows was one of the WRC s most popular downloads due to its ease of use and simple design. This model has recently been upgraded and the new version is already available of the WRC website. The original PRESMAC pressure management model has also been improved and provides a few additional features which were not available on the original version. AQUALITE, SANFLOW and PRESMAC are full DELPHI packages. 129
147 The underlying approach of the WRC is to promote good governance of water, and it is recognised that promoting the BABE methodology is of great help in this regard. Many of the BABE developments in South Africa are based to some extent on the previous work completed in the UK through the numerous initiatives undertaken by several key specialists working for the UK water industry. Although the models have been customised for use in South Africa, they are generally applicable for use in most water supply systems throughout the world with the possible exception of certain very low pressure systems that experience long periods of intermittent supply as experienced in some parts of Asia. The WRC decided at an early stage that any software developed to support leakage reduction in the municipal environment would be distributed free of charge to any municipality wishing to use the BABE techniques. Since the WRC models were initially developed, many new models have been introduced to the water industry throughout the world either as commercial packages or as free packages developed by various organisations as their contribution to the industry. In South Africa, the WRC has continued to support the concept of free software in the WDM field and in this regard, most of the original models have now been upgraded to ensure that they remain useful and relevant in the current environment where WDM is becoming one of the key issues being addressed by virtually all water service providers worldwide. The WRC software is freely available not only to South African users but to any individuals or organisations throughout the world The water audit model (AQUALITE) The BENCHLEAK model developed in South Africa was the first Excel-based water audit model to be developed in the world, and was based on the original Word document by Allan Lambert who also assisted in the design of the various South African models to ensure that they are in line with the International Water Association s guidelines for best practice. Through the efforts of the WRC, South African water utilities now have free access to the full range of BABE software. The BENCHLEAK model also helped to promote the concepts of the Infrastructure Leakage Index (ILI) throughout southern Africa and, in turn, led to a large scale study of ILI values for over 130 systems countrywide as discussed in Section The water audit and benchmarking model was one of the first models developed by the WRC and was released as BENCHMARK in 2000 although the final documentation was only released two years later in 2002 (WRC, 2002). This simple Excel based model was used for several years in South Africa and many other countries to assess the overall water balance 130
148 of water utilities based in the standard International Water Association water balance. Many other similar models have since been developed, some of which are sold commercially while most are provided freely to users. In 2007, the WRC commissioned the development of AQUALITE (Figure 83) which is effectively a Delphi based version of the original model incorporating a few additional features which were not included in the earlier Excel-based model. The additional features include: Ability to toggle between 7 different unit sets Splitting mains into bulk and transmission to allow different pressure and time of pressurisation to be modelled; Ability to specify error bounds in cases where users have knowledge of data accuracy; Selection of specific performance indicators in accordance with density of connections; Ability to supply base data at greater level of accuracy where available through tables. 131
 The analysis of minimum night flows was undertaken using the SANFLOW model (WRC, 1999) which was one of the first models developed and also included a full")
149 Figure 83: Updated version of water balance and benchmarking model 11.3 Analysis of minimum night flows (SANFLOW) The analysis of minimum night flows was undertaken using the SANFLOW model (WRC, 1999) which was one of the first models developed and also included a full description of the BABE methodology. The model is used to assess the level of excess leakage in a discrete zone from the analysis of the minimum night flow using the standard BABE methodology which is fully described in the accompanying documentation. This model has been one of the most popular of all WRC models to date and was originally developed in Delphi. The success of the model was due in part to the simplicity of use and it has remained unchanged for almost 10 years before being upgraded in 2008 (Figure 84). The new version contains virtually no new features and is effectively a face-lift which allows the model to operate under the various new operating systems which created certain 132
150 conflicts with colour schemes etc. The revised version should operate properly on any new Microsoft operating system and is available freely from the WRC website ( The analysis of minimum night flow is discussed in more detail in Section 5 (Appendix B) and a full discussion on how to interpret the results is provided through a series of annotated examples of real logging results. Measurement of minimum night flow into a zone-metered area is possibly one of the simplest and most valuable actions that a water supplier can take in order to identify whether or not they have a serious leakage problem. The analysis of background night flows is a simple exercise and the new SANFLOW model provides a quick and effective aid to water suppliers in this regard. The program was designed specifically to assist water suppliers in identifying likely problem areas with respect to leakage and conversely also those areas that do not have a serious leakage problem. The development of the new model was initiated and supported by the WRC and was officially released in August The model is based directly on the BABE principals as set out by the UK Water Industry (1994) and is written in DELPHI for the Windows operating system. The SANFLOW Model includes several additional features which are not currently available on any of the overseas versions. In particular, it includes the ability to undertake sensitivity analyses based on basic risk management principals in order to provide a likely distribution for the number of bursts in a zone (or district). This feature enables the user to set an upper and lower limit on each parameter used in the model. The selection of the parameter values has often been criticised as too subjective, with the result that different users may obtain different results from the same initial data. By using the sensitivity analysis feature of the model, this potential problem can be addressed. The most important difference between SANFLOW and its UK counterparts is the fact that SANFLOW is not based on an EXCEL spreadsheet. Instead it is a full Windows application based on the Borland DELPHI package and therefore requires no additional software on the user s computer. The UK-based products generally require the user to have EXCEL available to run the leakage programs. The second main difference between SANFLOW and the UK programs is that SANFLOW has been designed in such a way that it is extremely simple to use, and all of the detailed calculations are hidden from the main screen. The main screen therefore provides a clear and concise overview of the leakage in a particular zone. Details for any of the calculated values can be viewed by simply selecting the variable from the main task bar. 133

151 A third and possibly the most useful difference between the models is the incorporation of a sensitivity analysis in SANFLOW. In all of the previous commercial versions of the BABE models, there was always a concern regarding the selection of certain process parameters or variables that could influence the overall leakage predictions. To establish if such variables had an important influence on the results, the user would normally have to change each variable individually and re-run the program. In the case of SANFLOW, a new feature has been added that allows the user to view (graphically) the significance of changing the various process parameters either individually or simultaneously. This feature adds a new dimension of reliability to the results from the model and addresses perhaps the most common criticism of the basic BABE approach. In summary, the SANFLOW model is based to a large degree on research and work undertaken in the UK. It started at the point where the UK research left off in 1996 and has taken the development to a new level of presentation and reliability. Figure 84: Updated version of night flow analysis model 134

152 11.4 Pressure management model (PRESMAC) The original PRESMAC model was developed in 2001 (WRC, 2001) and was designed to provide an initial estimate of the likely savings that could be achieved in an area through some form of pressure management. The original model was developed in Delphi and allowed the user to analyse fixed outlet and time modulated pressure control. The revised version of PRESMAC (Figure 85) includes the flow modulated pressure control option which was not available in the original model, while most other features are common to both. The new version is available from the WRC web site ( Figure 85: Updated version of pressure management model There has been considerable debate over the past 10 years concerning the accuracy of the predicted savings from any of the numerous models available which claim to be able to predict the savings that can be achieved through different forms of pressure management, including the various time and flow modulated options as discussed in Section
153 (Appendix I). The approach used in PRESMAC is relatively simple, and does not incorporate a full hydraulic reticulation model which many other vendors provide: normally on a commercial basis. In practice, however, it is usually found that the results from PRESMAC are of sufficient accuracy to establish whether or not pressure management is viable and the predicted savings are normally within the error margins expected. In most cases, it is found that the actual savings achieved, cannot be predicted with greater accuracy due to a wide range of factors that are excluded from any available model such as quality of workmanship when laying the reticulation. The model does not include the savings that result from the reduced number of new burst pipes which can be highly significant and it also excludes the financial benefits resulting from the extended life-span of the reticulation system. This latter item can in many instances dominate the economics of the pressure management initiatives but it is also the most difficult item to quantify with any level of confidence. By excluding some of the benefits from the assessment, the results will err on the conservative side. The PRESMAC pressure management model is used to assess the likely savings (in monitory terms) of various pressure reduction options (fixed outlet and time modulated PRV s) in a selected zone metered area. The analysis is undertaken in a relatively simple and pragmatic manner based on the general BABE concepts. This approach allows the user of the program to gauge the potential for pressure management very quickly and effectively without requiring a full detailed pipe network analysis. Although the methodology is based on a number of simplifications and assumptions, in practice the predicted savings are generally within 10% to 20% of those actually achieved ECONOLEAK The ECONOLEAK model is not designed to address the economic issues associated with all of the various types of leakage-reduction activities mentioned above. Instead, it is aimed specifically at determining when a water supplier should invest in active leakage control for a specific zone metered area. The model will assist water suppliers in gaining a better understanding of the main factors influencing the economics of leakage control, and will enable them to identify the most cost-effective methods of reducing their system leakages. In order to use the ECONOLEAK Model, the user must supply considerable factual system data relating to the frequency of burst pipes in the system and the associated costs of repair. Such information is often difficult to obtain and in many cases the water supplier is unable to provide even the most basic leakage data. While this is clearly a problem in the short term, it does create an awareness of what information is required to undertake an economic analysis 136

154 of leakage control. This in turn, should encourage water suppliers to start capturing and processing the necessary data so that they may be able to carry out some form of economic analysis in future. In this regard, the model is very useful in creating awareness of the key information that all water suppliers should be capturing and monitoring on a continuous basis. It should be noted that ECONOLEAK (WRC, 2002) has not been upgraded. This model was developed to assess the economic level of active leakage control and remains in its current form. Since the model was first released, there have been numerous new developments aimed at establishing the economic level of leakage most of which tend to again address only the aspects of active leakage control WDM scorecard for developing initial WDM strategy Before any WDM intervention is implemented, it is normal practice to undertake an investigation of the area in question in order to assess the key problems and to propose a strategy to address the critical issues. The resulting WDM strategy usually includes recommendations of a range of interventions designed to address the main problems in order to reduce losses and/or the consumptive use. To assist municipalities in developing a basic first order WDM strategy, the WRC has developed a simple model using a standard scorecard as shown in Figure

155 Figure 86: Municipal WDM Scorecard available from WRC Balanced Scorecards have been used for many years to assess and monitor complex situations which involve a wide range of functions many of which cannot be assessed or quantified in a normal manner. It is ideally suited to multi-disciplinary activities such as the operation and management of a water utility for example. In such an organisation there may be various technical issues that must be assessed and monitored as well as different human resources and financial activities etc., all of which are important in their own right but cannot be compared or measured directly with each other. It is therefore difficult to evaluate and measure the overall performance of the utility without resorting to some form of Balanced Scorecard approach. In 2002 a highly simplified version of the Balanced Scorecard methodology was adopted in South Africa to evaluate the many aspects of a WDM strategy for a large water supplier. The methodology was modified over several years into a simple spreadsheet comprising 25 key issues each of which carried different weightings in accordance with their perceived importance. The approach was found to be very useful and was subsequently modified and customised to evaluate the WDM situation in South Africa as well as in several other countries around the world. It was found to be very helpful in developing a quick and 138
156 pragmatic WDM strategy for a water supply authority and the respective Clients using this approach also found the process extremely helpful since they were involved directly with the evaluation and scoring of each item. The methodology is far from complicated and is very simple and straightforward to use. It is extremely flexible and can be modified to suit a specific application or client or even be colour coded if this is considered easier to understand. Many variations of the methodology have already been applied, and the items included in the scorecard can be reduced or increased where appropriate. From the analysis of more than 300 municipalities it has been found that between 20 and 40 items is generally more than sufficient to capture the key elements needed by a specific water supplier to develop a practical WDM strategy. When more items are included, it tends to become a more academic exercise with the subsequent risk of losing focus on the key problem issues to be addressed Summary When using any of the BABE models it should be remembered that the underlying basis of the methodology as developed by the UK Water Industry is an empirical assessment of various sample datasets obtained from different water utilities throughout the world. The ILI, for example, is based on only 26 different data sets as analysed originally by Allan Lambert, who then selected the four most important variables which he considered to be appropriate to explain physical leakage from a reticulation system (pressure, number of connections, length of mains and length of underground connection pipe). If the same analysis was repeated today based on the many thousands of available datasets, the results and parameters selected may be quite different from those originally selected. It is therefore not an exact science by any means, and those using the BABE Methodology must always be aware that it has its limitations and should not be taken to a level of complexity that ignores the underlying assumptions. The overall methodology is designed to help water supply managers understand their systems and to identify the key issues that influence leakage. 139


157 140

158 141
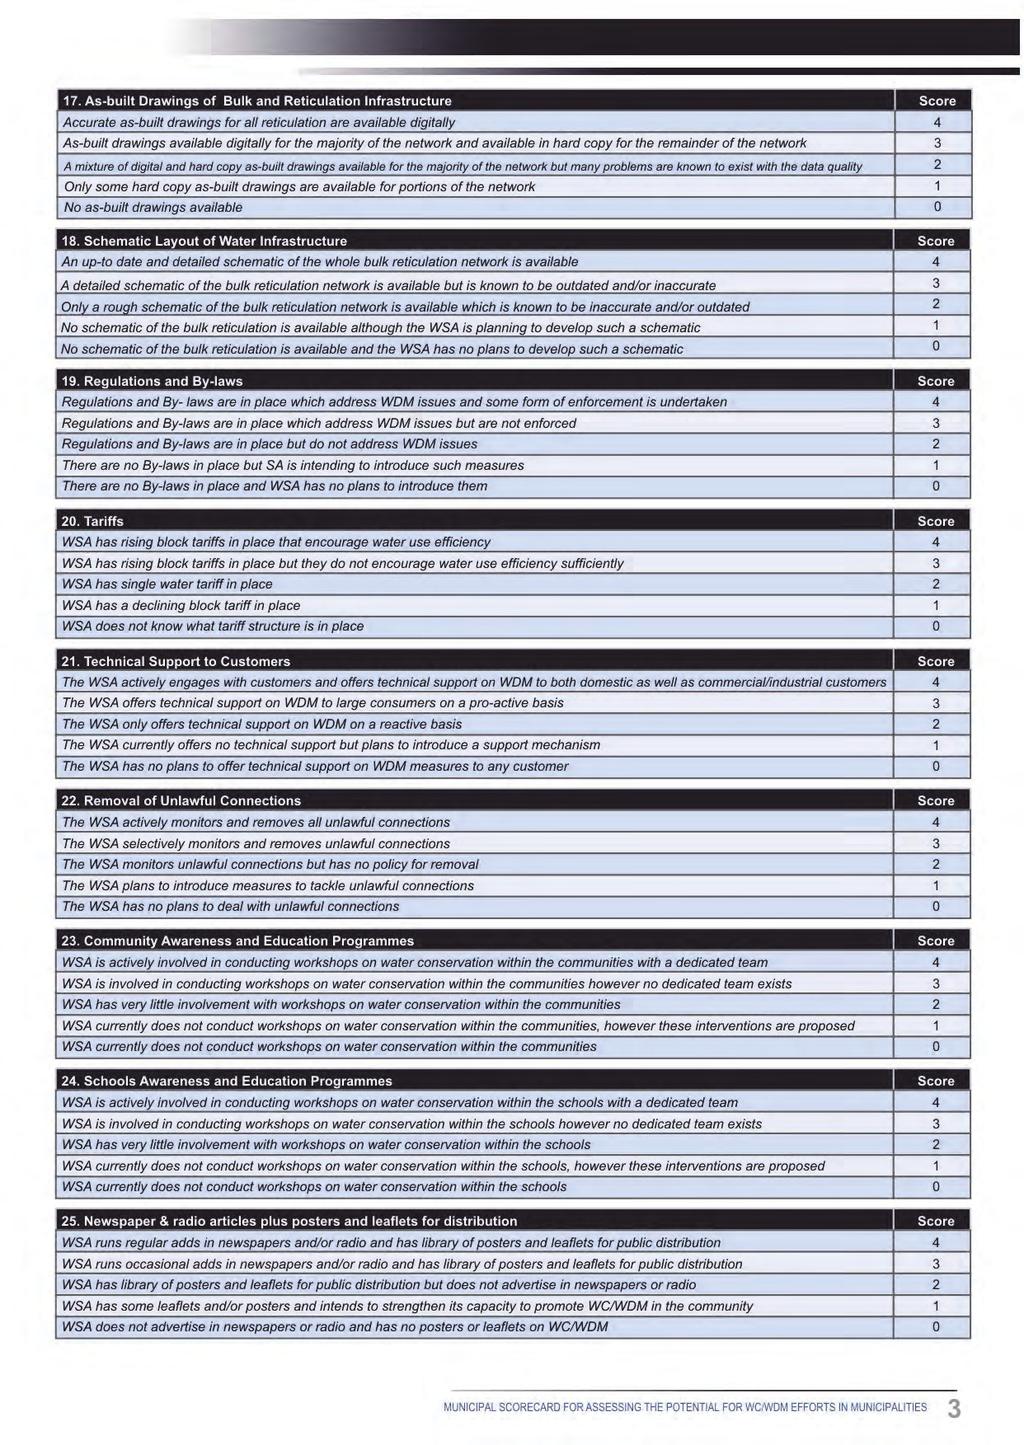
159 142
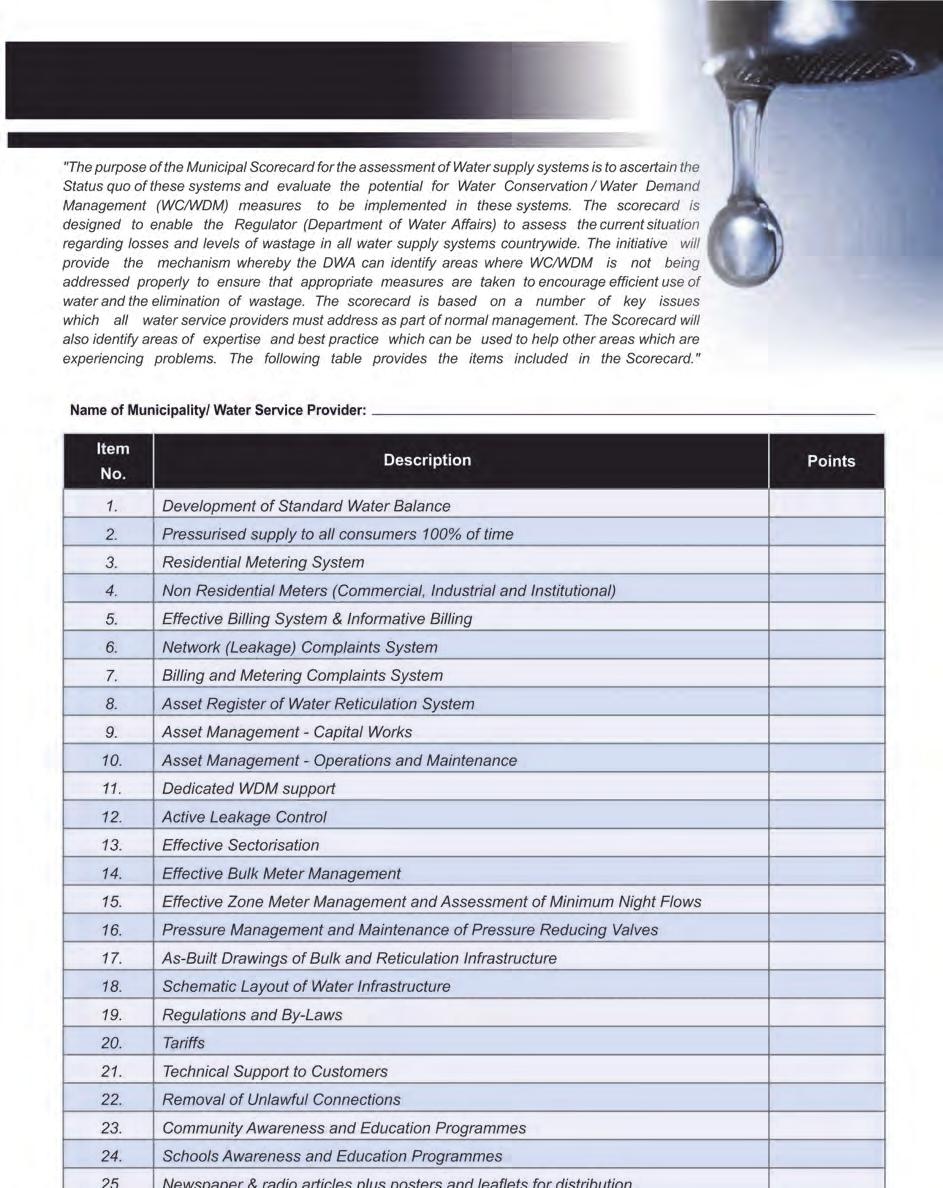
160 143
161 12 APPENDIX I: PRINCIPLES OF PRESSURE MANAGEMENT 12.1 Importance of pressure management As mentioned previously in the main text, one of the most important WDM interventions that should be considered when developing a comprehensive WDM strategy for an area is pressure management. While it must be acknowledged that pressure management is not the answer in every case, it is often one of the most cost-effective measures to reduce leakage and wastage that can be considered. South African water-supply systems tend to be operated at relatively high pressures and, in some cases, the pressures experienced in the distribution system exceed 150m, which is well in excess of the normal design pressure of 50m. In many parts of South Africa, pressure management is therefore one of the most important WDM interventions, and is often one of the first WDM interventions to be implemented. There are a number of different options available when considering pressure management ranging from a basic pressure reducing valve (PRV) to several different forms of advanced pressure control which require some form of additional electronic or hydraulic control device. While the use of such controllers can reduce leakage rates and the incidence of new bursts significantly, care should be exercised when considering their use. Despite some of the claims being made regularly in the media concerning the huge savings that have been achieved in specific circumstances, the use of such equipment will not work at all if the basics regarding the pressure zone are not in place. In other words, it is essential to ensure that the pressure zone under investigation is operating properly as a discrete pressure zone. If not, then no form of advanced pressure controls, no-matter how smart or sophisticated, will function properly. From experience, the most important issue when trying to introduce any form of pressure management is ensuring that the zone being considered is discrete and remains discrete. Only then can any form of pressure management be considered. Installing and operating controllers is the easy part of this intervention while establishing a proper pressure zone is often the most difficult and time consuming part of the work. If the zones are not discrete and are interlinked in any way, then pressure management is unlikely to function properly and should not even be considered until the underlying zone problems have been resolved Concepts of pressure management Water-supply systems worldwide are generally designed to provide water to consumers at some agreed level of service, which is often defined as a minimum level of pressure at the 144
162 critical point, which is the point of lowest pressure in the system. In addition, there may be certain fire-flow requirements which can override the normal consumer requirements. The systems are designed to accommodate these pressure and flow requirements during the period of peak demand, which would normally occur at some specific time of the day and during a particular month in the year. In other words, the systems are designed to provide the appropriate supply during a very short period in the year and for the remainder of the time the systems tend to operate at pressures significantly higher than required. Even within the same system, there will be areas of high pressure due to topography and/or distance from the supply point with the result that many parts of a supply area will operate at pressures significantly higher than required in order to ensure that there is sufficient pressure at the one critical point. Managing water pressures in a supply area is not a simple issue and there are a great many items to consider. The common factor in every system is the fact that leakage is driven by pressure and if the pressure is increased, the leakage will also increase. If the water pressure in a system can be reduced, even for a short period during times of low demand, the water leakage from the system will be reduced. Many theories have been postulated to explain the pressure-leakage relationships in a municipal water-supply system with the FAVAD (fixed area variable area) being the most widely accepted approach. Contrary to popular belief worldwide, the origin of the FAVAD theory can be traced back to a paper by Ledochowski (1956), who completed his research in Johannesburg. It is therefore very fitting that Johannesburg should have been the first city to implement advanced pressure control on a relatively large scale in South Africa back in In summary, the relationship between pressure and leakage will conform to a square-root relationship in cases where the size of the leakage path (i.e. hole) remains constant during the change in pressure. This is the typical situation when the leak is a small hole in an iron or steel pipe (i.e. a fixed area leak) in which case doubling pressure will result in approximately a 41% increase in leakage. In the case of leaks from plastic pipes or from cracks in asbestos cement pipes, the surface area of the leakage path does not remain constant when the pressure changes and such leaks will often open up to create a larger hole through which the water can leak. Such leaks are referred to as variable area leaks and if the pressure is doubled, the leakage will increase more than from a fixed area leak. In some cases, the leakage will increase by as much as 8 times the original level. 145
163 In order to reduce leakage through pressure management it is necessary to reduce the water pressure without compromising the level of service with regard to the consumers and firefighting. As mentioned previously, most systems are designed to provide a certain minimum level of service in the system during the peak demand period. In most systems, there tends to be a mixture of fixed area and variable area leaks, and the split will depend on the proportion of steel/iron pipes to plastic/asbestos pipes. Many papers have been presented on this topic in which formulae are provided to predict the impact of changes in pressure on leakage. From the author s experience, it is often found that certain other factors play a more critical role in the pressure-leakage relationship. For example, it has been found in many parts of South Africa that the quality of workmanship when laying the pipes is one of the most important factors influencing the leakage. Two similar systems next to each other can have significantly different leakage characteristics simply because one system was laid properly with adequate site supervision while the other system was laid by a poorly qualified contractor with poor supervision. In such cases, there is no adequate theory to explain the different responses to changes in pressure. In order to reduce leakage through pressure management it is necessary to reduce the water pressure without compromising the level of service with regard to the consumers and firefighting. As mentioned previously, most systems are designed to provide a certain minimum level of service (around 20m) in the system during the peak demand period. During the off-peak periods, which tend to much greater than the peak periods, the system operates at a water pressure which is significantly higher than necessary. In effect, there are long periods when there is significant scope for pressure reduction and this is the basis on which the pressure management interventions are designed. Reducing the water pressure in a system can be achieved in a number of ways each of which has advantages and disadvantages. The following techniques are discussed: Fixed outlet pressure control Time-modulated pressure control Flow modulated pressure control Closed loop and hybrid control Fixed outlet pressure control involves the use of a device, normally a pressure reducing valve (PRV) which is used to control the maximum pressure entering a zone as can be seen 146

164 in Figure 87. This is possibly the simplest and most straightforward form of pressure management as it involves the use of a PRV with no additional equipment. The advantages of this form of pressure control are: It is relatively simple to install as it requires only a PRV Cost is relatively low as it involves no electronic equipment Maintenance and operation is relatively simple Figure 87: Fixed outlet pressure control The only disadvantage is that the system does not have the flexibility to adjust the water pressures at different times of the day, with the result that the maximum possible savings cannot be achieved. In many instances, fixed outlet pressure control is the preferred option due to the capacity of the maintenance teams who may not be able to operate and maintain the additional equipment required when using some form of advanced pressure control. The time-modulated pressure management option is shown in Figure 88 and is effectively the same as the fixed-outlet system with an additional device which can provide a further reduction in pressure during off-peak periods. This form of pressure control is useful in areas 147

165 where water pressures build up during the off-peak periods typically during the night when most of the consumers are asleep. The main advantages of this option are: The controller provides greater flexibility by allowing pressures to be reduced at specific times of the day, resulting in greater savings The electronic controller is relatively inexpensive The controller is relatively easy to set up and operate The installation does not require a flow meter as the controller connects directly to the pilot on the PRV The main disadvantage of time-modulated control is that it does not react to the demand for water and this can be a problem if a fire breaks out requiring full pressure for fire-fighting. This problem can be overcome to some extent through the installation of a flow meter. In addition, the time-modulated option is more expensive than the fixed outlet option and does require a higher level of expertise to operate and maintain the installations. Figure 88: Time control A typical time-control installation is shown in Figure 89 from which it can be seen that the controller is only connected to the pressure reducing valve via three coloured plastic pipes (red, green and blue). The fourth cable which is connected to the meter is an optional cable that is simply used to log the flow going through the installation but has no influence on the 148
166 controller.the controller itself is a simple device which is easily set up using the two selection buttons on the front panel to set up the time for switching between the high and low pressure settings. A simple round knob-like dial on the bottom of the controller is used to control the low pressure setting while the high pressure setting is fixed by the pilot on the pressure reducing valve. Should the controller fail for any reason, the PRV will revert to the outlet pressure setting as controlled by the pilot of the PRV. It should be noted that there are many similar controllers available in the market and they all have slightly different features. 149

167 Figure 89: Typical PRV with time-control (photo Niel Meyer) Flow modulated pressure control as shown in Figure 90 provides even greater control and flexibility than the time-modulated option. It will normally provide greater savings than either of the two previously mentioned options but this greater flexibility (and savings) comes at a 150

168 price. The electronic controller is more expensive and it requires a properly-sized meter in addition to the PRV. It may not always be cost effective to use the flow modulated option and careful consideration should be given to the specific application before selecting flowmodulated control. One key advantage is that the flow modulated option will not hamper the water supply in the case of a fire but the additional savings achieved may be offset against the extra cost of the controller and need for a meter. In addition, there are more components in a flow modulated installation and there will be failures from time to time. The reduction in savings during such component failures is an issue to consider. Figure 90: Flow modulated pressure control A typical example of flow modulated pressure control is shown in Figure 91 from which it can be seen that the downstream pressure profile closely mimics the flow through the installation. 151

169 Figure 91: Flow modulated pressure control This form of pressure control has various advantages over the simpler time-control or fixed outlet control in that it provides greater flexibility and will generally achieve greater savings than the simpler forms of control usually an additional 10% to 20%. It also helps to address any concerns regarding the fire-fighting flow requirements in the respect that in the case of a fire, the controller will open up if required to maintain the necessary system pressure to support the increased flow. The increased flexibility does, however, come at a cost, which includes not only the increased cost of the controller itself but also the need for a flow meter to drive the controller. The flow meter must be properly sized and fully functional together with a working reed-switch to connect the flow meter to the controller. In addition, the controller may require the use of a computer or hand-held device to set up the pressure and flow profile. It is therefore a more complicated process, and one that now includes several other components, all of which can malfunction and therefore represent potential problem issues when using such control. In certain circumstances where the potential savings warrant such control and the client has the technical capacity to operate and maintain the equipment, it can be a viable option. In other cases, it may be too sophisticated and without proper maintenance it will not be sustainable, in which cases a simpler and more robust solution should be considered. Figure 92 shows a typical set-up for a flow modulated controller in which the key items necessary to achieve flow control are indicated. 152

170 Figure 92: Typical flow modulated controller installation In most cases, flow modulated pressure control is as sophisticated as most water utilities will consider. In many instances, the use of flow modulated control is beyond the human resource skills base of the water utility and, as a result, time-modulated control or basic fixed outlet pressure control is the preferred and most appropriate option. In recent years, however, several more advanced closed-loop and self-learning systems have been implemented in various parts of the world which claim even greater savings than those achieved from flow control with claims of an extra 2% to 10% over standard flow control. In these more advanced installations, a pressure sensor at the critical point is generally used to monitor the pressure and provide some form of feedback to the controller at pre-defined intervals. The feedback to the controller can be on a real-time basis, in which case it will normally update the controller on the pressure status at the critical point every 15 minutes or so. In other cases, it will record a full day of pressure information before transmitting the data to the controller which will then adjust the pressure profile for the following day. These forms of pressure control as shown in Figure 93 and Figure 94 can provide the near ultimate level of control and therefore also the maximum savings that can be achieved. 153
171 Figure 93: Closed loop pressure control Figure 94: Advanced closed loop pressure control 154
172 Once again, both approaches have certain advantages and disadvantages, which should always be taken into account when trying to establish the most appropriate form of pressure control for a specific application. Any additional savings will come at a cost both in monetary terms and also the technical expertise needed to support the long-term sustainability of the equipment and the possibility of component failure which will happen at some time as well as the battery life for the units in cases where they are battery powered. It should be noted that there are numerous other forms of pressure control which can be considered when trying to reduce losses from a water distribution system. Several excellent hydraulic controllers are also available in addition to a number of simpler devices based on a basic orifice plate. No matter what approach is selected, if the water pressure in an area can be reduced for even a short period, there will be a reduction in leakage, a reduction in the number of new burst pipes and the useful life of the reticulation system will be extended to some degree When to use pressure controllers In recent years there has been considerable debate regarding the use of electronic controllers on pressure reducing valves. The most common question being asked is when is it appropriate to use a controller and if so, what type of controller. Unfortunately there is no clear cut answer to this question, and each installation and pressure zone must be examined carefully after which the various options can be compared and a final decision taken. It is important to look beyond the hype and spin of some suppliers who promote the use of controllers in virtually every case when in reality, many situations do not warrant the use of anything more than a standard pressure reducing valve. Based on the results achieved from over 400 pressure management installations, it appears that the largest saving achieved from a pressure management installation is usually from the basic fixed outlet pressure control, which simply involves a pressure reducing valve and associated pilot. In most cases, this will provide around 60% to 70% of the ultimate savings that can be achieved and, in some cases, even more. Obviously the benefits will vary from case to case and will depend on the characteristics of the pressure zone in question. Adding some form of timecontrol can often give a further 10% to 20%, again depending on the characteristics of the zone. A flow controller will bring up the ultimate savings to between 90% and 95% of the ultimate savings and some form of closed-loop or self-learning control will provide the remainder. Any claims that a controller is directly responsible for generating 60% of the 155
173 savings or more are usually over optimistic and tend to include both the benefits of the fixed outlet control and the controller. In summary, if a zone experiences large pressure fluctuations at the critical point between peak demand and off-peak demand periods, there will often be scope for additional savings through the use of a controller. In other cases, where a system does not experience major pressure fluctuations at the critical point between the peak and off-peak periods, there will be little benefit achieved through the use of a controller unless the client is willing to accept a different critical point pressure at night compared to that required during the day. To highlight the above issue, the Eerste River Case Study from the City of Cape Town provides an excellent case study where a controller is not necessary. The Eerste River water-supply system initially experienced very high water pressures in excess of 80m, resulting in high water losses through infrastructure leaks and a high incidence of burst pipes.the level of leakage at the start of the project before any form of pressure management was introduced can be seen in Figure 95 which indicates an average daily flow of 265 m 3 /hr and a minimum night flow of around 158 m 3 /hr. The ratio of MNF to ADD (often used as a rough indicator of leakage levels) of 60% was very high and suggested very high levels of leakage in the area a target value of around 20% would normally be considered acceptable. As a result of the high water pressure, the zone experienced approximately 240 bursts per annum before any form of pressure control was introduced. This naturally had major cost implications as well as service delivery implications. 156

174 Figure 95: Original flows into Eerste River To address this problem, the City of Cape Town commissioned the design and implementation of a single pressure management installation on the main supply pipeline into the area. Before introducing the pressure management, it was first necessary to sectorise the area and eliminate all bottle-necks caused by open or closed valves which first had to be identified. This is often the most difficult and time-consuming part of any pressure management initiative and only after the zone has been properly sectorised can the pressure be reduced. The area involved is shown in Figure 96 and the PRV installation involved a single chamber housing a 250mm-diameter valve. The initial pressures in the area are shown in Figure 97, which highlights that the pressures at both the inlet and critical point were very high, with critical point pressures of between 60m and 80m. In such an area, there is clearly significant scope for some form of pressure management and the main PRV installation was completed in It is also important to note that in this specific case, the variation in pressure at the critical point between peak and off-peak demand periods was relatively small. This is unusual as it indicates that the reticulation network is under relatively little stress during the peak demand periods, and often indicates that the area has yet to achieve its full developed demand. 157
175 Before even considering the use of a controller, it is good practise to set up and monitor the effect of the basic PRV based on fixed outlet pressure control. In this case the pressure at the outlet of the PRV was reduced from over 80m to approximately 47m. The selection of the downstream pressure at 47m was based on the client s request that the pressure at the critical point should not drop below 35m and this can be seen in Figure 99 which highlights that the critical point pressure has effectively stabilised at between 38m and 35m, which is an unusually tight pressure band to find at a critical point from normal fixed outlet pressure control. The net result of this reduction in pressure is shown in Figure 100 where the reduced water consumption is highlighted by the area shown in blue. As can be seen in Figure 100, the savings are highly significant and clearly demonstrate the benefits that can be achieved from standard fixed outlet pressure control. The MNF dropped from 158 m 3 /hr to 47 m 3 /hr and there was still considerable scope for further pressure reduction since a minimum critical point pressure of 20m is usually sufficient. A summary of the initial savings generated through fixed outlet control at the Eerste River pressure management installation is provided in Table 12. The value of the water savings is based on the estimated cost of water production of R6.20/m³. Area Table 12: Eerste River pressure management project savings Savings (m³/day) Savings (m³/year) Value Savings / R6.20/m³ Implementation Cost Payback Period Eerste River R R years 158

176 Figure 96: Map of the Eerste River pressure management zone As can be seen from the figures provided in Table 12, the payback for this specific installation was around 4 months based on the initial savings. The use of fixed outlet 159
177 pressure control in this area resulted in a reduction of more than 70% based on the minimum night flow dropping from 158m 3 /hr to 47m 3 /hr. The total water use in the zone reduced from 266m 3 /hr to 129m 3 /hr representing a reduction of approximately 50% as can be seen in Figure 100. In addition, the average number of burst pipes per annum was reduced from over 240 per annum to less than 24 per annum following the initial intervention a drop of approximately 90%. Returning to the initial question of whether or not to use a controller, the answer lies in Figure 99 which shows the new pressure at the critical point. This figure clearly highlights that there remains scope for further pressure reduction in the area based on a normal minimum pressure of 20m. What is very interesting, however, is the fact that the pressure variation at the critical point is unusually low at only ± 5m and there is relatively little additional benefit to be gained from advanced pressure control. In order to establish the additional benefits of further pressure control in this area, the client subsequently tested the impact of reducing the fixed outlet pressure to 27m with an additional drop to 4m (using a highly sophisticated electronic controller) for approximately 6 to 8 hours each night. Dropping the pressure to 27m is easily achieved by simply adjusting the pilot on the main PRV while the additional drop at night is achieved using some form of advanced pressure control. Based on the published results, the overall water use dropped to an average of 127m 3 /hr, the minimum night flow dropped to 32m 3 /hr and the number of new burst pipes dropped to around 9 per annum. Clearly the introduction of more advanced pressure control does result in additional savings and it is simply a matter of deciding if the additional savings are sufficient to motivate the additional expense and associated maintenance. As always, there are two views on this and ultimately it is the decision of the client. One further comment regarding the application of pressure management which was conveyed by the water demand manager at one of the largest Metros in South Africa concerns the number of complaints received from consumers in a specific area. When assessing the financial viability of pressure reduction, it is also important to monitor customer complaints as they can often influence how low the pressure can be taken. In many cases, the financial models will suggest that water pressure can still be reduced while the water supplier will decide to accept a higher pressure regime to minimise customer complaints. The issue of pressure management will therefore often come down to some form of subjective decision and trade-off between savings and complaints. 160


178 Figure 97: Original pressure in Eerste River Figure 98: Pressures after implementation of fixed outlet pressure control 161


179 Figure 99: Critical point pressure after fixed outlet pressure control Figure 100: Flow savings from fixed outlet pressure control 162

180 The previous example from Eerste River demonstrated a zone where significant savings could be achieved through the implementation of pressure management although there was little if any additional benefit to be gained through the use of advanced pressure control due to the fact that the pressure at the critical point was already stable through the use of a normal fixed outlet PRV. In this second example, another zone is used to highlight a case where there is scope for advanced pressure control. The example is again from the City of Cape Town in an area called Langa as shown in Figure 101. Figure 101: Location plan for Langa The zone is not particularly large but makes an interesting case study due to the fact that the pressure at the critical point is highly variable unlike the previous example where there was very little difference between peak demand pressure and off-peak pressure. The inlet pressure, PRV outlet pressure and flow profile for Langa are shown in Figure 102 in which it can be seen that the PRV has been set to provide a fixed outlet pressure of around 52m and the valve is indeed providing a stable and continuous pressure into the zone. he resulting pressure at the critical point is shown in Figure 103 which clearly highlights a significant pressure variation between peak conditions and off-peak conditions. Such a pressure variation is often observed in pressure zones and is a function of the characteristics of the reticulation system and the system demand. If the demand is high relative to the capacity of the water mains, then at peak demand conditions the friction losses will be high and as a 163

181 result, the system pressure at the critical point will be significantly lower than that provided into the zone at the PRV. During off-peak conditions, there is little demand and therefore the friction losses are also low with the result that the pressure at the critical point is at or near the zone inlet pressure. This is clearly reflected in Figure 103. Figure 102: Inlet and PRV outlet pressure into Langa 164

182 Figure 103: Pressure at the critical point in Langa Zones with such a high pressure variation at the critical point are often ideal candidate zones for some form of advanced pressure control. As always, the question is to select the most appropriate form of pressure control to suit the zone and the needs of the municipality. In this particular case, it was decided to use basic time-control as a first step to assess the savings that could be achieved through a simple and relatively inexpensive controller. The resulting pressure entering the zone is shown in Figure 104 while the resulting pressure at the critical point is shown in Figure

183 Figure 104: Advanced pressure control using time control From Figure 105 it can be seen that the pressure variation at the critical point has been reduced significantly from the original situation as shown previously in Figure 103. The leakage in the area has also been significantly reduced from around 200m 3 /hr when using the fixed outlet PRV to around 80m 3 /hr when lowering the night-time pressure from 52m 3 /hr to around 30m 3 /hr. As can be seen in this example, the savings based on the minimum night flow analysis were very significant and in addition, there was a marked reduction in new burst pipes. The pressure variation at the critical point is not yet stable and indicates a variation of around 10m to 15m which can be improved through the use of a more sophisticated (and expensive) pressure controller. The use of some form of flow control can be viable in this example and would most likely provide further savings of between 10% and 20%, however, after discussions with the client it was agreed to use the basic time control for a period and to review the situation after the residents had become used to the lower pressures in the area. Unlike the previous example, the Langa zone clearly demonstrates that the additional control provided by an electronic controller is worthwhile. 166

184 Figure 105: Critical point pressure using time control 12.4 Some large advanced pressure management installations There are several hundred advanced pressure control installations in South Africa including at least three of the largest installations of their type in the world. While many of the smaller installations are of significance and of interest for a variety of reasons, the three largest installations are discussed below since they have helped to create awareness both locally and internationally of the benefits that can be achieved through advanced pressure control. The three large installations discussed below include, Khayelitsha, Sebokeng and Mitchells Plain all three of which are fully functioning are at the time of writing this report were 12, 8 and 4 years old respectively. Each of these installations is noteworthy for various reasons as discussed below Khayelitsha: City of Cape Town Khayelitsha is one of the largest townships in South Africa. The township is located approximately 20km from Cape Town on the Cape Flats, which is a large flat sandy area at or near sea level. There are approximately serviced sites, with both internal water supply and waterborne sewage while there are a further low-cost housing units which are supplied from communal standpipes supporting a population of approximately

185 At the beginning of 2000 the water supplied to Khayelitsha was measured to be almost 22 million m 3 /a. The level of leakage was estimated from the night -time water use to be almost three-quarters of the water supplied to the area. The minimum night flow was measured to be in excess of 1 600m 3 /hr which is sufficient to fill an Olympic sized swimming pool every hour. The main source of the leakage was identified as the household plumbing fittings which have been badly damaged through constant exposure to a relatively high pressures which could exceed 80m at some times. Such leakage resulted in very high water consumption in most properties and high levels of non-payment since the customers could not afford to pay for new taps and toilet fittings let alone the high water bills. The Khayelitsha Pressure Management Project was commissioned in 2000 to improve the level of service to the Khayelitsha community by reducing the excessive water pressure and pressure fluctuations in the reticulation system. The layout of the installation is provided in Figure 106. Figure 106: Schematic layout of Khayelitsha installation The average daily flow was reduced from 2 500m 3 /hr to 1500 m 3 /hr representing an annual saving of 9 million m 3 /hr or approximately 40% of the original water use. The minimum night flow was reduced from 1 600m 3 /hr to 750m 3 /hr. The number of burst pipes reduced significantly although these savings were not taken into account in the overall cost benefit analysis. Local labour was used throughout the project and the community support was a key factor in the successful implementation of the project which was implemented without any 168
186 incidences of theft or vandalism. The community awareness process was designed and implemented by the City of Cape Town using its own personnel in parallel with the project implementation. A summary of the actual savings achieved from the first two years of operation is provided in Table 1 (Mckenzie, Mostert & Wegelin, 2003). It should be noted that the latest estimates of savings achieved from the installation made by the City of Cape Town suggest savings of 9 million m 3 /a, with a financial saving of R54 million per year (± $6 million/a) (Meyer, Wright and Engelbrecht, 2009). The completed installation is shown in Figure 107 and Figure 108. Table 13: Summary of Khayelitsha savings for initial 2 year period Description Basis of calculation Volume saved Value of saving (R million) Direct water savings in 2002 Based on R3.09/ m 3 9 million m Direct water saving in 2003 Based on R3.49/ m 3 9 million m Delay to infrastructure 2 years 7% of R35 million/yr 4.9 Maintenance and replacement R per year -0.5 Total saving over 2 year period

187 Figure 107: Khayelitsha pressure management installation Figure 108: External view of the Khayelitsha pressure management installation 170
188 Sebokeng: Emfuleni Local Municipality 2005 Emfuleni Local Municipality is located to the south of Johannesburg in the industrial heartland of South Africa. The municipality supplies water to approximately 1.2 million residents of which are located in the Sebokeng and Evaton areas. The areas are predominantly low-income residential areas, with approximately household connections, each of which is supplied with an individual water supply as well as waterborne sewage. The combination of low income coupled with high unemployment has resulted in a general deterioration of the internal plumbing fittings over a period of many years. This has caused high levels of leakage, which is characterised by a minimum night flow in the order of m 3 /hr. This is one of the highest minimum night flows recorded anywhere in the world, and represents almost two Olympic-sized swimming pools of water every hour during a period when demand for water should be minimal. It was estimated that the wastage in the area before the project was commissioned was in the order of 80% of the water supplied to the area. In turn this represented an annual water bill of approximately R120 million per year ( ±$12 million). In 2004, the municipality commissioned one of the largest advanced pressure management installations in the world as the first phase of a long-term strategy to reduce wastage in the area. The project involved no financial input from the municipality and even the initial capital costs were provided in total by the project team. The project was, effectively, a small-scale Public Private Partnership (PPP) involving a simple risk-reward model details of which are provided in Figure 109 (Mckenzie and Wegelin, 2005). 171

189 Figure 109: Organisation framework for Sebokeng PPP The installation itself is shown in Figure 110 and is interesting for a number of reasons. The installation includes a manifold section at each end with 5 branch pipes connecting the two manifolds. The middle pipe section has no PRV or meter and is used to recharge the downstream network which may have emptied after a shutdown. If the supply pipes with meters are used to re-charge the network, there is a risk of damaging the meters in cases where mechanical meters are used. The original mechanical meters have now been replaced with Magnetic Flow meters to eliminate the meter problem, Butterfly valves are used in both manifolds to provide flexibility, both in allowing the pressure to be equalised between the two supply pipes which enter the chamber at different pressures due to their different pipe diameters and it allows the downstream pressure to be equalised if required. They also provide the opportunity to include the central pipe either to supply Sebokeng or Evaton should this be necessary as they grow in future. 172

190 All valves on the 5 supply pipes are resilient seal valves and not butterfly valves since they tend to provide a better seal in cases where valves are being opened and closed regularly Air valves are located on both manifolds and an enlarged collector tube is used to ensure that the air is in fact able to escape from the pipework. This is easier to see on Figure 111. Figure 110: Schematic layout of Sebokeng installation 173

191 Figure 111: Sebokeng/Evaton pressure management installation The savings achieved in the first 30 months of operation of the installation exceeded all expectations of both the project team as well as the municipality and are the most obvious benefits to accrue from the project. After operating and managing the installation for several years, several other benefits also became apparent which were not initially anticipated. In particular the following benefits have been achieved: Defer upgrading of infrastructure Identification of bottlenecks in the system and problem infrastructure Identification of bulk meter errors Catalyst for funding Improved municipality status Creation of national WDM fund Catalyst for other WDM interventions Sustainability of savings 174

192 The project represents a significant advancement in PPPs, and clearly demonstrates that small-scale partnerships can be viable despite the general view that this type of project is confined to large-scale initiatives due to the effort and expense in developing the PPP type of contract. While the Sebokeng and Evaton PPP is clearly one of the most successful small scale PPPs to be completed in South Africa, the real benefits of the project are only now materialising four years after the project was commissioned. Both the project team and the municipality are very happy with the outcome of the project and are continuing to work together to build on the initial success. While the financial savings generated exceed all initial expectations, the hidden and often less tangible benefits greatly outweigh the obvious and tangible benefits. The actual savings achieved are summarised in Table 14 and also depicted graphically in Figure 112. As can be seen from Figure 112, the water supplied to the area at the start of 2010 is almost the same as it was at the start of 2001, which clearly highlights the true level of savings that have been achieved. Figure 112: Water consumption in Sebokeng and Evaton areas for a 13 year period 175

193 Table 14: Summary of Sebokeng savings for first 60 months of operation The completed Sebokeng/Evaton pressure management installation is shown in Figure 111 and Figure 113. Figure 113: External view of the Sebokeng pressure management installation 176

194 Mitchells Plain: City of Cape Town November 2008 In order to meet the growing water demands within the City of Cape Town s supply area, several large and expensive water transfer schemes have been commissioned in addition to the ongoing water demand management interventions. One of the most significant water loss reduction activities involves the use of advanced pressure management. Since the City of Cape Town receives its most of its water via the Blackheath Water Purification Plant which stores the bulk water in a large reservoir at an elevation of approximately 110m above sea level, many low lying areas are supplied at very high pressures leading to high levels of leakage. This is particularly evident in the low lying and relatively flat sandy areas referred to as the Cape Flats. Such areas are therefore ideally suited to pressure management which has, in turn, resulted in the city embarking on several large scale pressure management projects. In 2008, however, the city decided to commission its second major pressure management installation in the Mitchell s Plain area, which supports a similar population to Khayelitsha. This project was commissioned in October 2008 and details of the installation are provided in Figure 114 and Figure 115. The projected water savings based on the initial flow logging results indicate that it will save approximately 2.4 million m 3 /a with a value of R14 million resulting in a pay-back of less than 6 months. Figure 114: Schematic layout of the Mitchells Plain installation 177
 In order to promote the installation and emphasise the importance of water demand management in the community, the installation was painted by local artists in such a manner that it sends a")
195 Figure 115: Mitchells Plain pressure management installation The initial savings from the Mitchells Plain installation are shown in Figure 116 (Engelbrecht, et. al, 2009) In order to promote the installation and emphasise the importance of water demand management in the community, the installation was painted by local artists in such a manner that it sends a strong message to all passers-by as can be seen in Figure


196 Figure 116: Initial savings from the Mitchells Plain pressure management installation Figure 117: External view of the Mitchells Plain installation 179
197 12.5 Conclusions Based on the results from the three case studies, it is clear that pressure management is highly effective in many parts of South Africa and that it can be implemented successfully on a large scale in certain areas. While it must always be remembered that pressure management is normally only the first phase of a larger water demand management strategy, it can often provide very significant savings in a short period of time. Pressure management also has many secondary benefits that are often overlooked, including extending the useful life of the water reticulation system as well as reducing new bursts. Such a benefits can often far outweigh the initial benefits as calculated from the water savings but will only become apparent many years down the line. South Africa was one of the first countries to recognise the benefits that can be derived from advanced pressure control, and currently lays claim to three of the largest advanced pressure control installations in the world. The Khayelitsha and Sebokeng installations in particular have received considerable recognition from various water utilities and funding agencies throughout the world, and have often been used to highlight world best practice in the field of water conservation in action. Finally, it must always be remembered that the most difficult and time-consuming part of any large pressure management installation is usually related to the sectorising and operation of the pressure management zone. If the basic groundwork has not been completed properly, no pressure management installation will function properly. Unfortunately this is often overlooked as is the regular maintenance needed to ensure that pressure zones have not been compromised by the unauthorised opening of boundary valves or the closure of internal reticulation isolating valves. These issues are critical and many well designed pressure management installations are not functioning due to problems within the zone. No amount of electronic equipment or sophisticated software will overcome the efforts of a local plumber focused on opening boundary valves. The best option is to introduce some form of monitoring system that will pick up such problems soon after they occur. The monitoring and maintenance of the zones is a continuous process and should always be part of any overall pressure management strategy. The City of Cape Town is one of the most progressive municipalities in South Africa with respect to pressure management and together with the City of Johannesburg; they have been implementing various forms of advanced pressure control since A summary of their key projects was presented by Engelbrecht at the international IWA Water Losses Conference, held in Cape Town in 2009 and is provided in Figure 118. The figures provided 180

198 refer to only four of the numerous pressure management projects that have been implemented in the Greater Cape Town area but they clearly highlight the significance of the savings that are being achieved by such WDM interventions. Although some of the figures cannot be directly compared with each other without taking inflation and interest into account, it is very clear that the pay-back for the pressure management activities is well under a year and in any municipality, such interventions will be cost effective. Figure 118: Savings from selected pressure management projects in Cape Town 12.6 A final word on pressure management Pressure management is clearly one of the most important issues when trying to minimise water losses from a reticulation system. The benefits of lowering water pressures are numerous and in many cases it is difficult to accurately quantify the long term hidden benefits such as extending the useful life of the network. Various models are available to undertake cost-benefit analyses which are very helpful in determining whether or not pressure management is likely to be viable in a specific situation. It is recommended that such a cost-benefit assessment is undertaken before finalising whether or not to implement 181
199 pressure management. The models will also help identify which form of pressure control is likely to provide the best returns on investment. In many cases the decision regarding which form of pressure control to use, will not only rest with the results from the cost-benefit analysis, but also the preferences of the reticulation managers. The reticulation managers must be comfortable that they can manage and maintain any pressure management valves and controllers used in the network. Experience has shown that the success of a pressure management installation ultimately depends upon the expertise of the operational personnel and their ability to maintain the various components used in the installation. 182
200 13 APPENDIX J: EKURHULENI BULK METER MANAGEMENT PROJECT 13.1 Introduction The Ekurhuleni Metropolitan Municipality (EMM) houses some of the largest industrial areas in the South Africa. It also houses many other bulk water users such as academic and medical institutions, large residential complexes, large retail complexes and municipal facilities. The focus areas for the work undertaken on this project were limited to bulk consumers in Springs, Germiston, Benoni and Edenvale as indicated in Figure 119. Most of the water connections to the bulk consumers in these areas were constructed many years ago and have not been replaced or upgraded since installation. As a result, numerous belowground meters are no longer operational and some have been buried for years and do not appear on the billing system. A large number of the meter chambers have been filled with debris and there are no records of fire supply connections to some bulk consumers which are therefore not metered. Over several decades, some of these mislaid connections have inadvertently or deliberately been used to supply domestic and, in some instances, process water. Some fire reticulation systems have developed leaks, but without metering of the fire connection in place, these leaks have gone un-noticed for years. As a result, the status of the metering infrastructure to many of the large consumers has been poor and subsequently it has been difficult for Ekurhuleni metropolitan municipality to bill these consumers accurately for their water consumption. Ekurhuleni metropolitan municipality has in the past provided new connections to large consumers as and when requested. This has led to a situation where a large consumer may have up to 20 connections to a single industrial site. The municipality is then required to maintain and read all of these supplies which invariably lead to mistakes. In many cases meters are simply not included in the billing process. This results in high levels of commercial losses in these heavily industrialised areas. These losses represent water that may be used for legitimate purposes, but is not being recorded in the billing system and therefore bypasses the accounting systems completely. As a result of such losses, the municipality loses many hundreds of millions in unclaimed revenues annually. If it is assumed that the commercial and physical losses are of similar magnitude in Ekurhuleni metropolitan municipality, it is estimated that the value of the commercial losses based on the current industrial water tariff of approximately R10/m 3 is in the order of R700 million annually. It is this component of the water losses that Ekurhuleni metropolitan municipality is targeting through the bulk meter audits of all large industrial users since the return on the project costs will generally be between 6 and 24 months. 183

201 Figure 119: Ekurhuleni Location Plan As new connections have been made to the water distribution networks, the hydraulic capacity of the distribution system is slowly decreasing, which can have an adverse influence on fire-fighting systems which were originally designed on the basis of the previous capacity of the reticulation network. As part of the project, Ekurhuleni metropolitan municipality has conducted drawdown tests on the municipal network to determine the capacity of the network at each of the large consumers investigated. This provides both the council and the consumer with a good understanding of what the fire flow capabilities of the municipal network are. In many cases, the consumer may be required to improve fire-fighting capacity on site and can no longer rely completely on the municipal system. This can have serious 184
202 and costly implications to certain large users, which may be required to provide both on-site storage and booster pumps to support their fire-fighting systems for insurance purposes. The accurate measurement of water supplied to all large industries is essential to enable the Ekurhuleni metropolitan municipality to measure all water used and to charge correctly for the water services provided. To this end Ekurhuleni metropolitan municipality, launched a project to assess and replace where necessary the water connections to its largest 500 industrial customers. This initial project is expected to be extended to cover over industrial customers and, when completed, will be one of the largest bulk metering projects to be undertaken in Africa. The project was funded by the Ekurhuleni metropolitan municipality in a phased approach where the savings generated in one year are used to motivate the expenditure for further bulk meter replacements in the following year. The savings related to this initiative are achieved through a decrease in non-revenue water and an increase in revenue for the municipality through improving metering and billing to consumers. It is anticipated that once the large consumers are accurately metered for their consumption, efforts will be made by the consumer to reduce water losses and operate more efficiently. This has been experienced at a number of consumers where leakages on internal reticulation have been repaired following the meter consolidation exercise. In addition to the decrease in nonrevenue water, Ekurhuleni metropolitan municipality has experienced an increase in revenue through the location and accurate reading of buried and lost meters which previously supplied consumers. Based on the initial results achieved for over 500 industrial customers, the total increase revenue from the project is expected to exceed R44 million/ year which conservatively indicates a pay-back of between 6 and 12 months. This project has provided clear evidence that tackling the bulk metered consumers is one of the most significant and cost-effective interventions that can be undertaken in Ekurhuleni metropolitan municipality, and serves as an example of what can be achieved in many other municipalities in South Africa. As a result of the success of the project, the approach is to be extended to all bulk water users throughout the Ekurhuleni metropolitan municipality area of supply and is likely to continue for many years Objectives of the project The key objective of the project was to reduce non-revenue water and specifically the commercial losses, by addressing metering problems at the top 500 consumers within EMM. Water connections to many of these bulk consumers had been constructed years, and in some cases decades ago, and had never been replaced or upgraded since they were 185


203 installed. As a result, numerous of the existing below ground meters were no longer operational and some had been buried for years with the result that the meter chambers have become full of debris which must be removed before the meters can again be included in the billing process. Some of the typical problems encountered in the investigations are shown in Figure 120 to Figure 123. Figure 120: Buried and broken meters Figure 121: Cleaning rubbish from chamber Figure 122: Meter buried in ground Figure 123: Non-functional and old meter Another key issue that is relevant in many parts of South Africa concerns the fire connections which were previously never metered. As a result, there are many thousands of unmetered fire connections throughout most parts of South Africa as can be seen in Figure 124. Over time, some of these connections have inadvertently (or deliberately see Figure 125) been tapped into for domestic or process water supply, with the result that such water use is not recorded and is therefore part of the commercial losses. Many industries that are using 186


204 water through unmetered fire connections are completely unaware that they are doing so illegally, and are very happy when such use is identified and brought to their attention. Others may not be so happy and in such cases, they generally know what is going on with their water supply. In both cases, the problems must be addressed and corrected so that all water being used by every industry is properly measured and properly billed. Many of the older unmetered fire reticulation systems have developed leaks over a period of years, and without proper metering in place, these leaks remain undetected and can often result in significant water losses. In the case of Ekurhuleni, the situation was aggravated by the fact that the current Metro comprises a number of previously autonomous municipalities, each of which had its own system for managing the metering and billing and in some cases; the systems used were totally inadequate. When the various municipalities were combined into a single Metro, many records and management systems were either lost or discarded resulting in some level of confusion and lack of consistency between the areas. In general, the quality of the bulk metering and associated billing was and the municipality eventually decided to address this problem through a large scale bulk meter management and replacement programme involving the top 500 consumers. It should be noted that Ekurhuleni is the most industrialised Metro in South Africa and has over industrial consumers. The Top 500 Project was the initial phase of a much larger and longer term plan to address the metering and billing problems in all bulk consumers. Figure 124: Example of an Un-metered fire connection Figure 125: Example of illegal connection to un-metred fire supply by consumer 187
205 13.3 Methodology In view of the repetitive nature of the work involved with the project, a systematic and methodical approach was developed which involved a large database application and associated report generator. This greatly improved the efficiency of the process and the work was eventually completed well within budget and programme. The project was undertaken in the following eight steps: Identification of top 500 consumers Initial field audit Zero pressure test Drawdown test Design of consolidated supply Construction of new pipework and meter chamber Commissioning of the new installation Courtesy visit and delivery of Installation Report to the customer Identification of top 500 consumers The first task was to identify the large consumers and consumers who have multiple feeds and un-metered connections. Consumers with metering or billing problems were also identified by the municipality who prepared a list of top consumers which was passed on to the project team for investigation Initial field audit Ekurhuleni metropolitan municipality had previously provided new water connections to large consumers as and when they were requested. This created a situation where a single industrial consumer could have up to 20 connections to a single property, each of which had its own meter. This creates problems for the municipality, which is then required to maintain and read all of these metered supplies for a single consumer invariably leading to problems with either the meter reading or the associated billing processes. In many instances, meters would get lost and no record of them would exist on the systems resulting in very high commercial losses. To address this issue, it was therefore necessary to identify all supplies into a specific consumer and to consolidate them into a single metered supply where possible. The initial field audit was the first step in this process. 188
206 The field audit involved locating and capturing all information relating to the consumer s water supply and water infrastructure on the property. An assessment was also made of the consumer s water demand in terms of fire-fighting, industrial and domestic demand. Effective communication was maintained with the consumer throughout the process to inform them of the purpose of the project and the benefits associated with the project. This improved the relationship between the consumer and Ekurhuleni metropolitan municipality as the consumer was generally impressed and pleased to see that action was being taken by the Metro. In most instances the consumer was happy to have accurate metering a billing of their water consumption in order that proper budgeting could be performed even in cases where the interventions eventually resulted in higher water accounts. All information collected during the field audit investigations was captured on a new database developed specifically for the project, which facilitated the generation of Audit Reports quickly and effectively Zero pressure test Once the audit had been completed, a zero pressure test was undertaken at each consumer to check that there were no other supply connections that had not been identified. The test involved isolating each of the identified supplies while simultaneously monitoring the water pressure inside the property. If any part of the water reticulation system inside the property remained pressurised during the zero test, it indicated that there was one or more additional connections to the main reticulation system that had not been identified and closed. In such cases, further investigations were undertaken, often involving the use of metal detectors and other locating equipment to try and find the missing supplies. The process was repeated until a successful shutdown could be achieved. Another form specifically developed for capturing details of the zero pressure test was completed for each consumer and an aerial photograph illustrating all metered and un-metered connections to the property was prepared as illustrated in Figure 126. It is important to recognise that in cases where a zero pressure test could not be achieved, it also implies that the consumer is unable to isolate their system in case of an emergency such as a burst pipe. When the process has been completed, all consumers are able to isolate their water supply and are provided with a detailed report providing information on all of the supply pipes and isolating valves etc. This type of information is very valuable to every industrial consumer and the consumers expressed their full support for the efforts. 189

207 Figure 126: Illustration of Metered and un-metered connections to a single property Drawdown test Drawdown tests were conducted at fire hydrants on the municipal network as shown in Figure 127 and Figure 128 to determine the hydraulic capacity within the municipal system and provide a good indication of the potential within the municipal supply system to provide water for fire-fighting purposes. Results from the drawdown tests were then used to support the consolidated meter sizing where each consumer would be supplied through a single metered connection. The tests were implemented by installing a pressure logger on the municipal main and monitoring the pressure in the main when a nearby fire hydrant is opened fully. The consumers were also informed in cases where the municipal network did not have sufficient capacity to provide water for fire-fighting purposes. Photographs of the drawdown test being conducted are included in and typical graphics achieved from the tests are included in Figure


208 Figure 127: Typical drawdown test Figure 128: Typical drawdown test Figure 129: Logging results from a drawdown test Design consolidated supply The appropriate water meter was selected based on a detailed assessment allowing for domestic, industrial and fire demands. The assessment took any on-site storage into consideration as well as the presence of booster pumps or absence thereof. Once the demand had been calculated, a suitably sized meter capable of delivering that demand was 191
209 selected. In some instances it was found that the water-supply network could not deliver the maximum demand required by the consumer. In such cases, the consumer was informed of the potential supply problems so that they could be addressed through an additional connection or some on-site storage etc. Once again, the consumer was very happy to support the process. All the information collected as well as a recommendation on the work required to implement the consolidation of metered and un-metered connections to the consumer was collated into a design report, which was submitted to council for approval. The design allowed for a single connection to each property wherever possible although in some cases additional connections were allowed. The designs involved cutting and capping all additional connections so that only the one or two official connections remained Construction Once the designs had been approved, a contractor was appointed by the municipality for implementation. The consumer was informed of the construction activities through a letter providing details of the work to be undertaken and regarding any possible interruptions to the water supply to ensure that any inconvenience would be minimal. In many instances it was necessary to isolate the municipal mains in order to achieve a shutdown for the new meter to be installed and the removed connections to be isolated at the municipal main. Dummy shutdowns were performed prior to the main shutdown date to confirm that the mains could indeed be isolated and to confirm which other consumers would be affected by the water outages. All affected consumers were then informed seven days in advance of the impending shutdowns and where necessary water tankers were arranged to provide water to consumers. The construction process was documented through photographs especially of the old meters to capture any final readings as well as details of any new meters. Typical photographs of the construction process are included in Figure 131 to Figure


210 Figure 130: Typical metered and unmetered supplies Figure 131: Preparing meter pipework Figure 132: Consolidating supplies Figure 133: Capping of old connection Figure 134: Connections consolidated Figure 135: Complete meter installation 193


211 Commissioning On completion of the construction, the project team inspected the site accompanied by the consumer to confirm that all water infrastructure was re-pressurised. The consumer was requested to sign a Consumer Acceptance Form for the work undertaken on their premises. A completion report was prepared for each site detailing all work undertaken and submitted to council as a formal record of all work undertaken at each large consumer. Full details of all meters removed together with serial numbers and meter readings were captured in the completion reports. Details of all new meters installed with serial numbers and meter readings were also documented. As-built drawings were prepared for all properties where sufficient work was undertaken to require an as-built drawing Courtesy visit and full report A final courtesy visit was made several months after the installation had been completed and a copy of the final report was presented to the consumer. The process involved the following; Assessing the correctness of metering & billing information on consumers account; Determining if the consumer had any complaints or concerns; Assessing the correct operation of the new meters; Repeat drawdown test to confirm all water supplied passed through meter installation; Cleaning the strainer on the meter installation if needed as shown in Figure 136 and Figure 137. Figure 136: Blocked strainer Figure 137: Clean strainer 194
212 13.4 Summary of results The project was funded entirely by Ekurhuleni metropolitan municipality at a total cost of around R20 million. The municipality benefited from the reduction of commercial losses which appeared as additional water sales to most of the consumers. In some instances, the increases in billed consumption were more than expected due to the location of buried meters which were ultimately brought into the consolidated supplies. Based on the metered and billed consumption during the first year after completion of the project, it was estimated that the increase in billed consumption to the municipality was in the order of R43 million/year. This represents a pay-back on the original investment of approximately 6 months. This project led directly to the creation of approximately 20 full-time jobs for a period of two years, creating more than man-days of employment. In addition to the decrease in non-revenue water and job creation achieved through this project, a number of additional benefits were achieved which are worthy of mention, namely: The number of consumer meters requiring reading and maintenance was greatly reduced. The relationship between council and their bulk consumers was greatly improved. Council has a full report for each large consumer indicating their water demand, all supply points, as-built drawings, and detailed photographs of all key customer water connections. The hydraulic condition of the network was assessed and council now has information on where improvements / enhancements are required. A better understanding of the location and condition of network isolating valves was established. All buried network valves were located and housed in proper valve boxes. Consumers can now isolate their water supply in case of an emergency, which was not previously possible in the majority of cases. Consumers were encouraged to repair leakage on their properties and operate more efficiently since they now know how much water they are actually consuming. Consumers are now able to accurately budget for their water use expenses. 195
 and includes Paarl and many of the small towns adjacent to Paarl.")
213 14 APPENDIX K: DRAKENSTEIN MUNICIPALITY WDM PROGRAMME 14.1 Background Drakenstein municipality is located in the Western Cape (see Figure 138) and includes Paarl and many of the small towns adjacent to Paarl. In 1999 the municipality faced a major water crisis due to the annual growth in water demand of 3.5% and a high level of NRW which stood at over 33%. Drakenstein municipality is a relatively small municipality with a total population in the region of , of which approximately reside in the main town of Paarl. Figure 138: Drakenstein municipality locality map As a result of the impending water demand crisis in 1999, the municipality decided to take action and implement measures to reduce its water consumption with particular emphasis on reducing wastage. This took the form of a comprehensive WDM programme which had six goals namely: Reducing the high percentage of non-revenue water; Reducing the high static water pressures; Reducing the high average daily demand; Increasing the total revenue collected by the municipality; 196
214 Providing a more constant and efficient service to consumers; Conserving water which was becoming increasingly scarce. Approximately 10% of the water used by Drakenstein municipality is derived from its own raw water sources, with the remaining 90% purchased as potable water from the City of Cape Town. The high level of NRW provided a major opportunity to decrease the municipality s water bill and at the same time reduce wastage. Interventions were wide-ranging although the introduction of advanced pressure management throughout the system provided the backbone to the overall water demand management programme. Over a period of approximately 14 years, Drakenstein municipality has significantly reduced its overall water consumption and greatly reduced the wastage. This reduction in demand has been achieved against a backdrop of increasing population and general growth within the municipality. This case study remains one of the best examples of what can be achieved through a dedicated team of water managers simply doing their jobs properly. Through their efforts, they have achieved a reduction in NRW from 33% in 1999 to 12% in July This clearly demonstrates that...it can be done! 14.2 How the savings were achieved This case study is one of the few case studies where accurate data have been recorded over the period of the whole water saving initiative. Records have been taken since the water saving initiative was introduced in 1999, which provides a comprehensive and reliable assessment of water consumption and the associated levels of non-revenue water over a 14- year implementation period. Water demand management is not an exact science and it cannot be implemented overnight. If it is implemented properly by dedicated and conscientious personnel who take a long-term view of the problem issues then great savings can be achieved. In the case of Drakenstein municipality, there was no single magic intervention that resulted in the huge savings achieved over the 14-year period. Instead, the combined efforts of a great many smaller interventions were eventually successful. It is for this reason that the Drakenstein municipality case study is considered so relevant and has been included in this publication. If it can succeed in Drakenstein municipality then a similar approach can also succeed elsewhere. To achieve the savings, numerous actions were taken which were all part and parcel of normal proper water supply management practices. The manager of the system, Mr Andre Kowalewski, was instrumental in achieving the savings and, while he does not attribute the success to any one specific action, he was willing to share his views on certain key issues 197
215 that he feels were of particular importance. The key issues identified by Mr Kowalewski are discussed below: Metering and block tariff structure By the end of the project all properties had been metered and new block tariff structure introduced. A rising block tariff structure was used to charge consumers for all water used. The tariff structure was designed to provide the initial consumption at a heavily subsidised rate, with the high volume users paying significantly more in order to discourage water use and at the same time subsidise the low volume users Public awareness and water savings devices Significant efforts were undertaken to educate the consumers on how to use water efficiently and, at the same time, create general awareness on the scarcity of water in the region. Various interventions were implemented inside the consumer properties to reduce wastage and water use, including basic plumbing repairs as well as the introduction of certain water saving devices. The project enjoyed a high level of support within the community due in part to the job creation through the use of labour-based construction methods using only local labour in conjunction with extensive stakeholder consultation Real-time flow and pressure monitoring One of the key components of the Drakenstein municipality WDM programme is the real-time monitoring of pressures and flows at various points in the reticulation system. Mr Kowalewski has installed real-time GSM/GPRS loggers at over 30 points in the system These are checked on a daily basis to ensure that the network is operating as intended. A typical pressure logging installation is shown in Figure 139 and a graph of the flow and pressure logging results for one specific zone are provided in Figure 140. The logging results have proved invaluable in picking up problems at an early stage in their development before they become critical. The system forms the backbone of Drakenstein municipality s preventative maintenance programme. 198

216 Figure 139: Typical pressure logging point in Drakenstein (Courtesy A Kowalewski) Figure 140: Real-time flow and pressure monitoring in Drakenstein (Courtesy A Kowalewski) 199
217 Refurbishment and leakage repair One of the key interventions of the water loss reduction programme was the identification of water leaks on the reticulation system, and a policy to repair all known leaks within an hour where possible. This rather ambitious target for repairing known and reported leaks has helped to reduce physical leakage in the system to one of the lowest in South Africa. In cases where pipes had to be replaced, only high-quality pipes were used and, in many cases, stainless steel fittings were used which greatly reduce future pipe bursts Advanced pressure management Advanced pressure management was first introduced into South Africa from the UK in the late 1990s after the world s first electronic pressure controllers were developed for the British Gas industry and later modified to suit the water industry. While the City of Johannesburg was the first major city in South Africa to recognise the benefits of advanced pressure management, Drakenstein municipality was one of the first to test the approach in the Cape (at same time as City of Cape Town). Drakenstein municipality approved and commissioned seven relatively large advanced pressure reduction installations ranging from 100mm diameter to 300mm, each fitted with flow modulated electronic controllers (see Figure 141). The cost of the pressure management installations (i.e. valves, pipework, chambers, and controllers) was approximately R3 million (± $0.5 mil), which was paid back through the savings within 5 months. Advanced pressure management remains one of the key focus areas for Drakenstein municipality and is considered an essential element of its overall WDM programme. It is often possible to judge the quality of management and workmanship in a municipality from the quality and cleanliness of the valve chambers within the reticulation system. The example in Figure 141 is an excellent case in point which shows a clean, bone dry and well maintained PRV installation where there is clearly attention to detail. Items worthy of note are the air valve, stainless steel specials, and the protective waxed tape used to protect the dismantling joint from corrosion. The use of a flow modulated controller with all pipework and fittings neatly positioned is also worthy of comment. This is an excellent installation, and one which would not be out of place in any of the world s best managed water utilities. It is certainly not the type of installation that is being promoted in many municipalities in South Africa where the overriding consideration is not the fitness for purpose or long-term sustainability, but the price. 200

218 Figure 141: Advanced pressure management installation in Drakenstein municipality Hydraulic modelling A locally developed pipe network hydraulic model based on the well-known EPANET model was used to identify areas of high pressure and to assist in sectorising the whole network into discrete pressure management zones. Real-time data logging was used to monitor the zones and pick up any unauthorised zone valve operations which, in turn, compromise the pressure management activities Conclusions The key goals of the water demand management strategy were met in full and the results achieved by this project have earned Drakenstein municipality numerous national and international awards for water use efficiency. The unacceptably high level of NRW was reduced from over 33% in 1999 to just 12% over a period of 14 years as shown in Figure

219 Figure 142: Results of the NRW assessment for Paarl (Courtesy A Kowalewski) The municipality currently boasts one of the best managed water supplies in South Africa, and one of the lowest levels of NRW in the country. Despite selling less water to its consumers, a combination of the new block tariff structure and the fact that the municipality was buying significantly less water from the City of Cape Town, resulted in a significant gain in net revenue which greatly outweighed the costs of the various interventions. The value of water savings over the 14-year period amounted to more than R700 million. The most impressive and significant statistic is the reduction in annual water use from 17.8Mm 3 /a in 1999 to 11.3Mm 3 /a in 2012 ensuring that the final goal of water conservation was fulfilled. The true impact of the WDM interventions is best shown when the long-term water demand for the main town of Paarl is analysed as shown in Figure 143. The water demands shown in this figure do not reflect the total demands for the whole of Drakenstein municipality since the boundaries have changed over the past 50 to 60 years. For this reason, only the demands for Paarl have been shown in the graph since the figures over the 50-year period are consistent and not influenced by the boundary changes. The actual savings for Paarl compared to the expected water demands are shown in Figure 144 which is self-explanatory. 202
 Figure")
")
220 Figure 143: Historical water demand for Paarl (Courtesy A Kowalewski) Figure 144: Reduction in water demand due to WDM activities (Courtesy A Kowalewski) 203
221 The success of the project is to a very large extent due to the enthusiasm and professionalism of several key individuals within the Drakenstein municipal water department together with the full support from the municipal managers and the relevant political decision makers. The key challenges faced by the technical personnel tasked with implementing the various interventions included obtaining funding, vandalism of infrastructure as well as sustaining buy-in from Council and municipal management. Another critical challenge related to the scarcity of competent technical staff and retaining them in a very competitive market. With respect to the pressure management interventions, the main challenges included the selection of the different pressure management zones and maintaining their integrity. The issue of which controllers (if any) to be used in the operation of the pressure management installations is insignificant when compared to the issue of maintaining the zone integrity which was achieved to a large extent by the use of continuous GSM or GPRS based pressure and flow logging at various strategic points throughout the reticulation. 204
222 15 APPENDIX L: COMMUNITY AWARENESS AND EDUCATION 15.1 Introduction For many years, community awareness and education has been considered the ugly, useless step child of water demand management. It has been the nice thing to do near the end of the financial year in order to spend the remaining unspent budgets, left over from lack of implementation on operations and maintenance or meter installations amongst many performance areas. A variety of arguments have been posited for the prevalence of this mindset particularly amongst technical professionals in the water sector. The most common of these have been the lack of tangible or observable water loss reduction as a result of community awareness as well as the general absence of proper monitoring and evaluation techniques, necessary to highlight the need for community awareness and to support or substantiate increased investment into this pillar of WC/WDM. The arguments put forward are logical, reasonable, and worthy of consideration; and do indeed highlight a number of short comings in the manner in which community awareness has been implemented in the past. Whilst valid, it is however also a reality that the South African society and consumer base is one which demands to be informed and involved in decision making. This is a critical expression of the present democratic era whose boundaries the citizens are constantly pushing in order to restore the power to the people on all frontiers so to speak; and as a means of keeping all tiers of Government accountable to the citizens, for all actions taken on their behalf. Communication has thus become the pivot key to sustainable development in which people, who are at the centre of societal transformation, take ownership of development and the maintenance thereof. This was never more pertinent than when it comes to water, one of the most basic resources, which is responsible for current and future prosperity in its varying forms. This chapter thus aims to address some of the perceptions noted above and elucidates some of the challenges pertaining to the implementation of community awareness and education. This chapter will further deal with the varying mediums of communication, and outline what is required for successful community engagement on water conservation in future. The implementation of community awareness is by no means for the faint hearted. The perception that public engagement, fondly known to technocrats as the soft issues, is a secondary consideration after other more important interventions is not only deceptive but also very dangerous. The case of what can be called Soweto vs City of Johannesburg in dispute over prepaid meters and their constitutionality or lack thereof and the sufficiency of 205
223 the 6Kl free basic allocation is another classic example of the harm that can be caused by a break in communication. There was nothing soft or easy about this case; nor dealing with angry citizens after the prepaid meters had been installed without complete buy-in and support from the residents. There are many other examples where costly investments have been made by municipalities with good intentions in order to increase cost recovery and water use control and, in turn, improve maintenance of infrastructure and service delivery. Many have been thwarted before completion and set the municipalities back years before they can recover from the problems and resume efficient provision of services. These interventions are often well intentioned and well substantiated by the conditions of the municipalities, which can vary from old dilapidated infrastructure which must be refurbished, huge water losses with no means to recover the costs of service provision or mere shortage of resources which necessitate restrictions. All these reasons for undertaking specific technical interventions are valid however, if the consumers do not know nor understand these reasons, such interventions can merely come across as yet another thing the municipalities are doing to make life difficult for consumers or to increase the cost of living. Proper consumer engagement is therefore crucial in mitigating some of the difficulties mentioned and whilst not an easy task, the rewards can be substantial. It is important to acknowledge that not all water loss or service delivery problems can be rectified through technical interventions. Figure 145 depicts a community problem in which crime has made a significant contribution to water losses in the area. The picture was taken in a neighbourhood where many brass taps had been stolen over one night resulting in substantial water losses. This case was not the first of its kind in this community and surrounding areas. The immediate problem could be solved through replacing the taps however the root is a community issue which must be dealt with by the community. The reality is that the community has allowed a scrap-yard to exist which purchases stolen goods. What was most astounding about this case is that the community members had knowledge of the perpetrators, and could pinpoint where the taps had been sold. Through engagement with the community policing forums in the area, the taps were located (see Figure 146) and refitted. What is crucial is that through community engagement and making people aware and more cognisant of the issues, they in turn can assist in rectifying the problems in partnership with the municipalities as illustrated by this case study. The ostrich mentality of ignoring problems and hoping they will go away will not suffice in the context of increasing water scarcity and service challenges in South Africa. Even under conditions of imperfect service delivery, engaging consumers and obtaining their cooperation whilst other issues are 206


224 being dealt with is a prudent and, in the long term, a more cost-effective and sustainable manner of achieving the desired results. Figure 145: Impact of stolen taps on community Figure 146: recovery of stolen taps by community support Municipalities are unique and comprise unique communities with a specific history, socioeconomic conditions and political landscape. Within this context there is no one size fits all intervention. Lessons can be taken from municipalities which have successfully implemented water loss reduction initiatives however; the application of the methodologies will differ. Before implementation can commence, it is crucial for the implementer to ask a number of questions which are as follows: Why? It is important to establish the purpose of the community engagement which must be undertaken. Is it geared at informing people regarding certain events, is it to educate the consumers or is it to involve them in a specific decision making process, to get their inputs or feedback? The why will inform the how of your intervention, in other words what form of engagement will take place and what medium of communication will be utilised. What? The next step will be to establish the message to be disseminated to the consumers. If the goal of the engagement is specifically education and awareness then it must be clear what the key messages will be. The idea is to focus on a few key issues and make that the overall theme of the education and awareness. The messages must also be grounded on proper research. The implementer must not simply assume the topic of engagement; the messages must be based on the reality of the community. There is no point telling consumers to save 207
225 water in an area where consumers are not getting water. A more appropriate topic may be exploring other avenues of obtaining and storing water such as rainwater harvesting. Who? The what of the intervention discussed above will inform the who. Once the pertinent messages have been established, the target audience for the message must be established which will, in turn, also determine how the message will be disseminated. It is crucial to be familiar with the demographics in an area such as prominent languages and ethnic cultures in an area, literacy levels, levels of employment and which segment of the population is most acutely affected by the topic of education. For instance, there is no point handing out simply handing out pamphlets with lots of writing on them if a large portion of the target audience is illiterate. Knowing the target audience will assist in tailoring existing material or creating new material to suite the situation. How? Based on the target audience, the implementer can now determine how the message will be disseminated. There are several methods which are commonly used for education and awareness purposes, which are described below Importance of community awareness and education As a point of departure, it is vital to understand why community awareness is necessary, specifically in the context of WC/WDM as a key strategy for non-revenue water reduction. In recent years WC/WDM has taken centre stage in the fight against the ever increasing scarcity of South Africa s most precious natural resource. High levels of water losses coupled with low levels of payment for services and poor quality infrastructure have ushered in an era of intense debate regarding how best to preserve this resource to aid future development. Whilst South Africa is world renowned for strategic planning and policy development, the implementation of water demand management remains the foremost challenge in improving the delivery of services to the ±5 million South African citizens who remain without a basic consistent supply of water and sanitary facilities. Some of the key challenges in terms of implementation rest with the transfer and development of skills within the water sector and the integration of community education and involvement in decision making, which are essential in developing relevant strategies that address the most pertinent issues. It is no longer adequate, proper nor effective for professionals to develop strategies based on assumptions and scientific calculations in the obscurity of their offices. The current economic 208
226 climate demands a move towards cost-effective problem solving which requires proper needs assessments to be conducted and strategies which address the relevant issues to avoid unnecessary duplication of efforts. Numerous papers have been written worldwide which assess and advocate various water demand management interventions that play a significant role in decreasing water losses; however few, if any, present a holistic perspective or take into account the importance of active community participation in the successful implementation of sustainable water demand management. Lack of community support has proven to be one of the key factors in the slow and inefficient delivery of services often comprising the vandalism of much needed infrastructure and essential measurement tools, as well as a general disregard for the manner in which water is utilised. This leads to the failure of many potentially successful water demand management projects. Having explored the importance of community engagement in WC/WDM the objectives for this engagement must be clear. Communicating is not undertaken merely for communicating s sake but to achieve certain end results. The following are considered to be some of the key reasons why it is critical to communicate and educate the communities regarding water conservation: Creating an informed public on efficient water use It has often been said that knowledge is power, the premise being that education enables informed decision making and hopefully better choices regarding the subject of information. Understanding is a potent motivator of human behaviour (Fiske, 2004) and making sure that people are informed regarding efficient water use can play a critical role in the acculturation of communities. By communicating efficient water use, the old culture of bad practices comes into contact with the new efficient culture which catalyses the process of migration from one culture to the next. This of course is not an overnight process, however as the saying goes, the journey of a thousand miles is commenced with a single step. Establishing partnerships between the community and the municipality One of the observed tragedies when it comes to the manner in which municipalities engage with communities, is the gaping hole of the us and them dichotomy which is often left unbridged. Municipalities make large investments into installing smart devices to monitor and control water use and bill consumers, whilst communities invest time and energy into burning tires, placing large stones on the roads and creating imaginative placards; all aimed at cursing the municipalities for lack of service delivery. Although both parties have a unique and in many cases justified perspective on service delivery issues and what is required to 209
227 effect change, more appropriate solutions which do not involve unnecessary expenditure or destruction of sorely needed infrastructure could be possible if a partnership is forged between the communities and municipalities. Communities are a valuable on-the-ground resource for municipalities which can be utilised to improve the state of the infrastructure through reporting of leakage for example, which is a form of passive leak detection. Education and awareness can thus help to establish such a partnership which must be enforced through continuous engagement. As with any relationship, this partnership must be nurtured and strengthened. Hit-and-run, once-off programmes will not be effective in achieving this, as such programmes can start to foster mistrust and scepticism if communities feel that they are engaged and exploited as a means to an end. Promoting the municipality and its activities in the community As mentioned previously, one of the key outcomes of the engagement between the municipalities and communities is to not only transmit information to people which is the purpose of education and awareness, but also community participation which is geared at involving communities in decision making processes. WC/WDM by its very nature makes room for both forms of community engagement. Education is vital in helping people to understand the activities and projects the municipalities are implementing to reduce water losses but involvement in decision making is also vital so that the projects do just remain the municipalities but become integrated into the lives of those they are meant to benefit. Classic cases depicting this kind of engagement are the Emfuleni and Khayelitsha pressure management installations where schools competitions were organised to allow the community to select a suitable design for the chamber. In the case of the Khayelitsha installation the original design shown in Figure 147 was replaced about 10 years later with the design shown in Figure 148. By painting the chambers and drawing attention to them, they become a recognised landmark to the communities they serve and by involving the communities in the design, they tend not to be vandalised. In the case of the large Sebokeng installation shown in Figure 149, the design was part of a schools competition where the pupil providing the winning design received a small prize as did the school where the pupil was based (see Figure 150). These two award-winning installations have been running for 9 years and 12 years respectively, and have never been vandalised in any way by community members. 210

 (courtesy City of")
228 Figure 147: Initial Khayelitsha installation shortly after completion Figure 148: Khayelitsha installation after "face-lift) (courtesy City of Cape Town) 211


229 Figure 149: The Sebokeng installation showing winning design Figure 150: Prize giving for the Sebokeng Installation design 212
230 Promoting and enforcing water wise behaviour The only manner in which the prevailing inefficient water use practices can be altered is through disseminating the correct information. Regulations 509 of 2001 pertaining to WC/WDM specify that municipalities have a responsibility to educate consumers in respect of effective water use. The promotion of water efficient use must precede enforcement of municipal bylaws in order for consumers to understand the rules of engagement however; promotion alone is limited in effectiveness if not followed by enforcement. The proverbial carrot must be countered by a stick in order to for tangible water loss reduction to be realised. In many municipalities, the availability of human resources to enforce bylaws as well as the institutional knowledge to do so has posed a huge challenge and a serious impediment to the municipalities complying with the regulations. This element is however crucial as without consequence, water conservation will remain in the realm of social responsibility as opposed to being seen as a responsibility and obligation every citizen must undertake. Encouraging ownership of water loss reduction and infrastructure Last but not least of the long-term objectives of demand management is ensuring that consumers take responsibility for water conservation and the infrastructure installed by the municipality. The water services which are provided are for the consumers, they are the direct beneficiaries of the infrastructure and as such; should play a role in reporting faults and directing municipal resources to where they are required. Communities are a valuable asset and possess local knowledge which can at times supplement or cover over limited institutional memory of municipal personnel. It is common knowledge that staff turnover in many municipalities around the country is very high which at times can pose difficulties in terms of locating and operating infrastructure for emergencies or routine maintenance. The participation of consumers is especially vital in such cases in order to mitigate system failure through timely identification of problems Door to door education and awareness This method is particularly useful in cases where the levels of literacy in an area are low or a large segment of the populations has limitations in mobility either due to age or availability and economic affordability of transportation. This method is also a fantastic vehicle for employment creation and community upliftment. Identifying and utilising people from the affected community to implement the programme is a good way of obtaining community cooperation, and assists in building trust between the community and the municipality. It also 213


231 means that the existing knowledge and skills in the community are effectively utilised. This approach has been used successfully in many municipalities including Emfuleni, Randfontein as depicted in Figure 151 and Figure 152. Door-to-door education and awareness also increases the visibility of the municipality in the community, which can raise consumer confidence and also present an easy channel through which to communicate issues to the municipality. Utilising this approach has also got many other added benefits, including visual leak detection through the people that are already on the ground moving from house to house. It is generally very cost-effective as transport fees are usually not necessary if the programmes are ward based. Figure 151: Community education and awareness in Emfuleni Figure 152: Community education and awareness in Randfontein 15.4 Public meetings and workshops Public meetings, gatherings or organised workshops where whole communities are invited are another avenue for disseminating information. This method is particularly useful in informing and educating large groups of people at once, which may be necessary depending on the urgency of the information which must be disseminated. Usually these gatherings are seen as events by the community which helps to create the necessary publicity and in interest in the programme to trigger greater participation from community members. This avenue or method of communication should, however, be used with care depending on the sensitivity of the context. The topics of discussion must be made clear from the outset to avoid making the meetings a venting session for a host of other community issues. Nevertheless, this method is a very useful tool in community education and awareness and generally if conducted properly, communities can be receptive and responsive in helping to drive water conservation. Despite popular belief, communities are willing and able to 214


232 participate in municipal activities, and there is an observed increasing interest in engaging on water issues due to the importance of the resources as depicted in Figure 153 and Figure 154 showing the attendance of water conservation workshops undertaken in Evaton, one of the townships located in Emfuleni municipality. Figure 153: Public meetings in Sebokeng Figure 154: Public meetings in Evaton 15.5 Pamphlets and posters and billboards The use of pamphlets, posters and billboards is common in education and awareness campaigns and very effective when utilised appropriately. In the development of such material, care must be taken that the information is presented in a manner which is comprehensible to the target audience. This includes using the appropriate languages and making sure that the writing is simple, clear, uncluttered, precise and minimal. Using pictorial illustrations is often very helpful in communicating the message and helping people to relate to the information presented. Municipalities wishing to implement community must be realistic regarding the timeframes in which they expect to see results. Building relationships with communities is not an overnight exercise. It requires commitment and persistence. It is important to note that community awareness interventions are not intended as short-term, hit-and-run initiatives but rather as long-term strategies to address water losses. Wasteful habits that have been entrenched over years and decades will require a relentless process of re-acculturation to alter. Implementers should also be mindful of what is happening in the municipality before commencing with such programmes. It is not helpful, for example; to begin a community awareness programme right before national or local elections as this is often misconstrued 215
233 as a ploy to garner votes for certain political parties. It is thus crucial that such interventions are appropriately timed and given sufficient time to properly monitor the process Schools awareness and leak reduction Schools have been found to be an essential avenue for the promotion of water conservation as significant consumers and contributors to the demand for water. Instilling good values and habits at the foundation developmental stage is invaluable as the future leaders will get a good head start in practicing wise water use behaviours and teach them to others. Young learners are also a particularly receptive target for WC/WDM education and awareness as they would not have accumulated the inefficient habits practiced by adults over years of entrenchment. Based on schools programmes undertaken previously, some of the key challenges and issues facing schools with regards to WC/WDM are as follows: High levels of leakage Water loss through leakage appears to be a serious problem for schools particularly those found in township settlements as shown in Figure 155, Figure 156, Figure 157, and Figure 158. A number of the schools visited on previous programmes exhibited high levels of visible leakage. Maintenance of internal plumbing fittings appears to be a challenge due to ongoing vandalism and theft of water fittings, insufficient funding, and poor workmanship by the plumbers that are obtained to undertake repairs in many of the schools. What appeared to be the most significant source of water losses were the toilets some of which were leaking profusely over long periods. In this respect the schools expressed their desire for greater support and guidance from both the municipalities and the District Department of Education to address these challenges. It is, however, important to note that in many municipalities, a large portion of the schools are section 21 schools, which are allocated with a maintenance budget utilised at their own discretion. Many schools complain that the budget is not sufficient to address all the maintenance needs however; the majority of leaks found in the schools do not require huge capital expenditure. In most cases, simply replacing the tap and toilet washers suffices. 216


234 Figure 155: Leaking toilet in school Figure 156: Vandalised toilet in school Figure 157:Leaking tap in school Figure 158: Leaking toilet fitting in school Automatic flushing urinals also pose a serious problem in terms of water losses as shown in Figure 159 and Figure 160. The presence of these urinals usually results in high water bills even during school holidays as they continue to flush regardless of actual use. 217


235 Figure 159: Automatic flushing urinal in school Figure 160: leaking urinal in school Inaccurate and billing and broken meters Billing and metering is a contentious issue in many municipalities and if not conducted properly, negatively affects the willingness of consumers to pay for services. Before the commencement of the assessments undertaken in schools in previous programmes, one years consumption data was requested from the municipalities for all the schools participating in the programmes. It soon became apparent that most of the billing was based on estimates and not actual meter readings which was a matter of great concern for the schools. The meter investigations which formed part of the assessment confirmed this finding with the meters generally being in very poor condition or illegible (see Figure 161 and Figure 162). The schools representatives present at the discussion sessions mentioned that the meters had been reported to the municipalities however no response was received. These inaccuracies in the billing of schools and the lack of response to meter complaints will be to the detriment of many municipalities in future if left to continue unabated. In order to improve the communication between the schools and the municipalities, and to ensure effective cost recovery; municipal response to reported problems must improve. 218


236 Figure 161: Leaking school meter Figure 162: Illegible school meter Poor response and communication with the municipality As mentioned previously, communication between the municipalities and the schools has been perceived to be generally lacking. The lack of responsiveness or rather protracted response to billing related queries has also contributed to the tension existing between the schools and numerous municipalities. Constant fruitless referrals were noted to be time consuming and disheartening for the schools resulting in further lack of confidence in the municipalities. A coherent support structure is required from the municipalities to assist the schools in resolving billing matters. Relatively low levels of water conservation awareness Based on the scores attained in the score card assessments undertaken in numerous schools, it is evident that more intensive water conservation and awareness education is required to reduce the water losses and to change the inefficient consumption patterns in some of the schools. General observations made during the course of the assessments included the following: Irrigation of school gardens during the midday heat using potable water Leaks that were left unattended for long periods of time Very limited rainwater harvesting School management with no knowledge of the location of the school meter Frequent occurrence of internal plumbing leakage due to vandalism 219


237 General wastage of water by learners (see Figure 163) Poor hygiene conditions (see Figure 164) Figure 163: Inefficient water use by learners Figure 164: Unhygienic conditions in schools In general, it has been observed that water conservation is a culture which must be cultivated in the schools. The state of the schools often reflects the leadership of the schools and the participation of the whole school community including principals, educators, learners and school governing bodies and parents. Whilst some schools display inefficient water use and poor hygiene conditions others existing within the same socio economic conditions exhibit exemplary practices a seen in Figure 165 and Figure 166, and it comes down to the efforts and leadership of the parents, educators and school management where the same message is communicated to learners at school and at home. Figure 165: Water wise mural at school Figure 166: Efficient drip irrigation 220
238 Despite the seemingly dire picture painted by the challenges outlined above, it must be noted that there are many schools which are implementing admirable water conservation strategies, including keeping buckets of water in the classrooms to increase monitoring during teaching time, use of boreholes for irrigation of food gardens used for feeding schemes, rainwater harvesting and self-initiated water conservation workshops on spring days when children would habitually play with water to celebrate the day. These have been some of the outcomes of the schools WC/WDM campaigns implemented previously and illustrate the value of engagement with schools. It is, however, recommended that such programmes should not focus only on the learners. Water conservation is a whole school effort, and can only be sustained through the participation of every player. The participation of the Department of Education is also invaluable. More recently, it has been found that in certain regions, the Department of Education has established a system where schools are obligated to provide their own meter readings on a monthly basis. This is a very positive in raising the profile of water management in this sector, and has significantly raised the awareness of decision makers in the schools, who now take greater cognisance of the consumption patterns in the schools. In undertaking schools awareness campaigns, the following should be considered: 1) Whole school participation: Each segment of the school community has a crucial role to play in water conservation, and as such should not be left behind. As mentioned previously, the focus should not only remain on the learners not taking away from the fact that they are critical component. Huge benefit can be derived from engaging with the principals and governing bodies as the school management structures which set the rules and drive WC/WDM. The general assistants who deal with maintenance issues on a daily basis should not be omitted from such campaigns. One of the observations mentioned is that of the leakage which is left unattended for long periods of time. Most of the leakage does not require highly technical expertise and can be conducted by the general assistants if basic training is provided. Future campaigns could perhaps provide such training to reduce the persistence of basic leakage. Educators are the custodians of knowledge and how that knowledge is communicated in the classroom. Focussing on the learners alone limits the opportunities for building a culture of water conservation. It is thus crucial that the educators are provided with the knowledge and tools to continue the acculturation process. 221
239 2) Schools competitions: Schools competitions have been found to be very effective motivators of water conservation in schools. They allow both learners and educators to engage vigorously with the water conservation issues and to compare their performance against that of other schools which in itself creates greater awareness Use of media in creating awareness The media is powerful tool for driving public participation as well as education and awareness. It engages a variety of senses and if utilised well, can allow the public to interact with projects and with municipalities and provide feedback on their concerns and issues. The numerous forms of engagement mentioned previously primarily target individuals which are at home during the day and thus greatly impact on the peak demand periods, however, in water conservation and demand management related campaigns, it is just as critical that household owners which are paying for water services also be reached. This segment of the population is typically at work during the day, and forms the very important tax base which contributes to the economic viability of the country. Door-to-door education and awareness or workshops held during the day cannot reach this target market, therefore other mediums of communication must be considered. In this respect, local community radio stations can be used to target the working population. This type of media is widely accessible to most people, and covers the all bases in terms of literacy levels because no reading is required. Local newspapers can also be used to reach the working population, and are a popular and affordable means of communication both for the target consumers and implementing agents. One of the most potent and effective forms of communication is visual. When educating consumers on water conservation, it has been observed that people respond very positively to mediums such as powerpoint presentations where pictures are shown of the behaviours which must be altered. It also makes the topic more relatable for consumers when they can visualise the topics of discussion. Television is thus a very effective medium for disseminating information as it combines both visual and auditory mediums of communication. The Department of Water Affairs advertisement on the War on Leaks campaign is a great illustration of the impact of television media. The advertisement had to be removed shortly after it was released due to the influx of callers reporting internal leaks to 222
240 DWA. This is however a very expensive form of communication and often beyond the reach of the day-to-day campaigns undertaken by municipalities. Billboards are regularly utilised to a similar effect and are a more economical medium to use. Irrespective of the mediums used to communicate, it is important that the message be clear and uncluttered. Due to the fact the media is such a powerful tool for communication, it also has the potential to create confusion and the message can be distorted if not formulated properly. It thus crucial to the keep the messages short, concise, clear and to the point. The educational material, particularly for written media, must be easily understood. The idea is to keep the language simple and un-convoluted to ensure that the messages are received loud and clear. WC/WDM is a very wide field which involves a multitude of topics ranging from rainwater harvesting to pressure management. In education and awareness it is crucial to focus the themes or topics for the awareness, based on the crucial issues identified in the community in order to aid assimilation of the information. The more the merrier approach does not apply in this instance. Consumers must be left with a few key messages to process at any one time. The education and awareness can therefore be themed and undertaken in phases where the messages can be changed periodically Role of politicians and councillors The role of the political representatives of any community in water conservation and demand management projects cannot be stressed enough. Many a project has seen success or failure on the basis of the participation of councillors and ward committee members and their support or opposition to programmes. Ward councillors and tribal authorities are often the gatekeepers to communities as elected or cultural representatives and should be the starting point in gaining entry to any community. Communities also look up to these individuals as the example and expression of democracy and their right to choose and participate in the affairs of the land. It is thus crucial that these individuals are engaged and involved at the commencement of any community based programme to avoid costly and unnecessary project delays. This component has proven to be particularly challenging for most municipalities as often, there is a tug of war between making popular decisions which lean towards everything for free for all and the unpopular but difficult decisions which are required to ensure that water services are sustainable. This may include increase of water tariffs, implementation of 223
241 pressure management, which reduces the water pressures at certain times, or perhaps implementation of restrictions, such as hose pipe bans in areas which are struggling with the availability of water resources. The fact is that these difficult decisions can be made and successfully implemented with proper consultation, strong leadership from the political and tribal authorities and purposeful efforts towards common objectives. This has been demonstrated time and time again in municipalities in the Eastern Cape, such as Nelson Mandela Bay and Beaufort West in the Western Cape amongst many, which have been plagued by droughts and water shortages. It is therefore crucial that political and traditional leaders play their part in WC/WDM programmes. Increased training and capacity building for these leaders is sorely required to improve their understanding of the water issues and to support their decision making. Only what is known can be managed and improved on and the same applies to the decision makers in municipalities Monitoring and evaluation One of the main concerns related to education and awareness has frequently been how these initiatives can be monitored and evaluated. It is important to remember that communication is not a one way stream of information. It depends on a cycle of input and feedback. In this regard, undertaking Knowledge Attitudes and Perception (KAP) Surveys can be a useful tool. Although not without their flaws, if they are undertaken prior to the commencement of a community awareness programme at the mid period of implementation and at the conclusion of the programme; they can provide very valuable feedback regarding the effectiveness of the programme and how the communities feel about the initiative. In cases where an area is discrete and fitted with a bulk meter, it becomes technically possible to monitor the impact of the interventions through the bulk meters, provided there are no other interventions being undertaken at the same time. Figure 167 shows the consumption patterns in such an area, where a community awareness programme was implemented in the absence of other technical interventions. Through community awareness conducted over a 12 month period, there was a reduction of 6m³/h in the minimum night flow as residents began to fix their internal plumbing leakage. 224

242 Figure 167: Graph of consumption in a discrete zone Like a cake which is baked with a pinch of salt to bring out the sweetness; the main benefit of community awareness programmes is to enhance and assist with the sustainability of technical interventions. Their true value lies in opening the channels of communication between communities and municipalities, building a culture of ownership of municipal projects and thus protecting costly investments in infrastructure. It is indeed very difficult to quantify the potential savings which can be made through such interventions however, the benefits are often acknowledged retrospectively when damage control is conducted on projects which have been terminated due to lack of engagement. Following the example set by municipalities such as City of Cape Town and Emfuleni municipality amongst many municipalities, community awareness has assisted in protecting big pressure management installations as well as the identification over water related problems over a one year period through ward based water conservation warriors conducting visual leak detection. 225
243 15.10 Lessons learnt Capacity retention A key challenge in many of the municipalities is how to retain the capacity developed during the implementation of water projects. The projects are implemented as short-term solutions with little thought for their continuance in the future. Should the status quo remain unchanged, little progress will be made in improving the delivery of services and furthermore the same problems will continue to persist. Money spent on perpetual training programmes can be more effectively utilised to retain the individuals already trained and directed to the implementation and operation of other water demand management measures that are required to minimise the water losses. Vision and leadership Retaining capacity without clear vision and leadership can prove fruitless. The resources developed through water conservation education and training must be utilised for their intended purpose and for this to take place proper guidance and continuous monitoring and evaluation from the municipality leadership is required. If this can be achieved, there is no reason why lack of capacity should remain an obstacle to service delivery. Consistency and sustained effort Both training and capacity building and community awareness programmes share one common vital condition for success; they both require consistent and sustained effort. So often momentum is built up during the implementation period of the projects only to be deflated in a matter of a few months when the implementing agents leave the system. This is a concern because unlike technical programmes, initiatives that involve people cannot be easily rectified or recommissioned. An extensive investment of time is required to open the channels of communication between communities and municipalities, but more importantly they require a degree of trust and goodwill between the two parties for the re-acculturation process to take place. The culture of short term hit and run interventions undermines open communication and the process of establishing efficient water use practices. If these interventions are undertaken in such a manner, the communities cannot be expected to display any persevering changes in behaviour. Words must be supported by visible action with the municipalities taking an exemplary stand in this regard. Likewise, building capacity 226
244 requires mentorship and consistent effort to establish the experience necessary for continued successful implementation of water demand management initiatives. Communities Demand management is often conceptualised as a model comprising a wide range of technical interventions requiring sophisticated methods and equipment. Communities are an essential resource for the municipality notwithstanding the fact that 80% of the implementation of demand management takes place at grass roots, in individual homes where the consumers must adapt their water use practices to promote economic efficiency and sustainability of the resource. They must be taken on board and provided with the necessary skills to take ownership for their progress. Communication The provision of clear realistic information is essential to healthy communication between municipalities and communities. Particularly when it comes to the provision of basic services such as water which is often a fairly sensitive issue, unrealistic promises of free services and short delivery times are neither helpful nor sustainable. Effective demand management requires the provision of consistent, realistic and honest information to consumers that allows them to make informed decisions. 227
245 16 APPENDIX M: HOUSEHOLD WATER USE (APPARENT LOSSES) The previous section highlighted the importance of dealing with visible leaks which are generally obvious and are often reported within hours of occurring. A slightly less obvious but nonetheless important issue concerns water leakage on actual residential properties. In many countries, such leakage is ignored by the water supplier since it is the problem of the customer who is metered and billed for any water passing through their water meter. In South Africa, however, this is not always the case and sometimes household leakage after the customer meter becomes the problem of the municipality where payment for services does not occur. To understand this issue it is important to have a reasonable understanding of how much water is used by a typical household. Obviously the water use in a household can be influenced by a number of factors including: Size of the property Number of people living in the property Gardens and/or swimming pools High or low income area Water pressure and 24-hour supply Although there is no hard and fast rule regarding domestic water use, the following numbers are Ronnie s Rule of Thumb and can be helpful as a rough guide to what water use one can expect from certain properties: Small- to medium-sized houses in low- to middle-income areas without large gardens or pools typical water use is 10m 3 /month to 15m 3 /month Larger properties in medium- to high-income areas with some garden irrigation but no pools typical water use 20m 3 /month to 30m 3 /month Larger properties with significant garden irrigation and/or pool use typical water use of 50m 3 /month to 100m 3 /month While these numbers are clearly not universally applicable, they often provide a realistic estimate of residential water use in many areas assuming that there is little or no internal household leakage. In cases where there is household leakage, the monthly water use can increase significantly and is particularly problematic in areas with low levels of payment. A typical example of such an area is shown in Figure

246 Figure 168: Garden watering in peri-urban area with low payment levels In the above pictured area, the average monthly water use increased from the expected 10m 3 /month on average to more than 60m 3 /month due to the fact that there is virtually no payment for water use which in turn encourages wasteful practices such as unchecked garden irrigation. If proper water accounts were being generated and the customers were paying for the water they use, the average consumption would drop to expected levels. This issue is clearly highlighted in Figure 169 which shows a house in a middle to high income area which has a monthly water consumption of only 15m 3 /month. The low monthly water consumption is due mainly to the absence of any garden irrigation together with full payment for all water used. 229

247 Figure 169: House in middle- to high-income area with low water consumption The low water use for the house shown in Figure 169 dispels the myth that water use in larger houses with many bathrooms etc. will always be higher than smaller houses in lower income areas. The water use is not always a function of the size of property or the number of bathrooms, and is often influenced by the condition of the internal plumbing fittings and the owner s appreciation of the value and scarcity of water. Another interesting example to highlight typical domestic water use is provided in Figure 170 which shows two houses in a middle-income area which have normal sized families living in the same lifestyle. 230
 New water meters were installed for all properties in the zone in which the two houses")

248 Figure 170: Two houses in same area with different water consumption (Z Siqalaba) Figure 171: Water meter readings for the two properties in previous figure (Z Siqalaba) New water meters were installed for all properties in the zone in which the two houses shown in Figure 170 are located. The meters at all houses were read for the first time after approximately 3 months and the actual meter readings are shown in Figure 171. The house on the left had used 42m 3 in the 3-month period which is in line with expectations. The house 231

249 on the right, however, had used over 600m 3 in the same period (i.e. over 200m 3 /month) which is clearly well outside the expected range of monthly water use. In this area it was found that 80% of the properties used less than 15m 3 /month while the remaining 20% used more than the combined water use of the other 80% of properties. Many properties were found to be using in excess of 100m 3 /month and in virtually all cases the excessive water use was caused by some form of internal plumbing leak. In the case of the property using over 200m 3 /month, the problem was traced to a leaking tap at the rear of the property as shown in Figure 172. In this case, the owner was not paying for water and found it easier and cheaper to simply attach a hosepipe to the tap rather than replace the washer. In effect, the water service provider was covering the cost of more than R1 000 per month because the owner was unwilling to pay for a 20 cent washer. Figure 172: Leaking tap "repair" at one property (courtesy Zama Siqalaba) The key message from this example is that in some cases it is important to monitor the domestic water use especially in areas where residents may not be paying for the water used or are paying on a fixed rate tariff. In such cases there is often little or no incentive for residents to save water and this often leads to irresponsible and unacceptable water use. Such problems require both technical support as well as education and awareness. By undertaking a simple check of the average monthly water use in an area, it is possible to identify whether or not there is a leakage problem after which action can be taken if necessary. 232
250 17 APPENDIX N: SECTORISING 17.1 General Sectorising is basically the process of splitting a larger water reticulation system into smaller more manageable chunks, which provide greater control over what is happening in the system. The aim of sectorising is to create small zones which are easier to manage than large zones. The smaller the zone, the more control the water manager has over what happens in the area, however, with every benefit comes some problem and in the case of zones, the biggest issue is the maintenance of the zone. Setting up new zones is a time consuming and often expensive process. Each zone must be discrete for it to operate as a zone and will normally involve a number of valves, inlet supplies and sometimes outlets to an adjacent zone. If any of the boundary valves are opened or closed by mistake (sometimes on purpose) the zone can be compromised and will no longer act as a zone. By far, the biggest problem issue facing water suppliers throughout the world is the continual breaching of zones within the system often by officials from the water supplier. Very few water suppliers have any system in place to monitor and manage their zones properly and without such monitoring, the supplier is often unaware that the zone has been compromised and is no longer functioning properly. Figure 173: Typical zone and district layout 233
251 Sectorising a water reticulation system is one of the most important and useful aspects of any WDM plan. Before undertaking any form of sectorising, however, it must always be remembered that creating a new zone with proper meters and monitoring equipment can be expensive, and every zone requires some element of maintenance which will continue indefinitely. The advantages of numerous small zones must always be weighed up against the establishment costs and the ongoing maintenance costs. It is sometimes not appropriate to create too many small zones when one or two larger zones are all that is needed. If a zone does not have a serious leakage problem and has a relatively uniform pressure distribution, then there may be little benefit in cutting it up into smaller pieces each of which should ideally have its own meter and monitoring equipment. It is therefore recommended, that when sectorising a new area, a few large zones should initially be created and monitored. If leakage is found to be a serious problem or the pressure profile warrants a smaller zone, then the larger zone should be cut up into smaller sections. If no leakage problem is evident and pressure is not an issue, then the large zone can remain since there will be no real benefit from creating smaller zones and in fact they will just add to the costs of running the system. This concept is highlighted in Figure 174 and Figure 175 which show the original and final sectorising layout for Halifax in Canada. Initially only two large zones were established to manage pressure and leakage. After several years, the large zones were cut up into 8 smaller zones to help manage the pressure and leakage. This phased approach to sectorising is often the best approach as it gives the water supplier time to assess whether or not it is really worthwhile cutting into small areas. When establishing zones in an area, there are a few general rules of thumb that can be considered namely: Zones should be homogeneous where possible and avoid mixed residential with industrial. Zones should be established to help manage leakage and water use in the system and not simply because some book or manual has indicated that they are necessary and that they should not be larger than customers. Sectorising should commence at the outskirts of an area and gradually work back towards the central business district. It is often not possible to sectorise the Central Business District due to the number of cross-boundary connections and hidden pipes etc. The CBD is often left as an unsectorised area as it is often not possible or cost effective to achieve proper sectorising of such areas. 234

252 Sectorising should try to follow the boundaries created by roads, rivers railways etc. If such features are used to guide the sectors, they tend to be easier to operate and maintain. Figure 174: Initial sectorising of Halifax (courtesy Ken Brothers) 235
")
253 Figure 175: Final sectorising for Halifax (courtesy Ken Brothers) 236

254 Figure 176: Typical sectorising following roads, rivers and railways Boundary valves remain the most common problem issue facing water suppliers who are trying to manage zones in their system. A simple example of such a problem is shown in Figure 177. It can be seen that the water supply to Point A is a short distance from the inlet point and as such the pressure is likely to be close to the inlet pressure assuming the elevations are similar. As a result of a fire in the zone close to Point A 5 internal zone valves are closed in order to isolate the area in the vicinity of the leak in order to effect a repair as shown in Figure 178. The leak is repaired late at night and the repair team are particularly lazy and only open one of the 5 vales which they closed in order to restore water to all residents. As a result, the water must travel a longer path through the network in order to reach Point A as shown in Figure 179. There are now 4 internal network valves which are closed that should be open resulting in low pressure problems in the vicinity of Point A. Consumers in the area complain about low pressures and the easiest solution is to increase the system pressure at the inlet rather than try to find closed valves in the network which does take considerable time and effort. This is the typical situation facing most water suppliers who do not check regularly for closed network valves or open boundary valves 237
255 Figure 177: Sectorised zone showing flow path of supply to Point A Figure 178: Leak near Point A showing valves closed for repair 238

256 Figure 179: Flow path to Point A after leak repair Another potentially more serious problem involves the unauthorised opening of boundary valves between adjacent pressure zones. Figure 181 shows the original pressure profile for the two adjacent zones which are on a steep incline. A PRV has been installed halfway down the hill to prevent the pressure in the lower zone from increasing above 60m and the two zones are operating properly as long as the boundary valves remain closed. As soon as one or other of the boundary valves is opened, the lower zone is breached and immediately receives the full system pressure which raises the pressure at the lowest point from 60m to 120m as shown in Figure 181. Such a pressure increase will increase leakage rates in the lower zone significantly and result in a higher incidence of new burst pipes. There are a number of ways of addressing the potential problems caused by unauthorised opening of boundary valves. The most drastic is to cut and cap the cross boundary connections but most water suppliers do not favour this option as it hampers the possibility of using the cross boundary connection to supply the zone in case of an emergency. Another option is to close the valve and fill the box with sand and place a thin layer of cement over the sand. If anyone opens the valve, they will have to break the screed and anyone checking the valve will see that it has been tampered with. Another approach as shown in Figure 182 is to have the pipes cut and fire hydrants placed at both sides of the zone. If the zones must 239

257 be connected in the case of an emergency, they can be joined by using some temporary connection as shown in the figure. It is not an ideal solution but is functional. Figure 180: Pressure profile after re-establishment of zones Figure 181: Opening boundary valve between two pressure zones 240

258 Figure 182: Approach used to identify cross boundary connections 17.2 Checking zone discreteness As highlighted in the examples above, sectorising is an extremely important issue to all water suppliers and checking that the zones are discrete is part of the operation and maintenance of the zones. Such checking can be undertaken through regular filed inspections where someone visits each valve in the system and ensures that it is open if it is a normal internal network valve and closed if it is an important boundary valve. An alternative approach is to install pressure loggers at specific points in the system which can monitor the system pressures and send alarms should the pressure move outside of the specified range. A pressure drop test can be undertaken in which the supply to the zone is shut off and the pressure is monitored at the critical point in the zone to ensure that it drops to zero. A typical example of this is shown in Figure 1823 which shows a successful pressure drop test. Figure 184 and Figure 185 show the results from logging at two points which are in different pressure zones. As can be seen, the pressures tend to follow each other closely suggesting that the zones are not discrete. Figure 186 shows an example where the same test has been undertaken, however, on this occasion the zone pressures do not match and the logging results suggest that the two zones are not connected to each other and are therefore discrete. 241


259 Figure 183: Results of successful pressure drop test Figure 184: Example where both zones are connected 242


260 Figure 185: Example where both zones are connected Figure 186: Example where the zones are discrete 243