River Channel Characteristics
|
|
|
- Vernon Burns
- 5 years ago
- Views:
Transcription

1 River Channel Characteristics
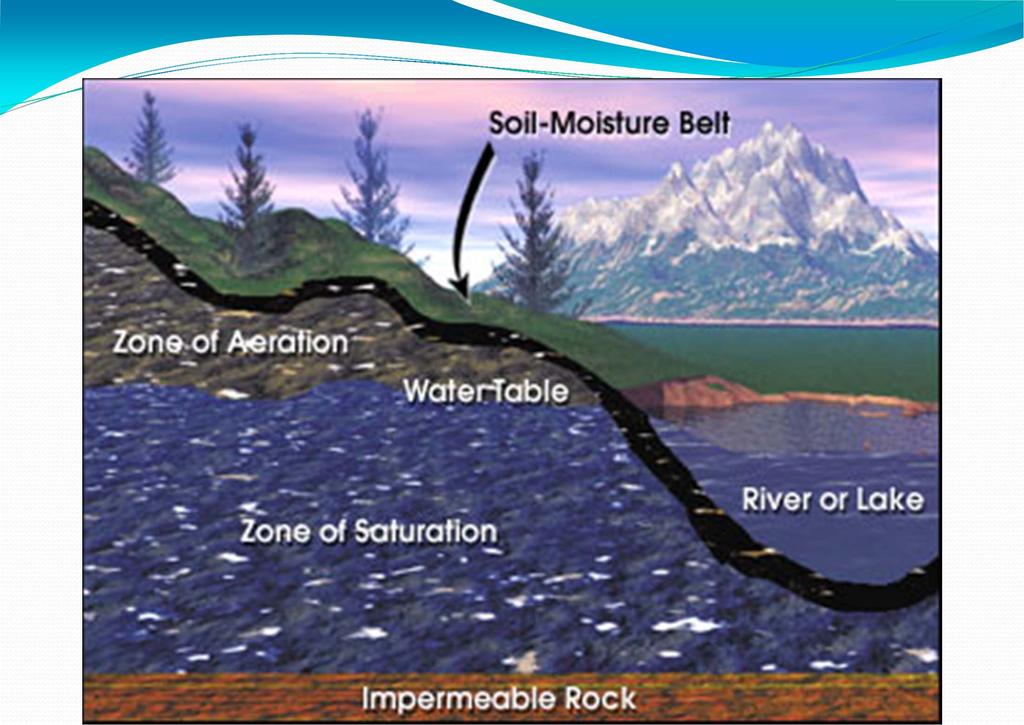
2 Storages and Transfers in Drainage Basins Precipitation Evapotranspiration SURFACE STORAGE INTERCEPTION STORAGE CHANNEL STORAGE Soil Moisture Storage Aeration Zone Storage Infiltration Percolation Stemflow & Drip Overland Flow Overland Flow BASIN CHANNEL RUNNOFF Ground Water Storage Ground Water Recharge AERATION ZONE GROUND WATER ZONE Throughflow After Summerfield, 1991
3 Infiltration Process of water entry into the surface of a soil Infiltration capacity is the maximum rate at which water soaks into the soil Infiltration capacity decreases with time during a rainfall event Saturated infiltration capacity infiltration capacity when soil is saturated Saturated infiltration capacity influenced by a number of factors Vegetation cover Soil texture and porosity Soil structure
4 Flow Types Overland flow Infiltration excess/hortonian overland flow Saturation excess/saturation overland flow Throughflow Matrix Flow Macropore flow Pipe flow Groundwater flow
5 Overland flow Infiltration excess Requires high intensity rainfall event Infiltration capacity is exceeded by rainfall Semi arid regions with high intensity rainfall events Saturation excess Water table moves to the surface Water can no longer infiltrate Can occur in as a result of lower intensity rainfall events
6 Throughflow Water that infiltrates into the soil and travels laterally downslope through the soil or rock Baseflow low flows maintained by slow subsurface drainage of water Stormflow Peak flows, generated by saturation excess OLF Ways in which water can move through soil Matrix flow Macropore flow Pipeflow Groundwater flow
7 Matrix flow Water moving through the very fine pores of a soil Capillary water Water that is held within the soil against the force of gravity result of attraction of water molecules to each other and the soil particles Held in small soil pores. Moves from wet to dry areas
8 Macropore flow Macropores are pores that are larger than 0.1 mm in diameter Macropores are often connected to one another to form channels Promotes preferential transport of water Can cause pollution problems
9 Pipeflow Larger versions of soil macropores (> 1 mm) Created by Animal burrows Shrinkage cracks Root growth and decay Mass movement cracks Can collapse to form gullies
10 Groundwater Water table: Varies according to groundwater recharge Aquifer: Rock in which the groundwater is stored. Aquiclude: Impervious rock with no groundwater below the aquifer.
11
12 Components of a Fluvial Channel l w w l A d width length cross sectional area depth d A
13 Discharge Stream discharge (Q) is the volume of water flowing past a given cross section of a channel per unit time Measured in m 3 /s (i.e. a certain volume in a given time period) Discharge > recharge = dramatic drop in stream levels Recharge > discharge = localized flooding Changes in discharge through time are represented on a hydrograph
14 Q: Given that the flow velocities for the illustrated two streams are identical, which stream will have the largest discharge? A B A: Discharge equals cross sectional area multiplied by velocity. B has a larger cross sectional area than A. The velocity for both streams are the same. Therefore, since B has a larger cross sectional area, the discharge for stream B is higher.
15 Storm Hydrograph (flood event following a rainfall event) ❶ Rainfall Event Discharge (m 3 /s) Stream Flow Base Flow Rainfall (mm/h) Time Three components of the hydrograph are illustrated here. First is the stream flow which represents the change in discharge over time, specifically in this case since the rainfall event. The second component is the rainfall event which shows the change in rainfall intensity since the beginning of the event, Lastly is the base flow which shows the amount of water that flows into the stream from groundwater sources.
16 Storm Hydrograph (flood event following a rainfall event) ❷ b Discharge (m 3 /s) Rise of Flood a c Rainfall (mm/h) Regarding the stream flow, during and just after a rainfall event the discharge in the stream will increase (a) until it peaks at the time of maximum discharge (b). The higher the crest peak at point (b) the greater the discharge when a flood is at its greatest level. The steepness of the graph at (a) reflects how rapidly the stream discharge rises. Very steep graphs indicate potential flash flood conditions. After peak discharge the discharge will decrease (c). The rise of flood is an indication of how much the discharge increased from its base flow to its crest as a result of the rainfall event. Time
17 Storm Hydrograph (flood event following a rainfall event) ❸ Lag time Discharge (m 3 /s) Rainfall (mm/h) Time The lag time is the delay that occurs between the peak of the rainfall event and the peak of stream discharge (the flood event). The shorter this interval, the more rapidly a flood event arises from a rainfall event and the less warning there is. All of these characteristics are influenced by the conditions found within the catchment including properties of the catchment such as size, shape, stream order and stream magnitude.

18 Channel Sinuosity Channel sinuosity More sinuous channels have higher values Straight channels have values < 1.5
19 Erosion vs. Sedimentation (Deposition) Determined by: Energy of the flow: Which in turn is determined by: Gradient Discharge Amount of material available. Base level The lowest elevation to which a stream can erode its channel When the stream energy is high and there is enough material to be removed, erosion will occur If the stream energy decreases, the stream will no longer be able to transport the particles and deposition will occur
20 Some Erosion Processes Corrosion Involves a chemical reaction between the water and the substrate (e.g.. Rock) It is the chemical weathering of minerals and their removal downstream Corrasion/Abrasion This involves the physical wearing away of the bedrock by particles in the water flow
21 Stream Loads Dissolved load: Ions of rock material held in solution Suspended load: Fine grained, clastic particles. Suspension Rolling Sliding Saltation Bed load: After Summerfield, 1991 Larger particles Saltation Traction
22 Stream capacity and competence Capacity Maximum load of solid particles that a stream can transport Increases as discharge increases Competence Maximum particle size that a stream can transport Increases as the velocity increases Deposition Decrease in stream velocity Therefore decrease in competence Particles deposited in order of size as velocity continues to decrease Alluvium Stream deposited sediment Generally well sorted