Predicting Nitrogen Deposition to Forests in the Los Angeles Basin using Lichen Communities
|
|
|
- Julius Hopkins
- 5 years ago
- Views:
Transcription

1 Predicting Nitrogen Deposition to Forests in the Los Angeles Basin using Lichen Communities STATUS: MS in prep Sarah Jovan, Lichen Indicator Lead, Forest Inventory and Analysis Program, PNW Research Station Jennifer Riddell, Arizona State University, School of Life Sciences Pamela Padgett, Pacific Southwest Research Station, Forest Fire Laboratory Tom Nash, Arizona State University, School of Life Sciences
2 Use of lichen communities in air quality biomonitoring: Allows inexpensive mapping of pollution deposition patterns across the landscape thus, enhancing geographic scope/density of information from instrumented networks Provides evidence of an ecological effect lichens are canaries in the coalmine, often used to develop critical loads for N and S (e.g. Fenn et al. 2008, Fenn et al. in press; Geiser et al. 2010)
 Have moisture-activated metabolism Lack a protective cuticle and so absorb water over their entire surface")
3 Sensitivity to pollution: Lichens Are poikilohydric (e.g. lack mechanisms for storing water) Have moisture-activated metabolism Lack a protective cuticle and so absorb water over their entire surface Chemicals scavenged by precip and washed from surrounding surfaces are readily internalized


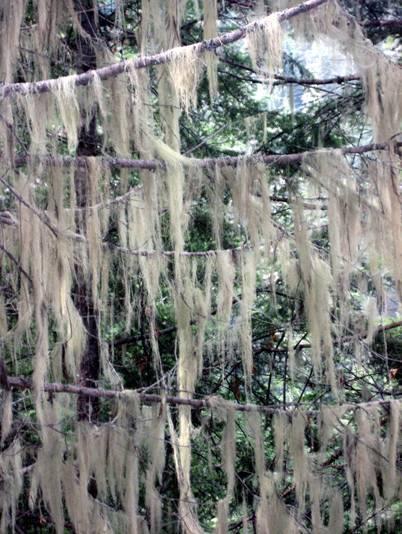
4 Morphological changes in a moderately pollution tolerant species from the L.A. Basin H. imshaugii At polluted sites Hypogymnia imshaugii at a clean site


5 N indicator groups Oligotrophs Mesotrophs Eutrophs Highly sensitive Moderately sensitive N-loving weeds
6 N optima Oligotrophs Mesotrophs Eutrophs
 Most plots have air quality monitors Quercus-kelloggii stands Elevation band: 1500-2000m 118-312 trees per")
7 Study area: South Coast Air Quality Management District (SCAQMD) Surveyed lichens at 22 plots co-located with longterm monitoring sites: All plots have historical lichen data ( ) Most plots have air quality monitors Quercus-kelloggii stands Elevation band: m trees per ha
 Spp. loss mistakenly correlated with O 3 gradient (experimental evidence by Riddell et al.")
8 Study area history: Hasse (1913) Collected extensively in the basin Published the Lichen Flora of Southern California Sigal and Nash (1983) ~ 50% montane lichen spp. extirpated since Hasse (1913) Spp. loss mistakenly correlated with O 3 gradient (experimental evidence by Riddell et al. (2010) and the current study confirm it was probably N )
9 Objectives We re-surveyed Sigal and Nash s sites in 2008 to: 1) Determine if/how lichen community composition has changed since the late 70s (Riddell and Jovan et al., in press) 2) Determine which pollutants are likely affecting current lichen communities in the SCAQMD.

10 Data: N deposition estimates from CMAQ (n = 22) Wet oxidized N, Dry oxidized N Wet reduced N, Dry reduced N Definition: Communities Multi-scale Air Quality model. Emissions-based at 4 x 4 km resolution. Data Source: edoc.html CMAQ modeled total N dep kg -1 ha yr -1

11 Data: Air concentrations of gases (n = 10) Ammonia (NH 3 ) Nitric acid (HNO 3 ) Ozone (O 3 ) Nitrogen dioxide (NO 2 ) Definition: seasonal averages and sums from passive monitoring, summer 2006 Data Source: Bytnerowicz, unpublished data Ogawa passive samplers
 Soaked in 0.")
12 Data: Twig nitrate (NO 3- ; n = 22) Serves as an additional measure of N deposition Collected15 twigs per site, all within a 10 day period (Aug. 2008) Soaked in 0.25 KCL for 1 hr Measured ph and nitrate (NO 3- ) concentration of sample solution Quercus kelloggii leaf

13 Data: Throughfall N (n = 8) Definition: The hydrologic flux of N from the canopy to the forest floor (Fenn and Poth 2004). -this flux captures both wet and dry N deposition Data Source: Fenn et al ion resin exchange column with snow tube

14 Data Collection: 2 methods: 1.Transects of 10 Quercus kelloggii boles Measured % cover of each lichen species at each cardinal direction using a 5x16 cm mesh grid of 0.5cm 2 squares 2.FIA survey protocol
15 Forest Inventory and Analysis Lichen Communities Indicator Lichens are sampled on a national grid of permanent plots for monitoring air quality and climate change effects on forest health. We currently track the status of lichen communities at over 4000 sites in the continental U.S. When fully implemented, we ll track at over 6,800 sites
 2 = Uncommon (4-10 thalli) 3 = Common (>10")
16 Data collection: Timed surveys lasting up to 2 hours 0.4 ha plot centered on the Quercus transect Abundance of each epiphytic macrolichen is estimated: 1 = Infrequent (< 3 thalli) 2 = Uncommon (4-10 thalli) 3 = Common (>10 thalli; covers < 50% of all boles and branches) 4 = Abundant (>10 thalli covers > 50% of all boles and branches)
17 Data: Environmental variables Climate (from PRISM data by Daly et al, 1994, 2001, 2002): precipitation, mean temperature, maximum temperature, minimum temperature Low score (more N) Geographic variables: longitude, latitude, distance from the coast, elevation High score (less N) Stand structure variables: total basal area (BA), % BA in hardwoods, hardwood species richness, total tree species richness Substrate characterization: -- bark ph, twig surface ph, twig nitrate * urban plots in gray
18 Gradient analysis: Major patterns in community composition are distilled by comparing species assemblages between all possible pairs of plots using a distance measure. Sørensen distance (syn. Bray & Curtis; Czekanowski 1913) Distance A,B = 2w/(a+b) where w = species in common, a = species in plot A, b = species in plot B. shared species / total species
19 A matrix of distances (i.e. differences ) among plots is generated. This info is used to arrange plots along gradients in lichen community composition Each plot gets score on each gradient, depending on its species assemblage.
20 Gradient analysis: Non-metric multidimensional scaling (NMS) Definition: an iterative search for the best positions of n entities on k dimensions (axes) that minimizes the stress of the k-dimensional configuration. (McCune and Grace 2002) Original Citation: Kruskal 1964 Software: PC-ORD (McCune and Mefford 2008)
21 Results: NMS resolved 3 statistically significant axes explaining 88% of the variability in lichen community composition. r 2 Axis Axis Axis *Results are presented for the % cover data, which are more precise
22 Results: r 2 values for axis 1 Only variables with correlation >.50 to one or both axes are shown Throughfall = 0.94 Total Dry N = 0.62 Dry Oxidized N = 0.60 Twig NO 3 = 0.58 Temp = 0.49 Elevation = 0.48
23 Correlation of best environmental predictors to axis 1 scores % cover on oaks FIA protocol r 2 p r 2 p Throughfall N 0.94 < Total Dry N 0.62 < Dry Oxidized N 0.6 < Twig NO <
24 N optima Oligotrophs Mesotrophs Eutrophs Low axis scores High axis scores

25 Results: Relative N impact at study sites
26
27


28 Throughfall measures NH 4 + and NO 3 - dissolved in precipitation and in stemflow. integrates wet and dry deposited N accounts for canopy enhancement of dry deposition
29 N deposition estimated for all sites Lichen-based predictions of throughfall were off an average of ± 4.57 kg N ha -1 yr -1 Region Average deposition 95% C.I. Western San Bern. 48 kg kg Eastern San Bern. 8 kg kg Angeles NF 61 kg kg Cleveland NF 35 kg kg
30 Actual versus lichen-predicted throughfall for San Bernardino sites Site Actual Predicted 95% C.I. Barton Flat Breezy Point Camp Angelus Camp Osceola Camp Paivika Dogwood Heaps Peak Arboretum Holcomb Valley Keller Peak Sky Forest Ranger Station Strawberry Peak Background N deposition in the west ~1kg
31 N deposition at 21/22 sites exceeds the critical load for lichens Critical load (CL): the highest amount of N that does not cause harm to lichen communities (i.e. a shift in community composition). Throughfall predictions ranged from 3.1 to 65.1 kg N ha -1 yr -1 N CL for Oak forests: 5.5 kg N ha -1 yr -1 (Fenn et al in press)
32 Conclusions Nitrogen is clearly a key driver of lichen community composition in S. California. In Sigal likely witnessed a flora compromised by N, not O 3 If N inputs increase, communities are expected to shift further towards total domination by eutrophic species. New sites can be sampled, scored by the gradient model, and used to predict throughfall Air Q measurements are expensive! Lichen predictions can help us focus our monitoring efforts and prioritize where to install new instruments to measure N.

33 Special thanks to: Andrzej Bytnerowicz, USFS, Pacific Southwest Research Stn, Mark Fenn, USFS, Pacific Southwest Research Stn, Mike McCorison, USDA Forest Service, Angeles National Forest Ken Sweat, Arizona State University, School of Life Sciences