Ohio Section AWWA NW District Fall Meeting April 20, City of Delaware Water Plant Improvements
|
|
|
- Timothy Osborne
- 5 years ago
- Views:
Transcription

1 April 20, 2016 City of Delaware Water Plant Improvements 1

2 NW District Fall Meeting April 20, 2016 Delaware Water Plant Project Overview Converted 6.0 MGD Lime Softening Plant to 7.2 MGD Ultrafiltration & Reverse Osmosis to meet new EPA regulations. Design and Bidding: October 2010 July 2012 Design Firm: URS/AECOM Construction: October 2012 May 2015 General Contractor: Shook Construction Company 2
 Two Source Waters: Olentangy River and Groundwater (limestone aquifer) Surface water received Bin 2 Classification under the Long Term 2 Enhanced Surface Water Treatment Rule requiring 4-log")
3 NW District Fall Meeting Project Background Original plant constructed in 1890 last plant upgrade in 1974 (6.0 MGD) Two Source Waters: Olentangy River and Groundwater (limestone aquifer) Surface water received Bin 2 Classification under the Long Term 2 Enhanced Surface Water Treatment Rule requiring 4-log removal of cryptosporidium. Under Stage 2 Disinfection By-products Rule one of new sampling locations had high TTHMs. Current expansion to 7.2 MGD with capability to expand to 12 MGD. Previous water study determined that using UF and RO was the best economical option for the city to comply with all current and future EPA regulations. 3
. And a 250,000 Gallon tank was constructed.")
4 HISTORY OF THE DELAWARE WATER SYSTEM Original water plant constructed. Privately owned. Gravel bed filtration for river water. 16 inch transmission line Upgraded filtration and treatment plant constructed City of Delaware purchased the Delaware Water Company ($560,000). And a 250,000 Gallon tank was constructed Improvements to the plant including the conversion to electric pumps from steam Second 16 transmission main was constructed Construction of the West 1.0 MG water tank Water Treatment Plant expanded from 3 MGD to 6 MGD Construction of the East 1.0 MG water tank Wells drilled Riverview well field. 1.8MGD cap Penry Road well field was constructed Construction of the 2.0 MG SE Highland water tank The City constructed a new 24-inch water transmission main which allowed the City to decommission the 1880 s era 16- inch water transmission main Construction of a 16 Raw Water Main from the Penry well field to the water plant for 2.0 MGD cap The $30 million project to upgrade the City of Delaware s water treatment facility was completed. The treatment process was upgraded to use Nano filtration and ultrafiltration membranes to assist in meeting the Ohio EPA drinking water regulations. 4
5 ASCE Ohio Section AWWA NW Central District Ohio Fall Section Meeting April 20, 2016 April 2016 Raw Water Quality Groundwater Quality Concentration (MG/L) Total Dissolved Solids: 700 to 825 Hardness: 500 to 600 Strontium: 12 to 23 Iron 0.8 to 1.6 Surface Water Quality Total Dissolved Solids: 100 to 375 Hardness: 150 to 300 Total Organic Carbon (TOC): 6 to 12 Nitrates: 0 to 20 Atrazine 0 to
6 NW District Fall Meeting Treatment Processes Groundwater (GW) capacity: 3.5 MGD Surface Water (SW) capacity: 3.7 MGD Total Capacity: 7.2 MGD GW Pressure Filtration, Reverse Osmosis (RO) SW Enhanced Coagulation, Flocculation, Sedimentation, Ultrafiltration(UF), Reverse Osmosis (RO) The GW and SW are blended together and disinfected using Chlorine. Fluoride is added to prevent tooth decay. Orthophosphate is added for corrosion control. Discharge Permits Sophisticated controls monitor the discharge of RO concentrate to the Olentangy River (classified as a Scenic River and State Resource Water). The discharge is automatically diverted to the lagoons or sanitary sewer during low river flows. The discharge permit for the abandoned package wastewater treatment plant was eliminated by diverting the plant discharge to the sanitary sewer. This was accomplished by utilizing the original 1880 s era 16 waterline by connecting this abandoned waterline to the sewer system. 6

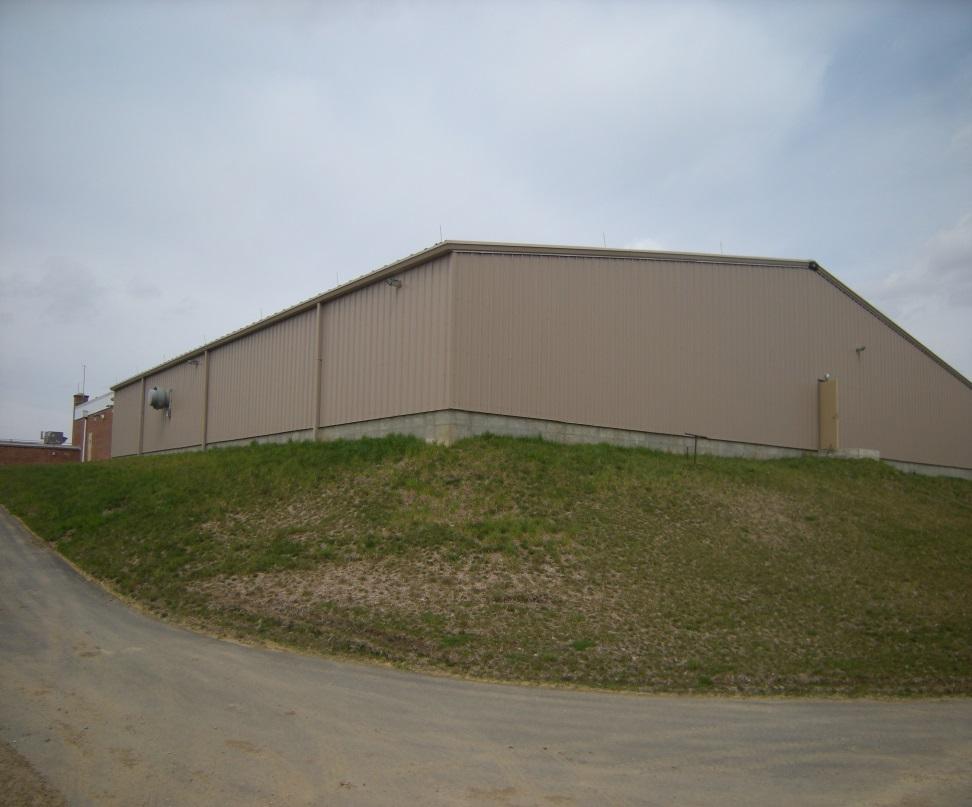
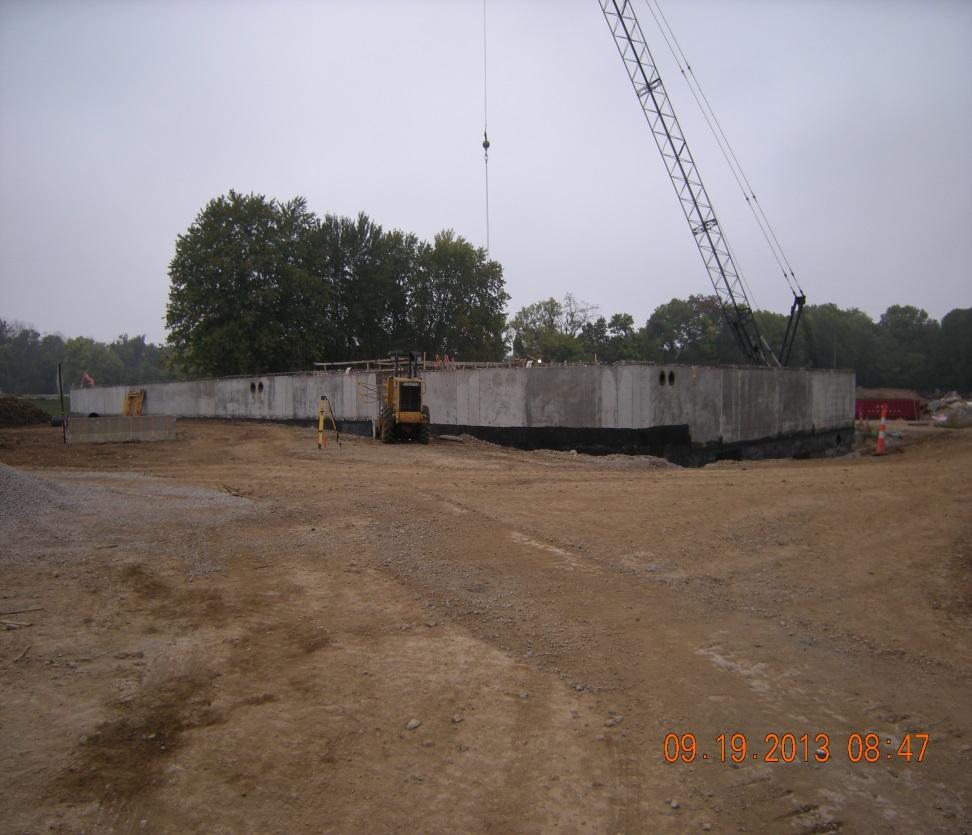
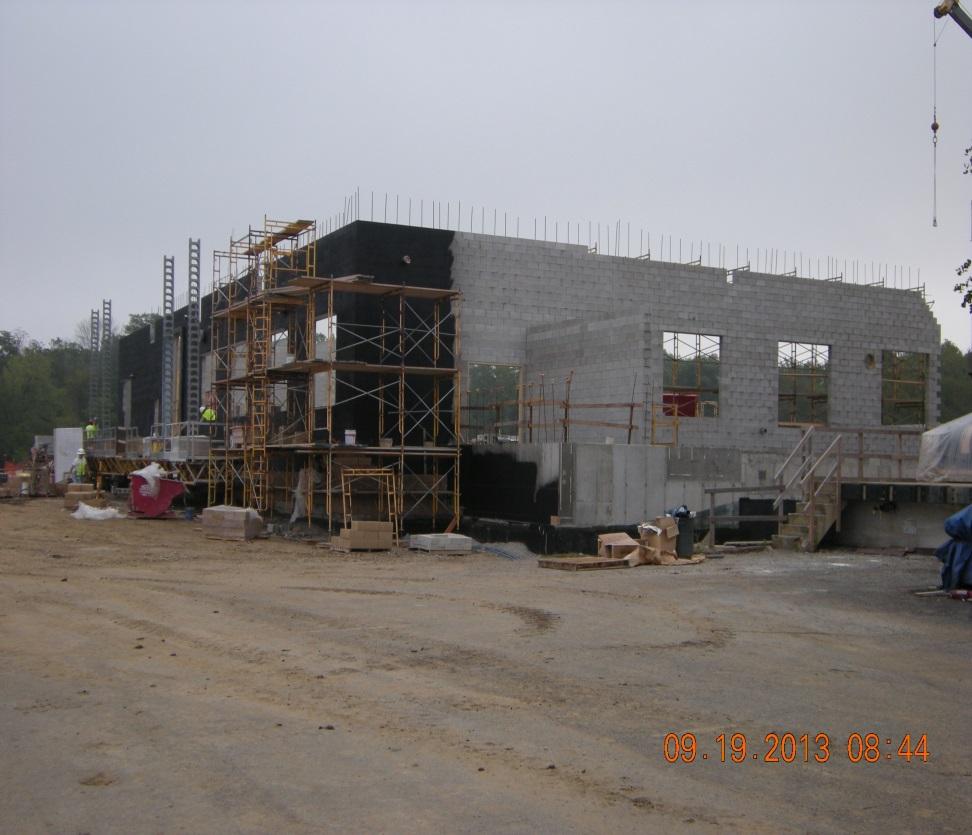
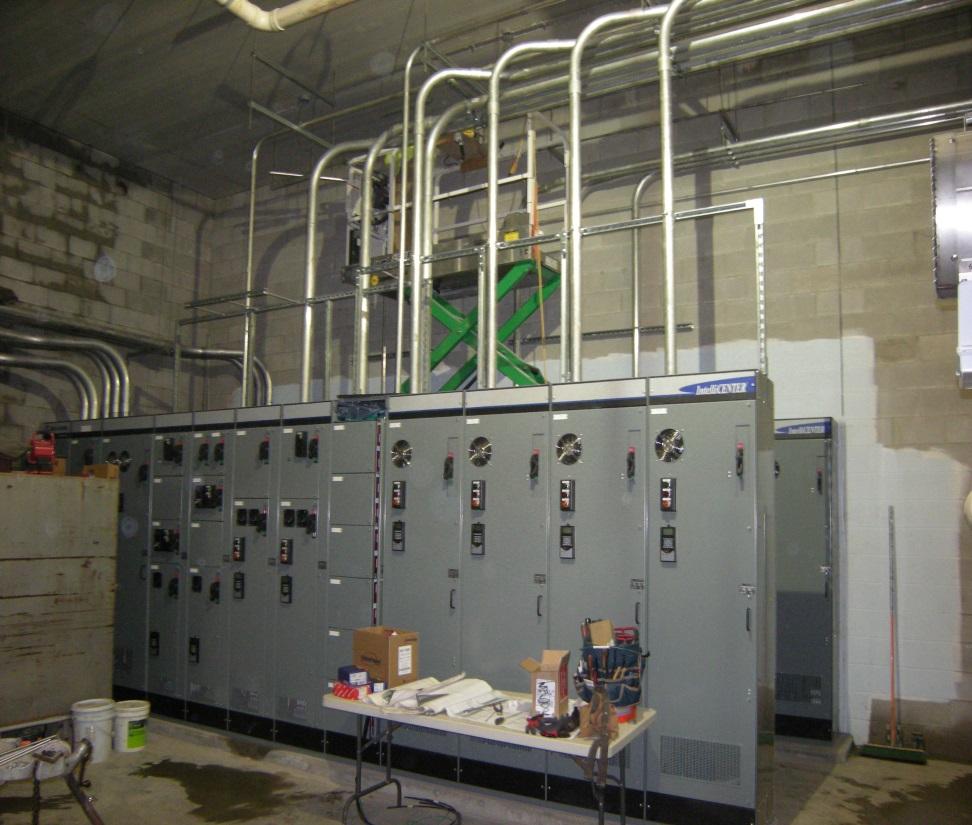
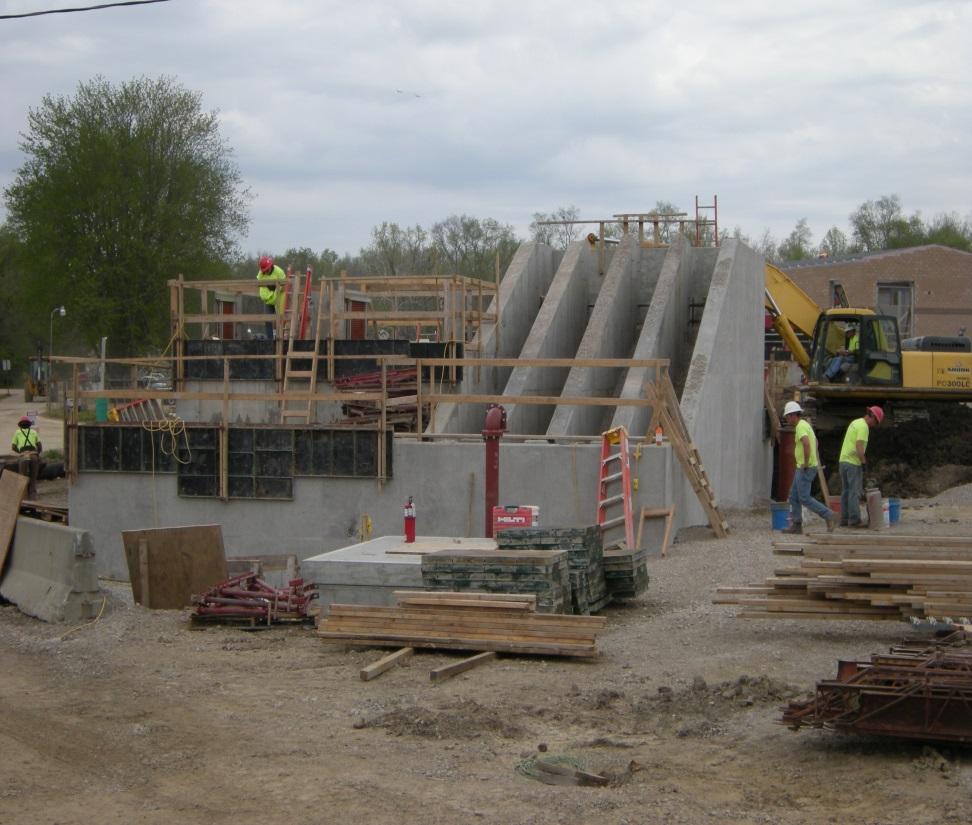
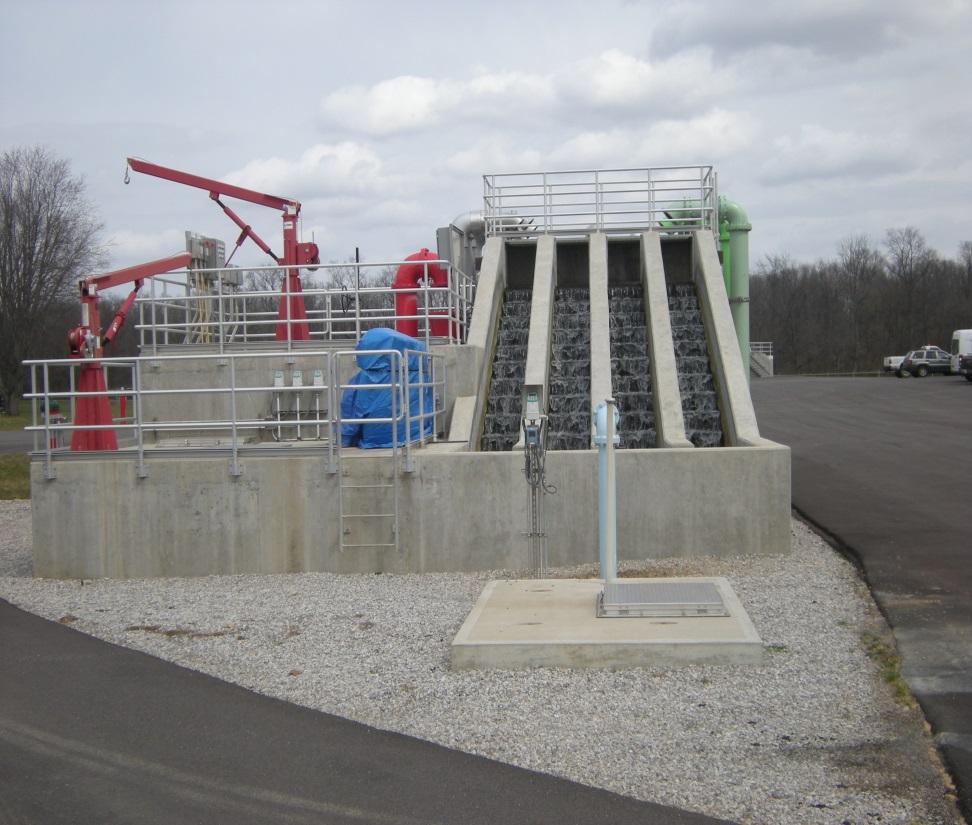
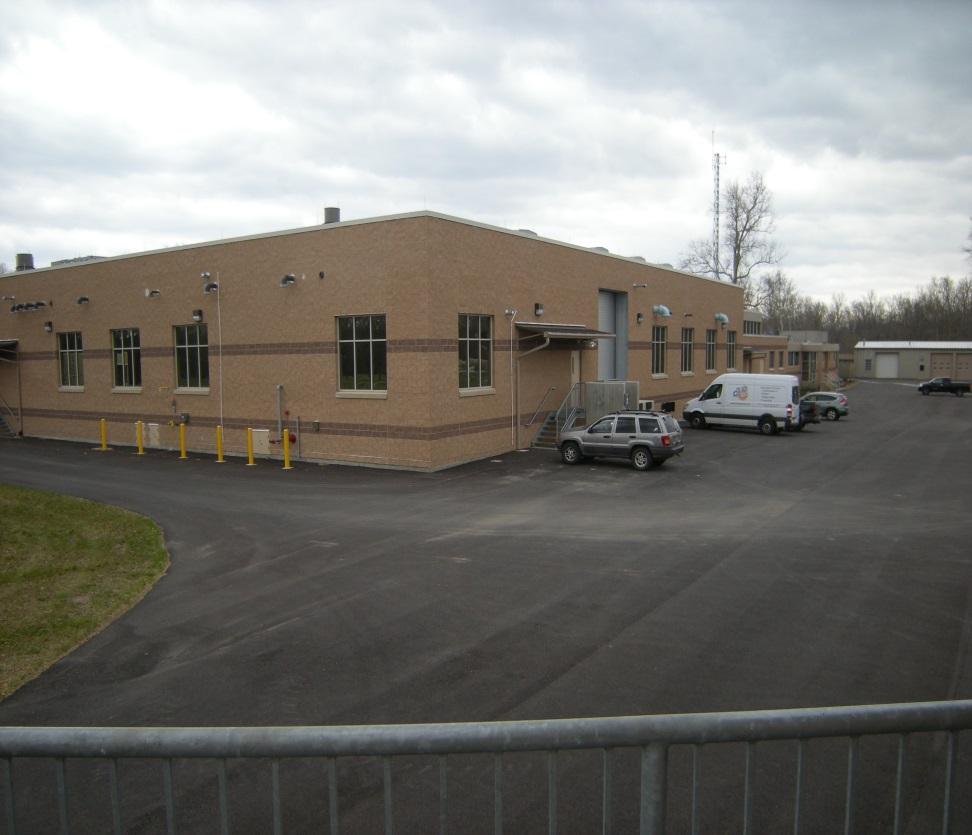
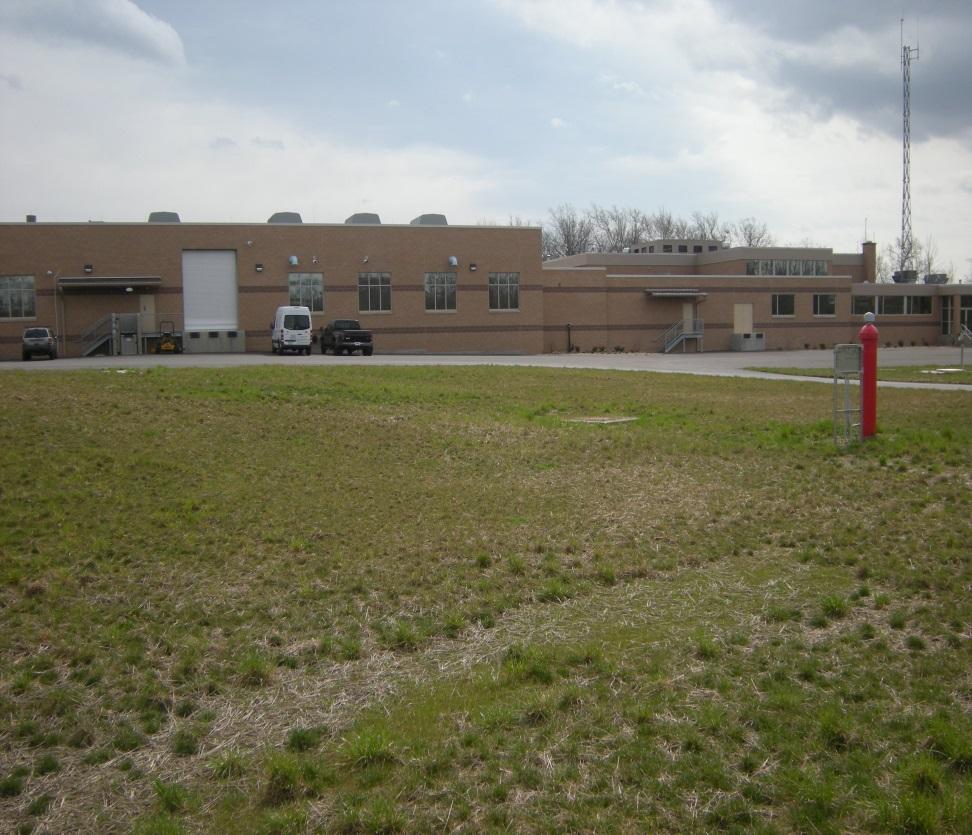
7 Water Plant Improvements New Groundwater Well at Riverview Park. Rehabilitation of two existing intake screens and pump stations. Construction of a new 21,000+ SF Process Building. Ultrafiltration and Nanofiltration Membrane Skids. Groundwater Pressure Filters. Rehabilitation of existing settling tanks. Construction of a new 14,300 SF preengineered metal building over the existing settling tanks. New One-million gallon clearwell. High Service Pump Building. Degasifiers for added to help increase final ph and to help taste and odor. New 1250 kw standby diesel generator. Educational Display Center. (Late 2016 / Early 2017). 7

8 Finished water TOC levels prior to the Improvements From 2001 to 2014 the finished water TOC level averaged 2.4 mg/l which showed we had a lot of organics left in our finished water. This caused high levels of disinfection by products such as; TTHM s & HAA5 s. Finished water TOC levels after the Improvements The new plant was started on December 9 th In 2015 our finished water TOC averaged 0.8 mg/l, and so far for 2016 the TOC level has averaged 0.8mg/l. This indicates an 66.5% decrease in the finished water TOC level which of course has dramatically lowered our TTHM formation potential. We are pleased to say that the RO membranes are doing their job for removing organics. 8

9 Quarter TTHM s Before Improvements DS201 ug/l DS202 ug/l DS203 ug/l DS 204 ug/l 1 st nd rd th st nd rd th
10 Quarter TTHM s After Improvements DS201 ug/l DS202 ug/l DS203 ug/l DS 204 ug/l 1 st nd rd th st nd rd th N/A N/A N/A N/A 10

11 Quarter HAA5 s Before Improvements DS201 ug/l DS202 ug/l DS203 ug/l DS 204 ug/l 1 st nd rd th st nd rd th

12 Quarter HAA5 s After Improvements DS201 ug/l DS202 ug/l DS203 ug/l DS 204 ug/l 1 st nd rd th st nd rd th N/A N/A N/A N/A 12

13 Nitrates were another concern In 1992 wells were Riverview well field with a capacity of 1.8 MGD. This raw groundwater was mixed with the raw surface water and went through the entire treatment process which enabled the City of Delaware to comply with EPA nitrate limits. Prior to improvements in the years 2009 thru 2014 the finished water nitrate levels averaged 2.29 mg/l and we experienced Nitrate spikes of 6.60mg/l using the maximum available groundwater to achieve the 2.29mg/l average. After improvements were completed in December of The finished water nitrate levels averaged 0.62 mg/l in 2015, and a maximum level of 3.35 mg/l. In 2016 the average so far has been0.63 mg/l, and 1.34mg/l has been the maximum finished water nitrate level. Again the RO membranes are doing their job. 13
 to levels far below levels required by EPA.")
14 Ultrafiltration Membranes UF Membrane Skid Surface Water Treatment UF membranes have effectively eliminated pathogens in surface water. UF membranes have reduced turbidity to <0.1 NTU, and TSS <1.0 mg/l. UF membranes have removed bacteria and parasites (cryptosporidium & giardia) to levels far below levels required by EPA. This has also enabled the City of Delaware to comply with the LT2 ESWTR Bin2 classification. UF membranes does not remove dissolved solids (hardness). Equipment Manufacturer H2O Innovation/Toray Membranes Treatment Capacity: 4.5 MGD 14


15 UF Membrane Control Panel UF Membrane Skid 15

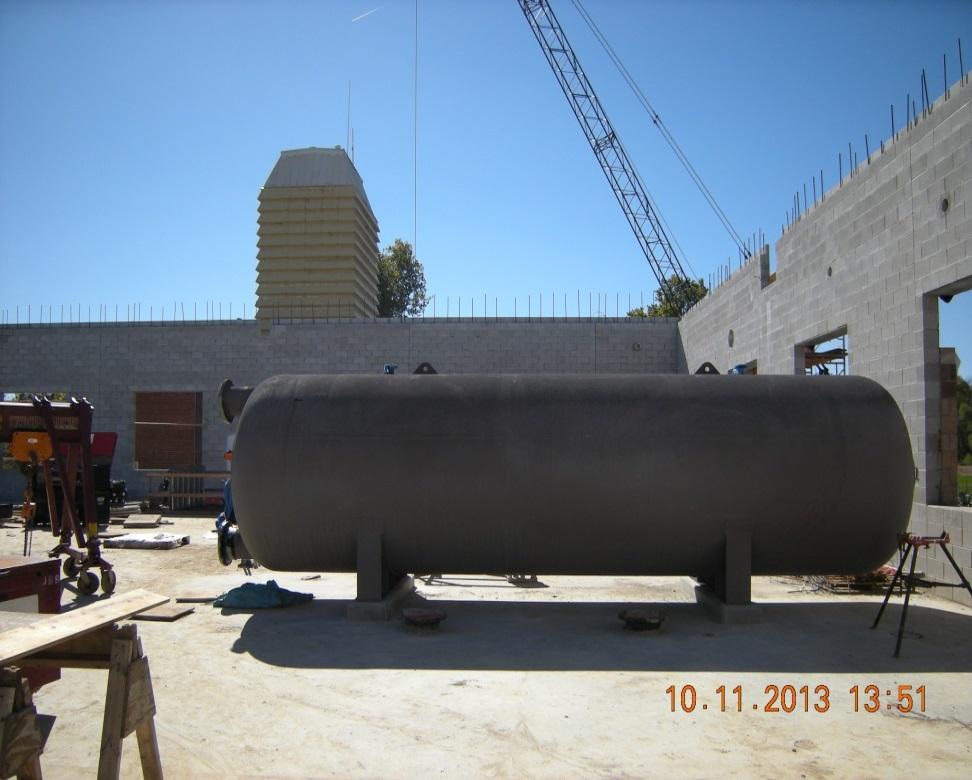
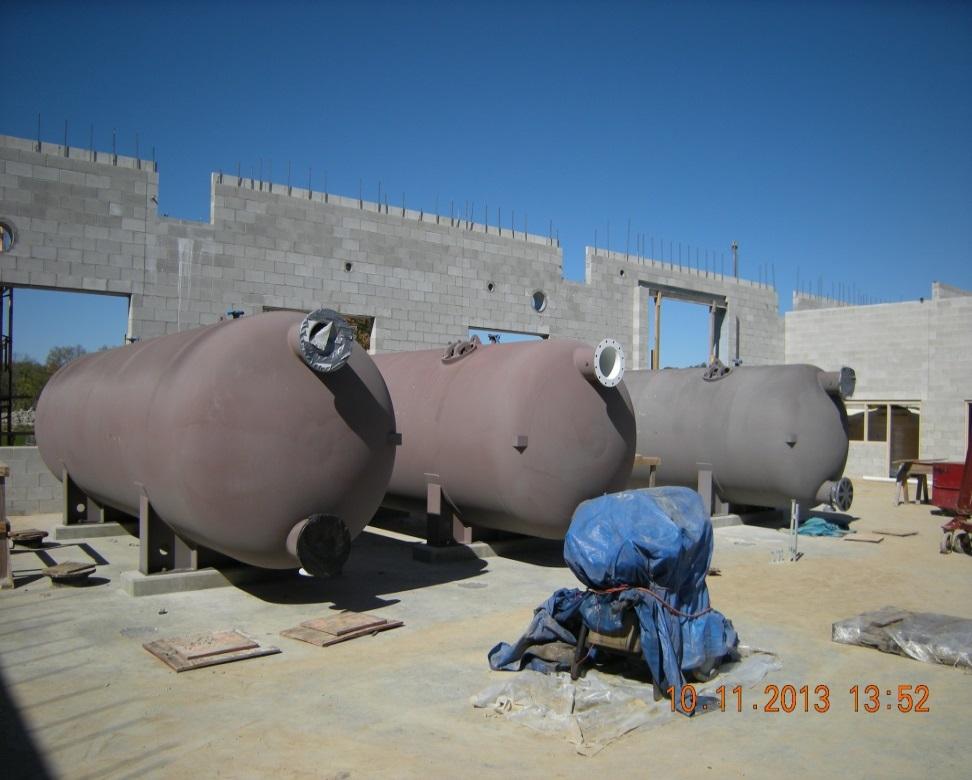
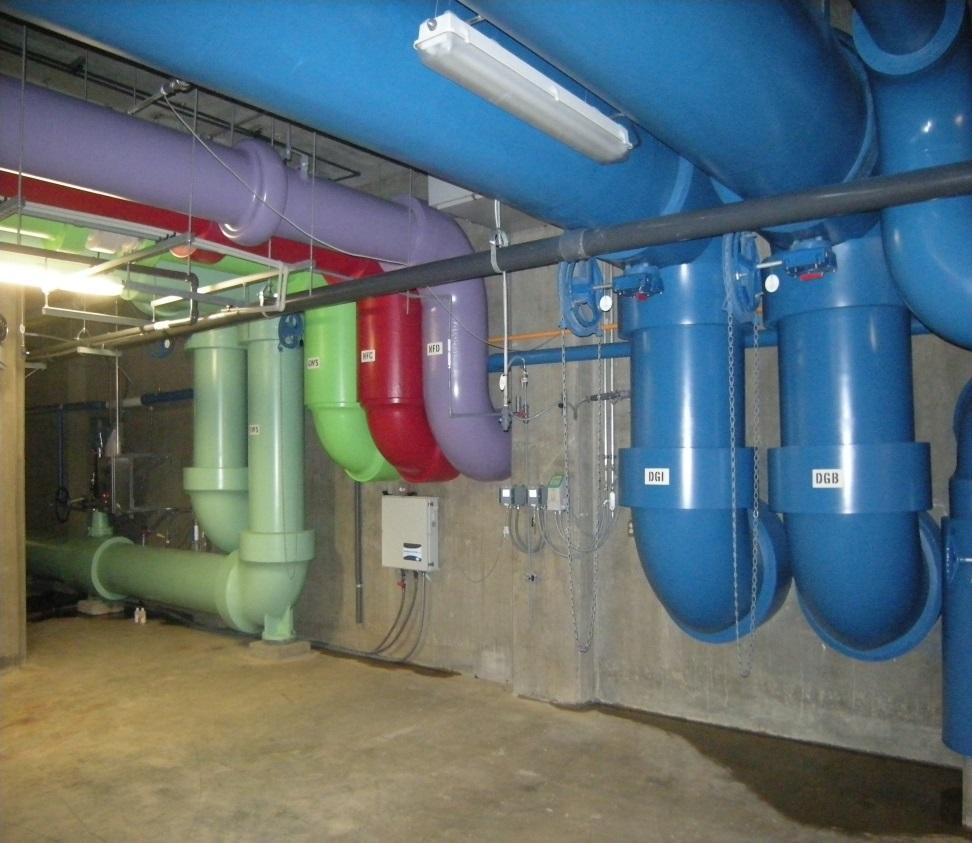
16 RO Membranes Groundwater and Surface Water Treatment Removes dissolved solids from pretreated raw water for the purpose of softening the water. RO membranes treat 90% of the surface water and 50% of the groundwater for softening. Equipment Manufacturer H2O Innovation/Hydranautics Membranes Treatment Capacity 7.2MGD Surface Water 3.7 MGD Groundwater 3.5 MGD 16


17 ASCE Central Ohio Section April 20, 2016 RO Membrane Skid Installations 17


18 NW District Fall Meeting RO Membrane Skid Installations 18

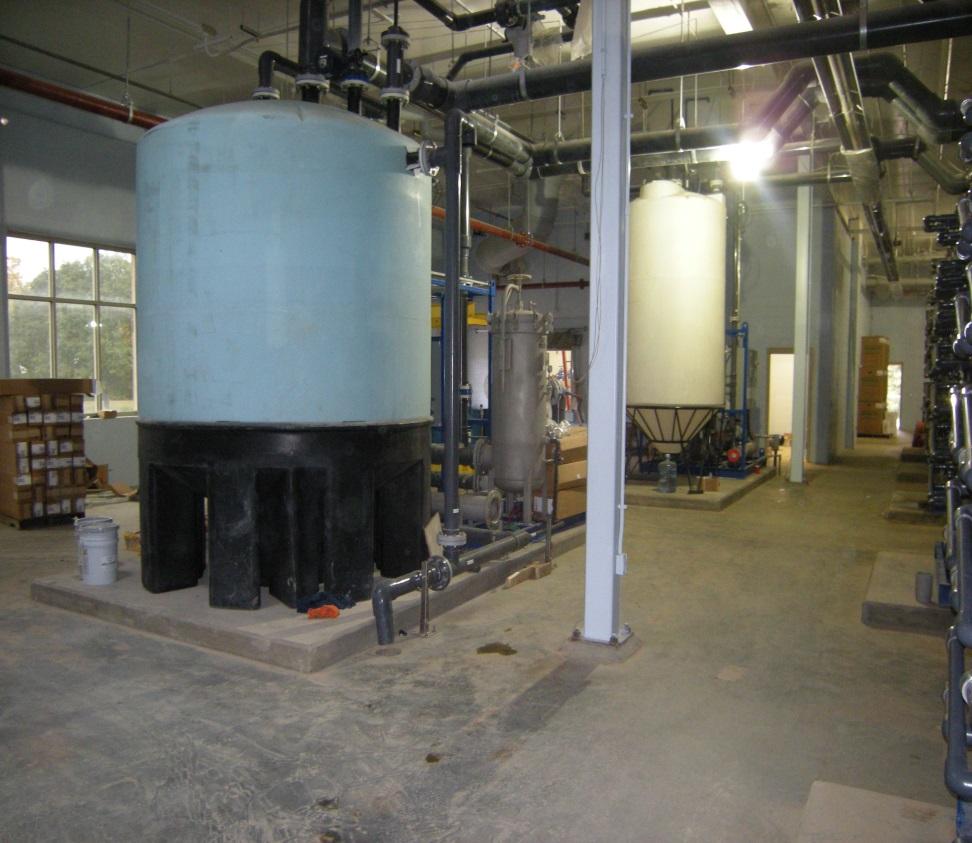
19 Filtronics Pressure Filters Remove of Iron and Manganese in the raw groundwater prior to NF Membranes. Pilot Testing was completed using Propriety Media. Three Filters each have 2 MGD Capacity. Groundwater Pressure filters 19
20 Groundwater Pressure Filter Installations 20

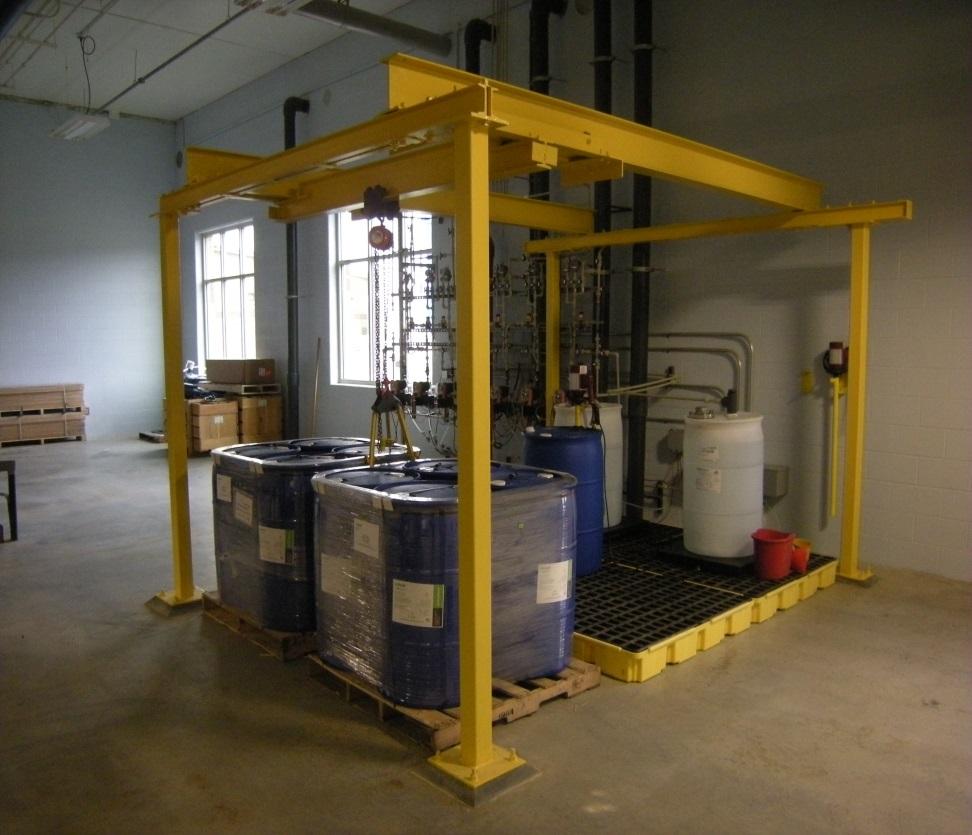
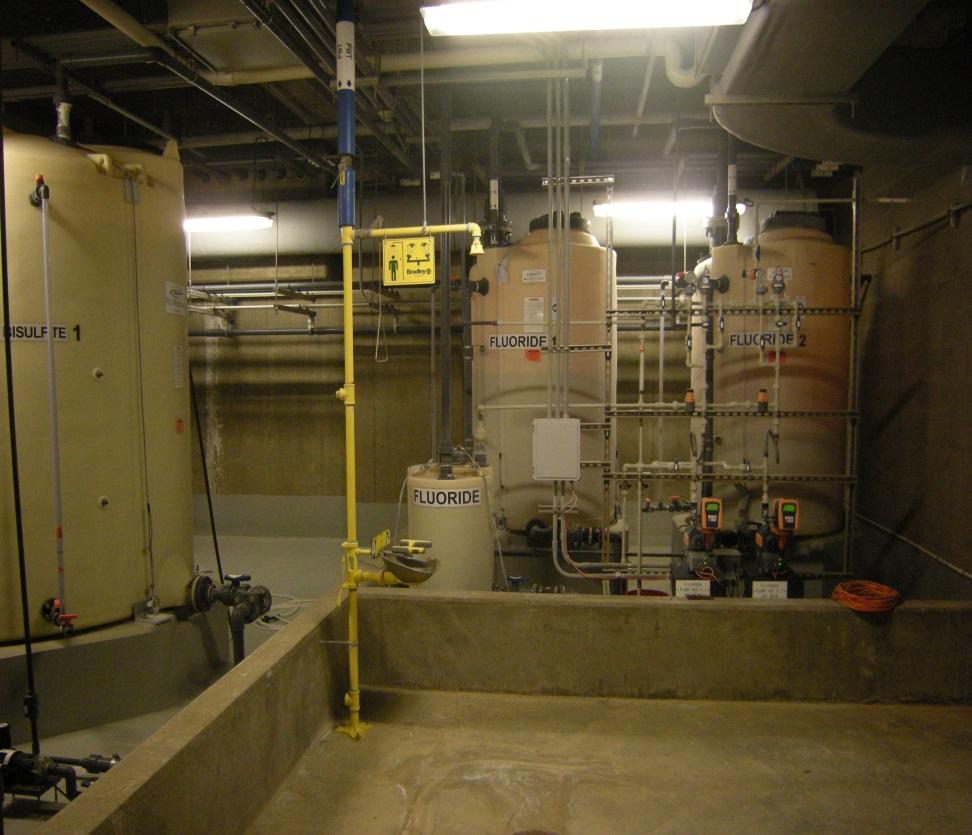
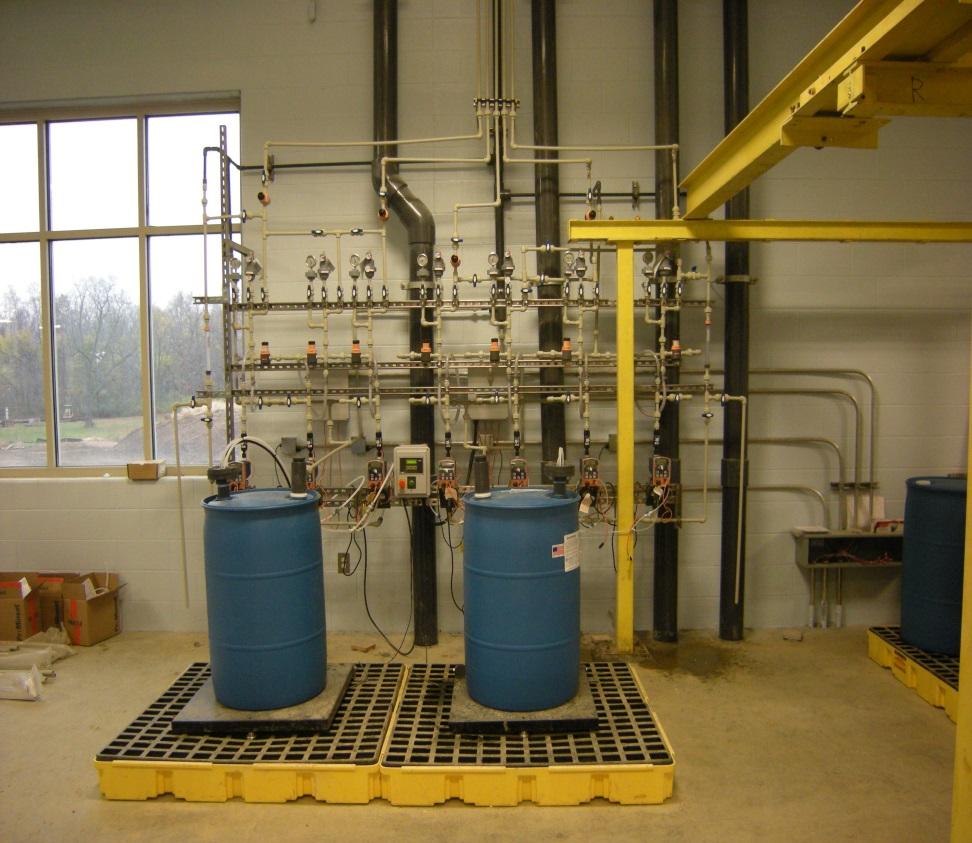
21 Chemical Feed Tanks Chemical Feed Systems w/bulk tanks and day tanks. Orthophosphate Corrosion control of distribution system. Aluminum Chlorohydrate (ACH) used for coagulation of the surface water. Antiscalant Prevention of scale from forming on the feed side of the membrane modules. Caustic Soda Raise ph of the finished water for stability. Fluoride Prevention of tooth decay. Chlorine Disinfection of finished water. 21
 ACH coagulation ($65,000) RO Antiscalant ($54,500) Caustic Soda ($28,000) Sodium Bisulfite($25,000) Sodium Permanganate ($18,000) Sodium Hypochlorite (")
22 Plant Design 7.2 MGD. We experience peak demands of 5.5 MGD. Plant average pump age is 3.7MGD. 2 1MG water storage tanks, 1 MG water storage tanks. Plant is staffed 24 hours/day, 365 days year Chemical costs Orthophosphate ($85,000) ACH coagulation ($65,000) RO Antiscalant ($54,500) Caustic Soda ($28,000) Sodium Bisulfite($25,000) Sodium Permanganate ($18,000) Sodium Hypochlorite ( $17,500) Fluoride ($15,000) Chlorine ($12,000) Citric Acid ($6,500) UF & NF Cleaning Chemicals ($6,500) 22

23 New Plant vs. Old Plant - Chemical Costs In 2013 we spent $318,672 for chemicals. In 2014 we spent $361,020 for chemicals. This averaged $339,846 for chemicals the last 2 years the old plant was operated. In 2015 the first full year the new plant operated we spent $ 333,276 for chemicals. For 2016 we are on a pace to spend $275,000 for chemicals. In 2015 and 2016 running the new plant, we spent an average of $304,138. The new plant we are saving roughly 9% per year. 23

24 New Plant vs. Old Plant - Electric Costs In 2013 we spent $167,856 for electric. In 2014 we spent $212,458 for electric. This averaged $190,157 for electric the last 2 years the old plant was operated. URS / AE COM estimated that the new plant electric would be 100 to 120% higher than the old plant In 2015 the first full year the new plant operated we spent $ 436,838 for electric. For 2016 we are on a pace to spend $376,709 for electric. This would average $406,774 per year for the new plant for electric. This indicates we are spending 110% more for electric per year, which goes along with the estimates given to the City from URS / AE Com. 24
25 25
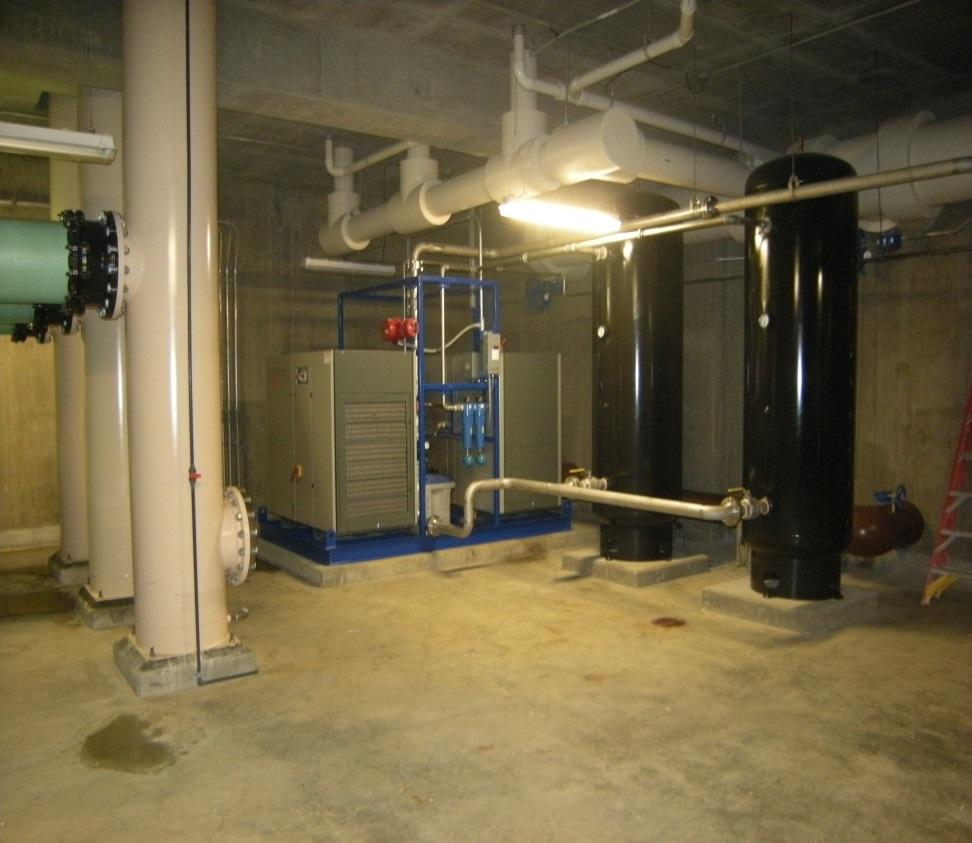
 Million Clearwell w/capability for expansion to two (2) million gallons. Two (2) Degasifiers which help raise the finished water ph.")
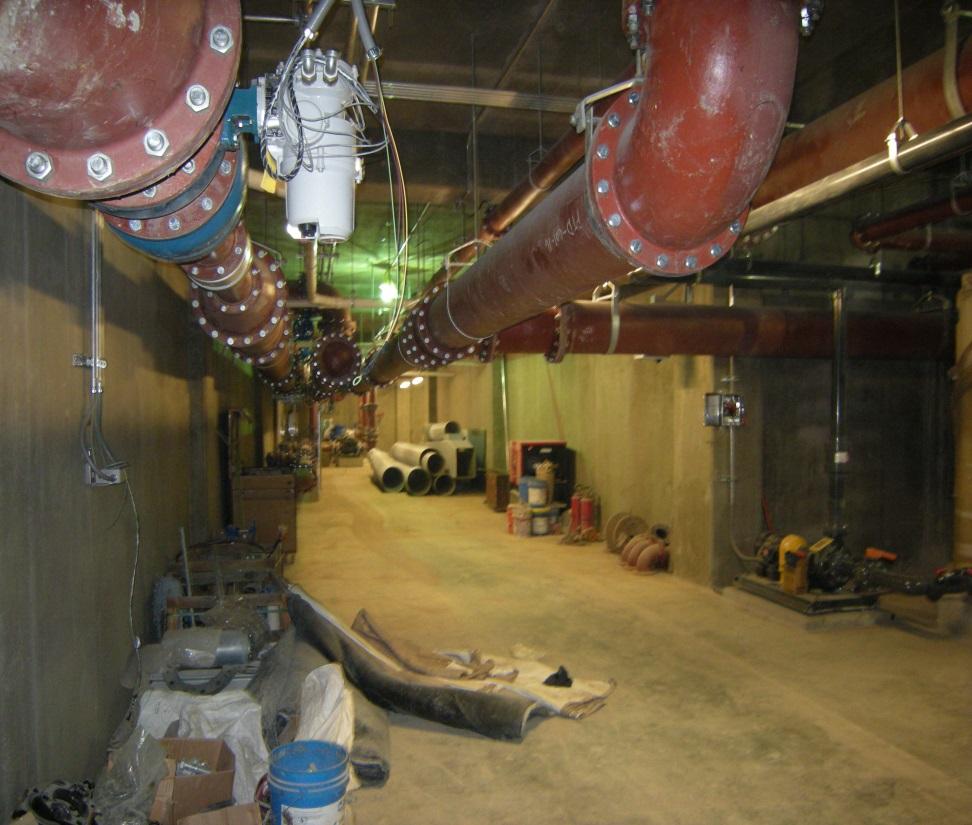
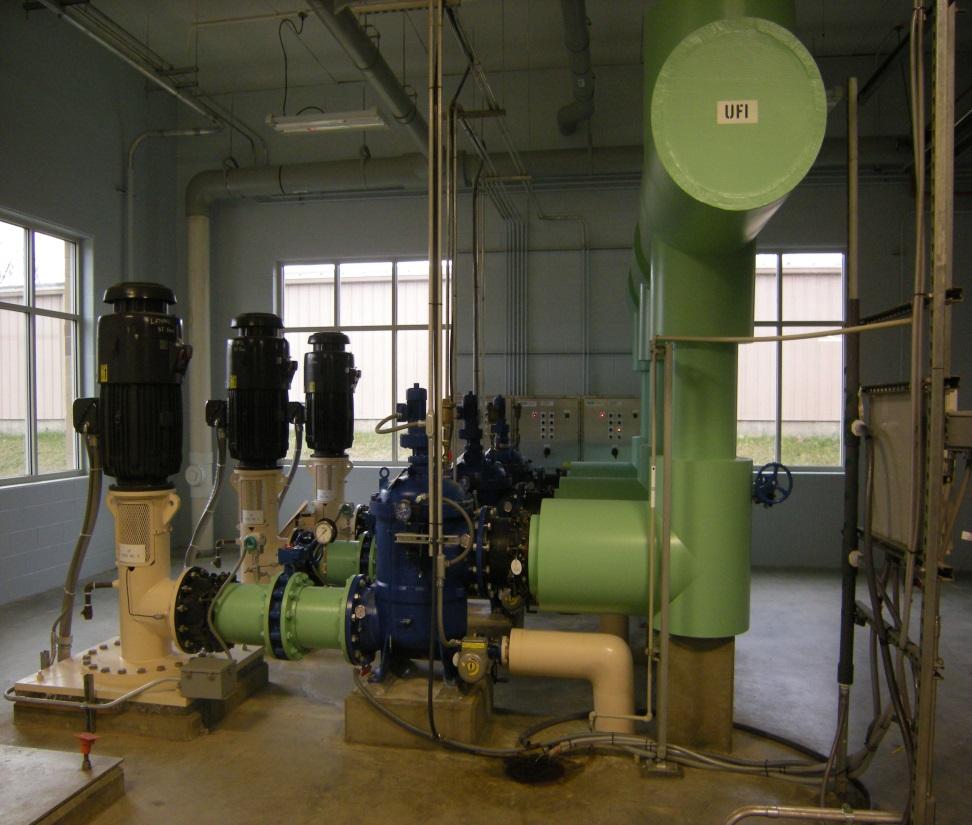
26 High Service Pump Building and Clearwell Three (3) 5 MGD High Service Pumps w/vfd s Capability to add two additional 5 MGD pumps. One (1) Million Clearwell w/capability for expansion to two (2) million gallons. Two (2) Degasifiers which help raise the finished water ph. Also helps control taste/odor. 26


27 Old High Service Pumps New High Service Pumps 27


28 ASCE Central Ohio Section April 20, 2016 Settling Tanks Before Improvements Settling Tanks After Improvements 28

29 Settling Tanks After Improvements 29


30 Ohio Section AWWA South Surface Water Intake - Before South Surface Water Intake - After 30


31 North Surface Water Intake After Improvements 31


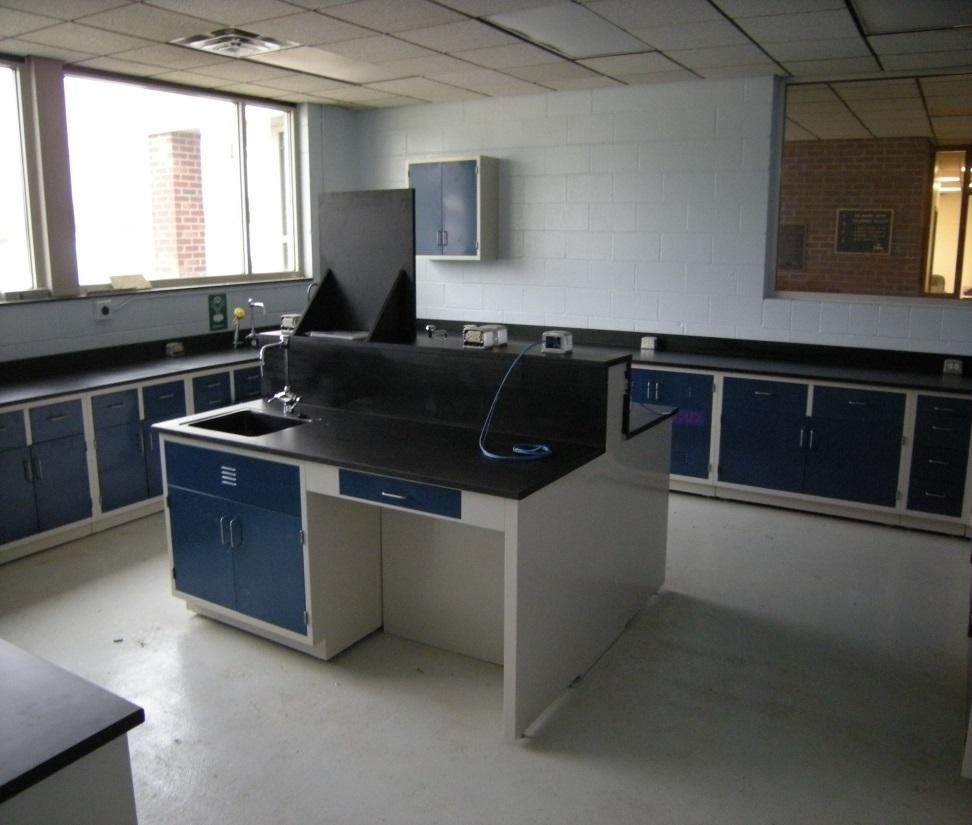
32 Water Plant Education Center Interactive Exhibits for Delaware Water History, Treatment Process, Water Cycle, and Water Conservation 32
33 33
34 34
35 35
36 36
37 37
38 38
39 2015 Amount of water produced vs. Amount of water wasted In 2015 the daily amount of water wasted vs. the total amount produced was 14.7 %. Meaning if 4.5MGD was the total raw pump age (total MGD production for surface and groundwater pumped for the day) on average 3.84 MGD was produced. So far in 2016 this average has been 14.8%. 39
40 40
: 1.0 mg/l Nitrates: <5 mg/l Limit 10mg/l Atrazine: <1.")
41 City of Delaware Water Plant Expansion and Improvements Project Completion May 2015 Project Cost Original contract fee - $30,567,000 Final Project fee - $30,448,751 Finished Water Quality Goals Hardness: <140 mg/l Total Organic Carbon (TOC): 1.0 mg/l Nitrates: <5 mg/l Limit 10mg/l Atrazine: <1.5 ug/l Limit 3ug/l TTHM: <50 ug/l Limit 80ug/l 41

42 City of Delaware Public Utilities Department 36 Employees; WWTP (14) employees, WTP (8) employees, Water Distribution (7) employees & Sewer Collections (7) employees miles of water mains sized from 2 to water valves water meters 9877 curb boxes 2269 fire hydrants 162 miles of sewer mains sized from 6 to manholes in the sewer system miles of storm water mains manholes in the storm water system catch basins in the storm water system Billion gallons of potable water was sent to our customers in the water distribution system the average daily production was 3.7 MGD. So far the average daily production for 2016 has been 3.3 MGD Billion gallons of water collected from the sewer system and was treated thru the WWTP the average daily flow thru the WWTP was 4.58 MGD. So far in 2016 the average flow thru the WWTP has been 4.94 MGD. 42


43 Questions? Tom Hinson City of Delaware Public Utilities Department Water Plant Manager 3080 US Highway 23 North Delaware, Ohio