Field Performance of Dispersive Colloidal Activated Carbon
|
|
|
- Pierce Ashley Gordon
- 5 years ago
- Views:
Transcription


1 Field Performance of Dispersive Colloidal Activated Carbon Lessons Learned from Multiple Geological Settings Ashley Cedzo M Ed Jeremy Birnstingl PhD, Craig Sandefur MS, Kristen Thoreson PhD
2 Presentation Outline Background and technology basics *short recap: additional info available via webinar recordings Usage statistics and aggregate field performance to date Lessons learned The road ahead? Q&A
3 A new Class of Technology. A combination of sorption and enhanced bioremediation Activated carbon Previously and currently been used on the surface as a groundwater treatment technology Utilized in the subsurface for the last 5-10 years Regenesis R&D efforts (2007): Focus on use of particulate sorbents to bind dissolved contaminants in situ. Problem: Activated carbon and other sorbent particulates do not disperse in the aquifer waters and requires fracturing (grain displacement).
 due to large particle size and agglomeration.")
4 Activated carbon facts- Granular Activated Carbon particles: > 1000 µm Powdered Activated Carbon particles: 40 to 100 micrometers diameter Agglomerate to >1000 µm in water Soil Pore Throat Diameter Silts/Sands Est. Range: 3-30 µm PROBLEM: Injecting granular or powder activated carbon requires fracturing of aquifer formation (grain displacement) due to large particle size and agglomeration. Results in: Inefficient placement Only partial treatment of subsurface Can compromise monitoring wells 2015 All Rights Reserved. REGENESIS and REGENESIS product(s) are registered trademarks of REGENESIS Remediation Products.
5 The Reagent what it is A highly dispersive, flow-able sorbent and microbial growth matrix Sorbent Rapid drop in dissolved-phase contaminant concentration Immediate risk-reduction Microbial growth matrix Accelerated bio-destruction of sorbed mass Ability to secure clean-up to much lower targets


6 The Reagent what it is Colloidal activated carbon (1 2 µm) Size of a bacterium suspends as liquid Huge surface area extremely fast sorption Proprietary anti-clumping / distribution supporting surface treatment (patent applied for) Core innovation Enables wide-area, low-pressure distribution through the soil matrix without clogging


7


8 Contaminants Sorbed, Now What? Primary Methods of Contaminant Destruction Aerobic Treatment Electron Acceptor Addition, Sparging Anaerobic Treatment Slow release electron donors Lactate, recirculation systems Enhanced Monitored Natural Attenuation All Rights Reserved. REGENESIS and REGENESIS product(s) are registered trademarks of REGENESIS Remediation Products.

9 PlumeStop : reagent distribution


10 PlumeStop Powdered Activated Carbon

11 Regulatory Agency Finds >72% False Positives in Sites Treated with Powdered Activated Carbon


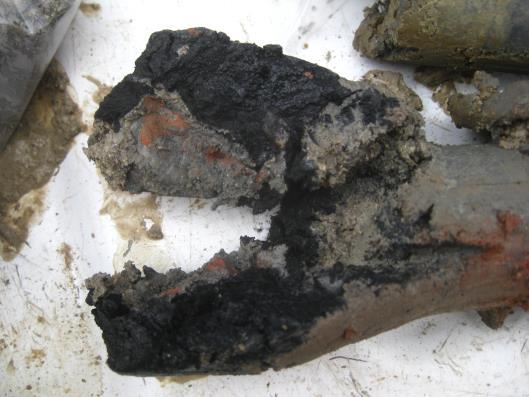


12 Fracture-emplaced Powdered Activated Carbon Flow-emplaced Liquid Activated Carbon Field application all about ensuring placement in flow-zones
13 - usage -

14 PLUMESTOP APPLICATIONS OCTOBER 2016
 Full 40")
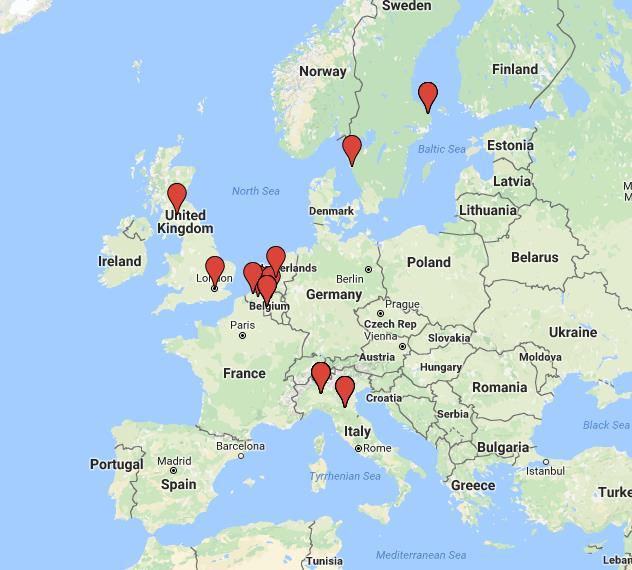
15 PlumeStop Applications July 2016 Number of sites = 66 Number of states = 23 Number of countries = 7 States CA, CO, GA, IA, IL, IN, KY, MA, MI, MO, NC, NE, NJ, NM, OH, PA, PR, SC, TX, UT, WA, WI, WV Countries USA, Canada, Italy, Belgium, UK, Sweden, Netherlands Scale Pilot 26 (39%) Full 40 (61%)
16 PlumeStop Applications July 2016 Principally Hydrocarbons (aerobic bio) = 31 Principally Solvents (anaerobic bio) = 31 Comingled / no dominant class = 4 Other contaminants of note PAH, freon-11, MtBE, TBA, chlorobenzene


17 All available site performance data pooled 24 sites Wells within expected zone of impact highlighted and assessed i.e. those wells within treatment grid and/or advective distance Total contaminant reductions monitored over time Performance histograms created full data set Initial capture Stability to date - performance analytics -
18 chlorinated ethanes (TCA, DCA, CA etc.) chlorinated ethenes (PCE, TCE, DCE, VC etc.) Freon-11 (CFC) TPH BTEX MTBE PAHs Chlorobenzene (MCB)
19 >95% reduction within 90 days - 65% (typically to < MDL) >90% reduction within 90 days - 70% >80% reduction within 90 days - 90% <65% reduction within 90 days - 10%
20 Stability to date?
21 70% show no change or drop further 85% remain within 10% of initial result Data Set: Long term is up to 738 days Average is 199 days The remainder (bar one) were pilot tests
22 Data Set: Long term is up to 738 days Average is 199 days

23 - lessons learned -
24 Lessons Learned Lesson #1 It s not about how much you can get in the ground It s not about how far away you can see it s moved It s about how much of the flux you can intercept Lesson #2 Getting it in the ground is easy But ensuring optimal distribution is an art Bad: >90% of placement intercepting <10% of the contaminant flux Good: >90% of the placement intercepting >90% of the contaminant flux


25 Pre-Application Design Verification

26 Flux-Zone (Design) Verification Testing What is flux-zone verification? Pre-application field-verification of remedial design parameters High-resolution identification of contaminant transport strata Undertaken by Regenesis design/injection personnel Enables accurate placement of reagents for maximum flux-interception Why is it necessary? Site investigations typically focus on liability and risk assessment Emphasis on contaminant identification, plume dimensions and migration pathways Flux-zone verification focuses on efficient reagent-contaminant contact Emphasis on identification of principal impacted strata, contaminant mass distribution and reagent delivery

27 Regenesis Flux-Zone Verification When is it undertaken? 4 6 weeks ahead of planned application Allows time for data analysis and design refinement What does it entail? Representative Soil Cores Field Hydrometer Testing Groundwater sampling/pid Readings Clear water injection testing Regenesis PlumeStop strategy of 100% success
28 DVT - Regenesis PlumeStop Strategy of Success What is the outcome? UN-IDENTIFIED HYDROGEOLOGICAL CONDITIONS 46% 80% of tests to date have found unanticipated results (technical blind spots) 2 / 3 of preliminary designs have been modified / refined 80% of design changes have been cost-neutral LOWER INJECTION RATES/ROI UN-IDENTIFIED CONTAMINANT TRANSPORT ZONE THICKER CONTAMINANT ZONE HIGHER CONTAMINANT CONCENTRATIONS 25% 21% 18% 18% 0% 10% 20% 30% 40% 50%

29 - The Road Ahead -


 -")

30 PlumeStop Integration with Fate & Transport Models We now have the engineering ability to emplace the desired retardation factor into the transport zones PlumeStop BioChlor - Arturo Keller (UCSB) - - Dial-in the desired outcome - Explore design options Then turn it into reality


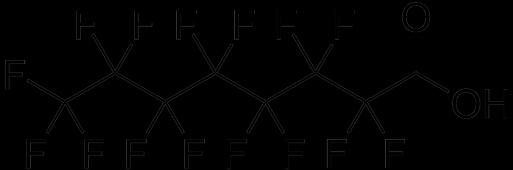


31 - Perfluorinated Compounds -

32 Take Home We can now turn the subsurface into an activated carbon filter To capture contaminants and focus bioremediation Secure stringent targets faster manage back-diffusion To passively engineer plume dynamics Long term migration control without pumping Groundwater flow remains uninterrupted The retardation factor is now an engineering variable


33 Thank You Ashley Cedzo M Ed Northwest District Technical Manager Bend, OR acedzo@regenesis.com