Minnesota Nutrient Management Initiative. On-Farm Evaluation of Nitrogen and Phosphorous Nutrient Management
|
|
|
- Edmund Fletcher
- 5 years ago
- Views:
Transcription


1 Minnesota Nutrient Management Initiative On-Farm Evaluation of Nitrogen and Phosphorous Nutrient Management


2 Nutrient Management Initiative On Farm Evaluation Sponsored by USDA-NRCS in collaboration with MDA. Purpose Nutrient Management Education Evaluate economics of nutrient management decisions Assists NRCS with evaluating nutrient management guidance MDA s requirements of State s Nitrogen Management Plan BMP effectiveness

3 Eligible Areas of the State *Outside of Areas 4, 5, 6, & 7 Any Vulnerable Wellhead Protection Area


 No manure")


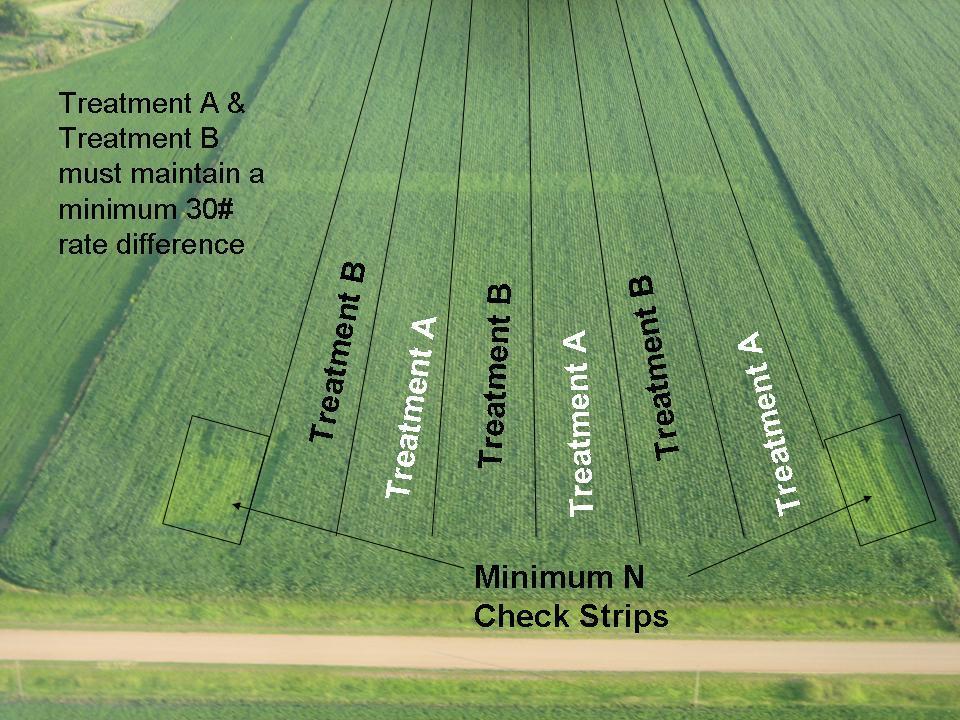
4 Nutrient Management Initiative Design Either nitrogen or phosphorous site 2 Rates replicated 3X (N plots require 2 0 rate checks) No manure or alfalfa history for past 5 years Current soil test required High and very high testing phosphorous fields


5 Nutrient Management Initiative Design Strip size minimum of 40 wide by minimum of 600 long can be larger No N check= length Nitrogen Guidance # per Acre corn following soybeans # per Acre corn following corn Maintain at least 30# rate separation Harvest 1 combine swath per 40 strip width Weigh wagon yield monitor
6


7 Payment and Data Submittal Farmer receives payment through USDA- NRCS EQIP program for participation Farmer required to work with Certified Crop Adviser Cropping information submitted by July 1 st Harvest information submitted by December 1 st
8 County Dakota Previous Crop Soybeans Soil Test Information Township Marshan History 2nd year continuation Texture sandy loam Tillage System Fall Chisel & Spring Tillage O.M.% 2.1 Irrigated Planting Date Row width Population Hybrid/Variety ph 6.3 Yes 4/24/ ,000 Pioneer 35F40 Buffer ph 6.9 Pesticide: Laudis Buccaneer-plus 0 PhosBray ppm 58 Rate 2.5 oz. 1 qt. 0 Phos Olsen ppm 79 Harvest Date 11/16/2009 Comments: Pottasium ppm 195 Treatment A-* (1) Nutrient Source Cost per ton Rate lbs./acre Application Date Timing/ Placement Applied on N Check N total lbs./a P2O5 total lbs./a K2O total lbs./a Sulfur Zinc $ /08/08 Fall Brdcst Yes $ /28/09 Pre-Plant Brdcst Yes $ /24/09 Starter Yes $ /20/09 Pre-Plant Brdcst Yes Nutrient Source $ /28/09 Post Brdcst No $ /25/09 Fertigation Yes Nitrogen Stabilizer Used? Treatment B-* (2) Cost per ton Rate lbs./acre No TPF/Acre Application Date Timing/ Placement Applied on N Check N total lbs./a P2O5 total lbs./a K2O total lbs./a Sulfur Zinc $ /08/08 Fall Brdcst Yes $ /28/09 Pre-Plant Brdcst Yes $ /24/09 Starter Yes $ /20/09 Pre-Plant Brdcst Yes $ Post Brdcst No $ Fertigation Yes Nitrogen Stabilizer Used? Yield Results 2009 Nutrient Management Initiative Results Nitrogen Rate Comparison Total Plant Food Per Acre Total Plant Food Per Acre No TPF/Acre Weighing Method Weigh Wagon Harvested Adjusted Lodging Strip Length in Row Width # of Rows Harvest Score 1-5 Yield Number Total N Feet Inches Harvested % Moisture Test Weight Weight 15.5% (5 worst) Averages Check Check Ave Treatment A (low) Treatment B (high) Check Economic Evaluation Report Sent to Participating Farmer and Crop Consultant Nitrogen Cost per lb. of actual N 0.27 *Based on farmers actual costs & predominant nitrogen source Nitrogen to Corn Price* Ratio 0.08 University of Mn. Rate Guidelines Corn price based on $3.50 per bushel--results from South-central Minnesota Farm Business Management Additional Cost for 40 lbs. of N per acre $10.80 Yield Difference from Additional N bushels/acre or $35.33 Net Return from Additional N per $3.50/bu $24.53 *(1) Treatment A Guidance for NMI Program-- corn following soybeans #/a corn following corn #/a *(2) Treatment B--Must maintain a minimum 30# rate difference


9 2009 Nutrient Management Initiative Locations 34 Nitrogen 3 Phosphorous 22 Counties
10 Yield Advantage from Additional N 100% 80% 60% 40% 20% 0% 100% 100% 78% 43% 94 Sites 75% 80% 60% 56% Corn following Soybeans Corn following corn
11 90% 80% 70% 60% 50% 40% 30% 20% 10% 0% Economic Advantage from Additional N 94 Sites 78% 56% 58% 56% 56% 33% 40% 25% Corn Following Soybeans Corn following Corn
12 $ Corn following Soybeans Profit/Loss from Additional N $ $ $80.00 $60.00 $40.00 $ Sites with Losses >$5.00/A $3.23 $7.66 $8.36 $ Sites with Profits >$5.00/A $13.98 $17.43 $18.00 $19.14 $24.53 $28.77 $29.63 $46.87 $54.09 $0.00 -$ $ $ $ $ $ $ $ $ $ $ $ $5.86 -$2.28 -$0.42


 190 bu.")
 196 bu.")

13 09 Corn following Soybeans (25 sites) Average price paid for N= 55 per pound N price to corn price($3.50) =.16 Ratio U of M Guidance Treatment A (low) rates ranged #/A Low end ( bu./a) 190 bu. Ave. High end ( bu./a) 196 bu./ Ave Treatment B (high) rates ranged #/A Low end ( bu./a) 191 bu. Ave High end ( bu./a) 211 bu. Ave
14 Value of Corn minus N Costs $ $ $80.00 $60.00 $40.00 $20.00 $0.00 -$ $ $60.00 Corn Following Soybeans (Value of Additional Corn minus N Cost) $33.90 $1.50 $57.75 $11.12 $37.98 $ $3.12 $7.66 -$6.57 -$ $ $ Highest Return Lowest Return Median Value
15 -$ $ $ $17.82 $8.82 $12.32 $14.66 $15.70 $24.72 Corn following Corn Profit/Loss from Additional N $30.00 $20.00 $10.00 $0.00 -$ $ $ $ $ Sites with > $17 per Acre Loss 5 Sites with > $8 per Acre Profit
 Average price paid for N=")
 =.")
 rates ranged")
 149 bu. Ave.")
 190 bu.")

16 2009 Corn following Corn (9 sites) Average price paid for N= 47 per pound N price to corn price($3.50) =.13 Ratio U of M Guidance Treatment A (low) rates ranged #/A Low end ( bu./a) 149 bu. Ave. High end ( bu./a) 190 bu./ Ave Treatment B (high) rates ranged #/A Low end ( bu./a) 145 bu. Ave High end ( bu./a) 191 bu. Ave
17 Value of Corn minus N Costs $70.00 $60.00 $50.00 $40.00 $30.00 $20.00 $10.00 $0.00 -$ $ $ $ $50.00 Corn Following Corn(Value of Additional Corn minus N Cost) $22.50 $34.18 $ $ $ $ $ $ $ Highest Return Lowest Return Median Value $24.72 $8.82 -$43.94


18 Other Observations in 2009 N prices were 13% higher in % of sites had split applications of N 13% less yield on corn following corn Check strips resulted in 70% of yield 70% of the time. Efficiency of Corn Production S-C # of N per bushel of corn C-C # of N per bushel of corn


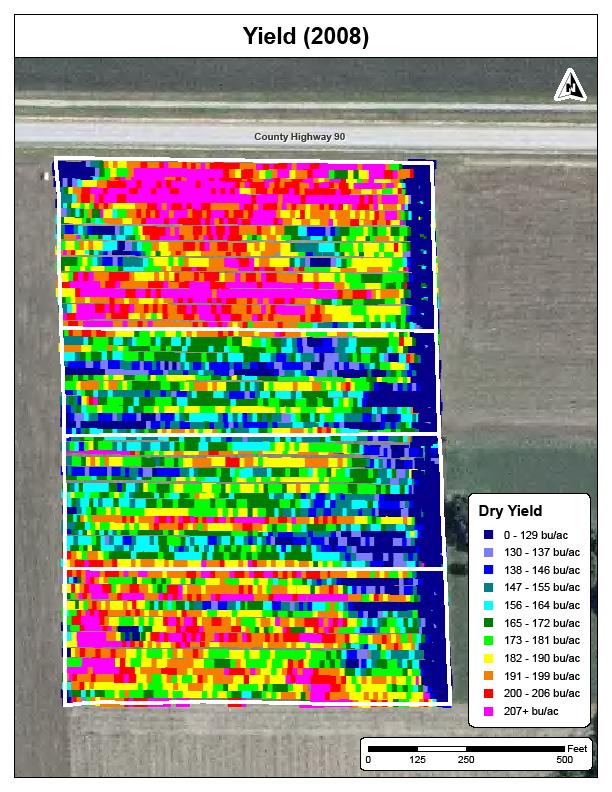
19 Hwy 90 Drainage Demonstration Water Quality and Nutrient Management Demonstration

20 Water Quality Demonstration Evaluating BMP Effectiveness Nutrient Management Influence on: Water Quality Farm Economics Drainage Characteristics Environmental Challenges
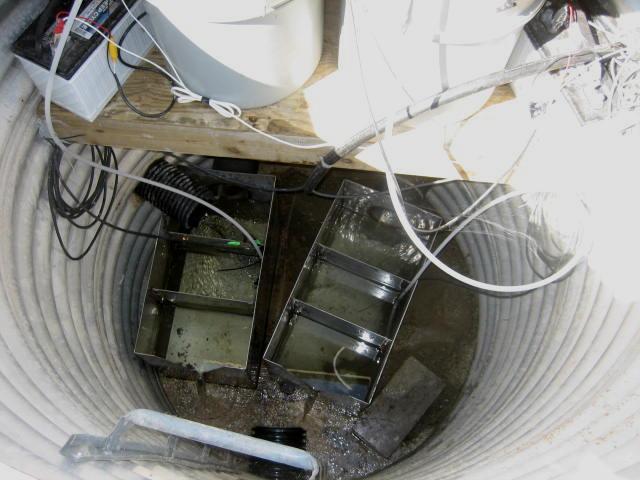
21 Monitoring Equipment
 H-1 S-2 80 Spacing U of M Guidance")

22 Hwy 90 Design H-2 80 Spacing Optimum Production (Fall N) H-1 S-2 80 Spacing U of M Guidance Spring Applied N 50 Spacing U of M Guidance Spring Applied N S-1 50 Spacing Optimum Production (Fall N)
 Spring AMS/Urea(26#) P & K 90-90 (uniform) N-1 BMP 160-68-2 Spring Urea 160-68-2 Spring Urea None 115-85-0-19 Spring NH3 (75#) Spring AMS/Urea(26#) P&K 85-0")
23 Watershed Hwy 90 Nutrient Applications 2007 Corn-Corn 2008 Corn-Corn 2009 Soybean 2010 Soybeans-Corn N (variable rate) Fall NH3 No N- Serve (variable rate) Fall NH3 w/n- Serve None Fall NH3 (100#) Spring AMS/Urea(26#) P & K (uniform) N-1 BMP Spring Urea Spring Urea None Spring NH3 (75#) Spring AMS/Urea(26#) P&K 85-0 (variable) S-2 BMP Spring Urea Spring Urea None Spring NH3 (75#) Spring AMS/Urea(26#) P&K 75-0 (variable) S (variable rate) Fall NH3 No N- Serve (variable rate) Fall NH3 w/n- Serve None Fall NH3 (100#) Spring AMS/Urea(26#) P & K (uniform)

24 Phosphorous Soil Test Results

25 South Hwy 90 Drainage Site 9/6/08
26

27 +$28/A Fert. Cost $91.00 Fert. Cost $ Corn Value=$3.50/ Bushel Other Costs excluding Fertilizer =$380
28 Bushels per Acre Hwy 90 Yields & Economic Results $158 Fert. Costs $ U of M Guidance Spring Applied N +$61 /A $219 Fert. Costs $ Optimum Production Variable Rate P & K Fall N Yield Net Corn Value=$4.50/ Bushel Other Costs excluding Fertilizer =$425

29 Hwy 90 Rainfall yr. Avg. January February March April May June July August September October November December Annual Total
30 (inches of Drainage) Inches of Drainage from Hwy 90 Fields 12 31% BMP non-bmp % %
31 (cfs) Drainage Hydrograph S1 Flow S2 Flow N1 Flow N2 Flow Mar Apr Jun Aug Sep Nov Jan-10
32 Drainage (inches) Hwy 90 Watershed Drainage Amounts Drainage (inches) 80 Spacing Spacing S1 S2 (BMP) N1 (BMP) N2
33 (mg/l) Nitrate-N Concentration in Tile Water Drinking Water BMP non-bmp Standard for Some Streams # N 185 # N 160 # N 193 # N Soybeans
34 (mg/l) Drainage (inches) NO3-N Spacing 80 Spacing S1 S2 (BMP) N1 (BMP) N2
35 (mg/l) Nitrate-N Concentrations Hwy 90 & LeSueur River Le Sueur River Highway 90 BMP 13.0 Highway 90 Non-BMP Safe Drinking Water Standards
36 (lbs/acre) Nitrate-N Leaching Loss from Hwy 90 Tile 25 BMP non-bmp # N 185 # N 160 # N 193 # N Soybeans
37 lbs/acre Nitrate-N Leaching Loss (LeSueur) Le Sueur River Highway 90 BMP Highway 90 Non-BMP
38 (mg/l) Hwy 90 Total Phosphorus FWMC BMP non-bmp 0.17 New Phosphorus Standard for Lakes
39 lbs/acre 0.30 Hwy 90 Total Phosphorus Leaching Loss Only a 0.18 % Loss BMP non-bmp # P 150 # P # P 150 # P
40 lbs/acre LeSueur River & Hwy 90 Total P Loss 2.50 Le Sueur River Highway 90 BMP Highway 90 Non-BMP
41 Flow (cfs) 2007 Total Phosphorus Sample Results Concentration (mg/l) 0.72 S2 Flow N2 Variable rate (151#Total-P) N1 (68#)Total-P Elevated levels of total phosphorus lost S2 (68#)Total-P S1 Variable rate(149#total-p) Proposed Phosphorus Lake Standard~0.09 mg/l /5 3/30 4/24 5/19 6/13 7/8 8/2 8/27 9/21 10/16 11/10 Date
42 2008 Total Phosphorus Sample Results High total phosphorus losses in spring. Proposed Phosphorus Lake Standard~0.09 mg/l

43 Nutrient Management Web Site Brian Williams Minnesota Department of Ag