Assessing Multiple Functions of Missouri s Bottomlands: Laying the Groundwork For Wetland Conservation
|
|
|
- Monica Brooke Park
- 5 years ago
- Views:
Transcription
1 Assessing Multiple Functions of Missouri s Bottomlands: Laying the Groundwork For Wetland Conservation Frank Nelson (MDC), Dave Diamond (MoRAP), Doreen Mengel (MDC), Andy Raedeke (MDC),
2 Project currently in progress Collaboration by: EPA, MDC, and MO Resource Assessment Partnership Projected to finish by Sept Presenting Preliminary Results Outline context of Missouri s wetland landscape Identify Past Habitats Elements Driving Function Capturing the Current Conditions Options for Future Directions

3 A Common Mission of Balance Association of State Floodplain Manager s Mission: Balance current and future flooding impacts Human suffering, losses, and costs Protect the natural and beneficial functions of floodplains without causing adverse impacts


4 A Common Mission of Balance Missouri Department of Conservation s Wetland Conservation Mission: To protect, restore, and enhance wetland ecological functions and values for multiple social and natural resource benefits Also implies a balancing act

5 We all tend to have our biases Depending upon expertise and livelihood May focus on the economics May focus on a specific critter or recreational use Rarely do we appreciate the services running in the background that sustain the economics, species, and recreational opportunities.


6 Balancing Act To achieve our collective missions: Need to identify the various pieces of the puzzle, both past and present Figure out how they go together And identify the missing pieces What can fill in the future
7 Missouri Wetlands Missing Pieces Lack comprehensive layer of: Historic floodplain habitats How much wetlands did Missouri have? Best source is 1990 report by Dahl, Wetland losses in the US 1780 s to 1980 s

8 Millions, Acres Missouri Wetlands Missing Pieces Lack comprehensive layer of: Historic floodplain habitats How much wetlands did Missouri have? Best source is 1990 report by Dahl, Wetland losses in the US 1780 s to 1980 s Missouri had 4.8 million acres But only 643,000 acres in
 is outdated and additional wetland acres have been converted to crop land How much?")
9 Millions, Acres Missouri Wetlands Another Missing Piece Lack comprehensive layer of: Current floodplain habitats NWI Polygons National Wetlands Inventory (NWI) is outdated and additional wetland acres have been converted to crop land How much??? Converted crop land

 Program has added ~150,000")

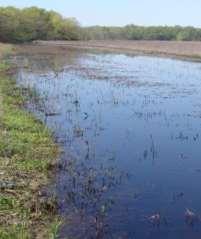
10 Millions, Acres Missouri Wetlands Another Missing Piece Lack comprehensive layer of: Current floodplain habitats Wetland Reserve Easement (WRE) Program has added ~150,000 acres to Missouri s floodplains So how much overall??? Restored wetland in WRE


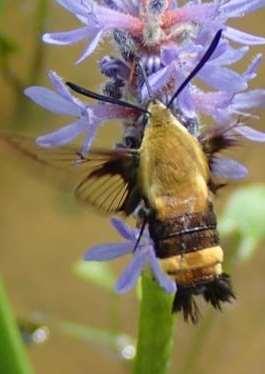
11 How do the pieces fit together? Not just about numbers? What was the contribution? What role do they play today? Adding to Water Table Flood Damage Reduction Water Quality Pollination


12 Consensus on Need Multiple agencies agreed Missouri needed better: Historical Wetland Baseline Current Wetland Extent Tie to Ecological Functions/Services Several examples on how to accomplish this from other states and watersheds


13 Considering Missouri s Unique Landscape Glacial Riverine Coastal Wetland formation is different from other parts of the US Our assessment of wetlands may be tweaked Roberta H. Yuhas, USGS, Water-Supply Paper 2425, National Water Summary on Wetland Resources, 1996


14 Considering MO s Regional Variation in Terrestrial Communities Central Dissected Till Plains Osage Plains Mississippi Lowlands Ozark Highlands

15 Considering MO s Regional Variation in Aquatic Communities


16 Created Ecological Wetland Regions Hybrid of Terrestrial/Aquatic Systems Combined Terrestrial Breaks and Watershed Boundaries 9.6 million bottomland acres =22% of MO s 44 million acres 7 Regions w/ Sub-Regions Focused on Bottomlands
17 Establishing the historic baseline Missouri Ecological Classification System (ECS) MDC and NRCS Developed Geospatial Dataset Spatial extent 1-100s acres Soil map unit scale (>5 acres) Defines Communities Based Geo-Landforms Geo-Landforms Soil Properties Vegetation ECS Soil Properties Vegetation
18 Establishing the historic baseline Missouri Ecological Classification System (ECS) Works out well for describing MO bottomland habitats Consider Geo-landforms Upland Drainageways Terraces High and Low Floodplain ECS
19 Establishing the historic baseline Missouri Ecological Classification System (ECS) Works out well for describing MO bottomland habitats Consider Soils Clays Silty Loam Sandy ECS
20 Establishing the historic baseline Missouri Ecological Classification System (ECS) Works out well for describing MO bottomland habitats Consider Soils and Vegetation


21 Millions, Acres Establishing the historic baseline Missouri Ecological Classification System Including bottomland habitats ~9.5 million acres Look at the wetter habitats new historic wetland est. = 6 million acres, an increased amount from Dahl 1990 MO Bottomland Dryer Wetter
22 Establishing the historic baseline Distribution of Bottomland Acres by Region Loess H. Grand and Missouri River Mississippi R. Mississippi Lowlands Salem Plt. Spfd Plt. Osage R Millions of Acres
23 Establishing the historic baseline Percent Wetter/Dryer Bottomland within Region Loess Hills Grand and Missouri River Mississippi R. Loess Hills Grand and Missouri River Mississippi River Mississippi Lowlands Salem Plateau Osage R. Salem Plateau Wetter Dryer Springfield Plateau Osage River Mississippi Lowlands Geology and Big Rivers Influence the Wet/Dryness Springfield Plateau


24 Forest Prairie Good Regional Summaries of Historic Habitats Sub Region: Grand River Hills Common Ecological Site Descriptions Mollic Wet Upland Drainageway Prairie and Savanna Mollic Wet Terrace Prairie & Savanna Wet Floodplain Prairie Wet Floodplain Woodland Loamy Floodplain Riverfront Forest 62% Prairie 28% Forest 6% Woodland
25 Next Step: Linking Historic Communities to Ecosystem Functions Needed to Establish What are the major drivers? Derived from literature How functions might differ across Missouri s landscape?
26 Next Step: Linking Historic Communities to Ecosystem Functions Selected Functions Flood Damage Reduction Streamflow Maintenance Carbon Sequestration Phosphorus Retention Nitrogen Reduction
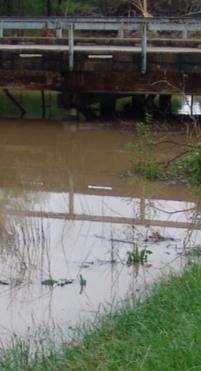
27 Missouri Bottomland Functions: Flood Damage Reduction Major Drivers Adjacent to rivers and streams Lateral Connectivity
28 Missouri Bottomland Functions: Flood Damage Reduction Major Drivers Adjacent to rivers and streams Lateral Connectivity Slowing flow Not adjacent to rivers and streams Storing water Slowing run-off

29 Missouri Bottomland Functions: Flood Damage Reduction Summit Shoulder Backslope Rankings Driven by: Flood Frequency Cover Type Landscape Position Sinkhole Upland Drainageway Toeslope/ Footslope Terrace Low Terrace/ Floodplain step Floodplain

30 Missouri Bottomland Functions: Flood Damage Reduction Moderate Higher Closer to the River High Low Exceptional None
31 Missouri Bottomland Functions: Flood Damage Reduction Preliminary Results for Historic Potential Loess Hills Mississippi R Grand and Missouri River Mississippi Lowlands Osage River Springfield Plateau Salem Plateau Flood Damage Reduction, Acres Big River Legend systems Exceptional More Lateral Connectivity High Moderate Low More Space to None Slow Flow Acres in Millions

32 Missouri Bottomland Functions: Flood Damage Reduction Preliminary Results for Historic Potential Big River Legend systems Exceptional More Lateral Connectivity High Moderate Low More Space to None Slow Flow
33 Missouri Bottomland Functions: Streamflow Maintenance Major Drivers Headwater locations Collective Input of Smaller Streams Add Up
34 Missouri Bottomland Functions: Streamflow Maintenance Major Drivers Headwater locations Discharge wetlands Connected to aquifer Sinkholes Upland drainageways, Springs, and footslopes
35 Missouri Bottomland Functions: Streamflow Maintenance Major Drivers Headwater locations Discharge wetlands Connected to aquifer Bank-storage and Infiltration
36 Missouri Bottomland Functions: Streamflow Maintenance Summit Shoulder Backslope Rankings Driven by: Landscape Position Soil Texture Sinkhole Upland Drainageway Toeslope/ Footslope Terrace Low Terrace/ Floodplain step Floodplain


37 Missouri Bottomland Functions: Streamflow Maintenance Exceptional Discharge Locations High Higher in Watershed Moderate Low
38 Missouri Bottomland Functions: Streamflow Maintenance Preliminary Results for Historic Potential Streamflow Maintenance, Acres Loess Hills Mississippi R Grand and Missouri River Mississippi Lowlands Osage River Springfield Plateau Salem Plateau Legend Exceptional High Moderate Low Ozark Hills Should None Be Contributing More Acres in Millions


39 Missouri Bottomland Functions: Streamflow Maintenance Preliminary Results for Historic Potential May need to link soils data to adjacent stream order Ranking is working in some locations Legend Exceptional High Moderate Low Ozark Hills Should None Be Contributing More But not in others

40 Missouri Bottomland Functions: Carbon Sequestration Major Drivers Organic Soils Geologic Timescale Slow Accrual Occurs With Slow Decomposition Under Continually Flooded Conditions Organic soils only occur in Missouri in a few isolated locations and as inclusions within soil map units However, Wettest Communities: Ponded Floodplain Prairie, Swamp, Ponded Sinkhole Wetlands, and Ozark Fens
41 Missouri Bottomland Functions: Carbon Sequestration Major Drivers Organic Soils Geologic Timescale Mineral Soils Sedimentation Less Further Away More Near Active Channel
42 Missouri Bottomland Functions: Carbon Sequestration Major Drivers Organic Soils Geologic Timescale Mineral Soils Sedimentation Soil Organic Carbon Less in Forested Systems More in Prairie Systems

43 Missouri Bottomland Functions: Carbon Sequestration Major Drivers Organic Soils Geologic Timescale Mineral Soils Sedimentation Soil Organic Carbon Phytomass Trees cycle carbon longer Through photosynthesis plants accrue and store carbon above and below ground
44 Missouri Bottomland Functions: Carbon Sequestration Summit Shoulder Backslope Rankings Driven by: Wetness Decomposition Rate Sinkhole Upland Drainageway Fens Exceptional Toeslope/ Footslope Terrace Low Terrace/ Floodplain step Floodplain


45 Missouri Bottomland Functions: Carbon Sequestration Moderate Wetness & Plant Cover High Exceptional Captures Ozark Fen Contributions
46 Missouri Bottomland Functions: Carbon Sequestration Preliminary Results for Historic Potential Carbon Sequestration, Acres Loess Hills Mississippi R Grand and Missouri River Mississippi Lowlands Osage River Springfield Plateau Salem Plateau Size/Acres is wrong metric to highlight Ozark fens, islands of carbon Legend Exceptional High Moderate Low None Acres in Millions

47 Missouri Bottomland Functions: Carbon Sequestration Preliminary Results for Historic Potential Missouri River Legend Exceptional High Moderate Perennial ponding at base/toe of hills Mismatch with where wetland restoration can occur on public land
48 Missouri Bottomland Functions: Nitrogen Reduction Major Drivers Denitrification Nitrate
49 Missouri Bottomland Functions: Nitrogen Reduction Major Drivers Denitrification Nitrate Little or No Oxygen
50 Missouri Bottomland Functions: Nitrogen Reduction Major Drivers Denitrification Nitrate Little or No Oxygen Organic Matter
51 Missouri Bottomland Functions: Nitrogen Reduction Summit Shoulder Backslope Rankings Driven by: Wetness Soil Texture Sinkhole Upland Drainageway Fens High Toeslope/ Footslope Terrace Low Terrace/ Floodplain step Floodplain

52 Missouri Bottomland Functions: Nitrogen Reduction Dry High Mod Wet None Dry Low
53 Missouri Bottomland Functions: Nitrogen Reduction Preliminary Results for Historic Potential Loess Hills Grand and Missouri River Mississippi R Mississippi Lowlands Springfield Plateau Salem Plateau Osage River Nitrogen Reduction, Acres Wetter Dryer N often limiting Legend Exceptional High Moderate Low None Acres in Millions

54 Missouri Bottomland Functions: Nitrogen Reduction Preliminary Results for Historic Potential Loamy Footslope Savanna Wet Terrace Prairie Mississippi R. Hills Wet Floodplain Prairie Legend Wet Floodplain Woodland Exceptional High Moderate Low None

55 Missouri Bottomland Functions: Phosphorus Retention Major Drivers Different from cycling nitrogen and carbon Phosphorus cycle occurs over a greater space and time scale Weathering of rock and transport to ocean
56 Missouri Bottomland Functions: Phosphorus Retention Major Drivers Binding to Soils Mineral Soil Clay Sand Prolonged Flooding Silt Silt
57 Missouri Bottomland Functions: Phosphorus Retention Major Drivers Binding to Soils Mineral Soil Organic Soil Silt Longevity of Ozark Fens point to high P accrual Silt
58 Missouri Bottomland Functions: Phosphorus Retention Major Drivers Binding to Soils Mineral Organic Sedimentation Way to bury soil bound phosphorus
59 Missouri Bottomland Functions: Phosphorus Retention Major Drivers Binding to Soils Mineral Organic Sedimentation Biological Uptake Growing Season Dormant Season Plants retain P temporarily
60 Missouri Bottomland Functions: Phosphorus Retention Major Drivers Binding to Soils Mineral Organic Sedimentation Biological Uptake Structure: Slows velocity Assists with sedimentation Assist with burial of P
61 Missouri Bottomland Functions: Phosphorus Retention Summit Shoulder Backslope Rankings Driven by: Landscape Position Soil Texture Sinkhole Upland Drainageway Fens High Toeslope/ Footslope Terrace Low Terrace/ Floodplain step Floodplain


62 Missouri Bottomland Functions: Phosphorus Retention Low Potential where sedimentation may occur or wet-but-not-too-wet Mod High Where Ozark Fens occur
63 Missouri Bottomland Functions: Phosphorus Retention Preliminary Results for Historic Potential Loess Hills Grand and Missouri River Mississippi R Mississippi Lowlands Springfield Plateau Salem Plateau Phosphorus Retention, Acres Wetter Dryer Osage River P often limiting Legend Exceptional High Moderate Low None Acres in Millions
64 Location, Location, Location Historical Function Potential Varied Ecological Site Description Ecological Functions Wet Upland Drainageway Prairie Loamy Footslope Forest Wet Terrace Prairie Wet Floodplain Praire Ponded Floodplain Prairie Loamy Floodplain Forest Flood Damage Reduction Phosphorus Retention Nitrogen Reduction Streamflow Maintenance None None Moderate High High Exceptional Low Low Low Moderate Low Moderate Moderate None Moderate High High Moderate Exceptional High Low Low Low Moderate Carbon Storage Moderate Moderate Moderate High Exceptional High Good start, needs a little more tweaking Forces the question what is your obj?


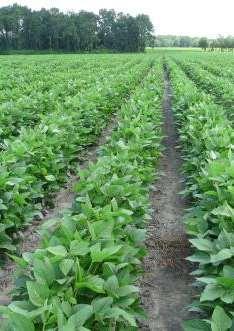
65 What about today s landscape? Geospatial Data Cropland Data Layer National Landcover Dataset Provide regional summaries Resolution can be an issue (30m) 5% 4% 4% 1% 2% 6% 9% 31% 38% Primarily Corn and Soybeans Missouri River Floodplain Loess Hills Region


66 What about today s landscape? Geospatial Data Other options to refine spatial data and inform current bottomland extent Enhanced NAIP: ERDAS Image Objects Landsat: Water Inundation Frequency Lidar: Topograpic Basins Lidar Veg. Height: Woody Habitats In Progress Better Resolution Current Extent
67 Accounting For Changes Compare past (ESD s) and present(cdl) Preliminary Results Check for Semi-natural vegetation (not crop/urban) ESD Locations with Semi-natural Veg. 100% 80% 60% 40% 20% 0% Ponded Floodplain Prairie Heavily Altered Wet Floodplain Prairie Linking the past to current extent Ponded Sinkhole Wetland Wet Upland Drainageway Woodland Still Intact

68 Accounting For Changes Compare past (ESD s) and present(cdl) Preliminary Results Check for Semi-natural vegetation (not crop/urban) *Doesn t count alteration in hydrology/fire *Doesn t count exotic plant communities..but it is a start ESD Locations with Semi-natural Veg. 100% 80% 60% 40% 20% 0% Ponded Floodplain Prairie Heavily Altered Wet Floodplain Prairie Ponded Sinkhole Wetland Wet Upland Drainageway Woodland Still Intact
69 Accounting For Changes Exceptional High Moderate Low Compare past and present functions None Flood Damage Reduction Streamflow Maintenance Carbon Sequestration Nitrogen Reduction Phosphorus Retention Levees and channelization, wetland drainage Land use practices including clearing and tillage Addition of fertilizers and run-off


70 Applying this Assessment Thinking about future goals and decisions Regionally Specific Vegetation is Semi-Natural Salem Plateau Over half is forested or pasture This is a good thing How do we maintain this? Pasture Forest Crops

71 Applying this Assessment Thinking about future goals and decisions Regionally Specific Local Partnerships Springfield Plateau Remaining fens and sinkholes often occur in clusters Perhaps potential to create local awareness and partnerships among adjacent landowners Options to protect or even enhance


72 Applying this Assessment Thinking about future goals and decisions Regionally Specific Local Partnerships Potential to Reframe Perceived Conflicts as Unrealized Opportunities Mississippi Lowlands Complete Land Transformation Farmers are living with flooding And still cropping Perhaps there are means to compensate for multiple services of these locations


73 Applying this Assessment Thinking about future goals and decisions Regionally Specific Local Partnerships Potential to Reframe Perceived Conflicts as Unrealized Opportunities A variety of options Assessment should help point out what is missing, what is working, and where improvement could be made
74 Project currently in progress Funded by MDC and EPA Projected to finish by Sept Preliminary Results Outlining Missouri s wetland landscape context Identify Past Habitats Elements Driving Function Capturing Current Conditions Options for Future Directions

75 By Gathering these pieces We can figure out they fit And have more complete picture of Missouri s bottomland Which can help us balance the needs This helps us achieve our mission

76 Questions