Ocean Acidification. Jan Newton University of Washington. Station Mauna Loa
|
|
|
- Shanna Lyons
- 5 years ago
- Views:
Transcription

1 Ocean Acidification Jan Newton University of Washington Station Mauna Loa
2 Ocean Acidification: A story revealed to us by a volcano and the oyster. Station Mauna Loa
3 Increasing CO 2 in the atmosphere Station Mauna Loa

4 Increasing CO 2 in the atmosphere CO 2 (ppm) Charles David Keeling Mauna Loa atmospheric CO Year Station Mauna Loa
5 Increasing CO 2 in the atmosphere CO 2 (ppm) Charles David Keeling Mauna Loa atmospheric CO Year Station Mauna Loa
 Station Mauna Loa pco 2 is")

6 CO 2 absorbed by the ocean Station Aloha pco 2 (μatm) Station Mauna Loa pco 2 is the CO 2 gas content of the air or water ph Doney, Science, 2010 Dore et al., PNAS 2009

7 Oceans are an important sink for the CO 2 Source: Le Quéré et al. 2012; Global Carbon Project 2012
8 Ocean acidification Climate change Carbon Dioxide (CO 2 ) Ocean acidification The ocean has adsorbed about 25-30% of carbon dioxide emitted by industry and deforestation. Sarah R. Cooley (scooley@whoi.edu)

9 Ocean acidification Climate change Carbon Dioxide (CO 2 ) Ocean acidification This creates an acidic reaction that lowers ph and decreases carbonate levels in the ocean. Sarah R. Cooley (scooley@whoi.edu)
10 The ph scale: How we measure acidity More acidic neutral More alkaline or basic Battery acid Lemon juice Vinegar Beer and Wine Milk Human blood ( ) Seawater ( ) Milk of magnesia Ammonia Lye ph is a logarithmic scale so that a ph change of 1 unit means a 10-fold change in acidity In other words, small changes in ph units mean much larger changes in acidity!
11 The ph scale: How we measure acidity More acidic Battery acid Lemon juice Vinegar Beer and Wine neutral More alkaline or basic Milk Human blood ( ) Seawater ( ) Milk of magnesia Ammonia Lye acidification
12 History and future of OA at the ocean surface ph CO 3 CO 2(aq) ph % acidity 16% [CO2 3 ] CO 2 and carbonate ion concentrations Year 0 Wolf-Gladrow et al. (1999)
13 History and future of OA at the ocean surface ph CO 3 CO 2(aq) ph Year % acidity 16% [CO2 3 ] % 50% CO 2 and carbonate ion concentrations Wolf-Gladrow et al. (1999)

14 Ocean Acidification CO added to seawater changes the 2 water chemistry, reducing the ph and carbonate levels in the ocean Image: Wikipedia
15 Ocean Acidification: A story revealed to us by a volcano and the oyster. Station Mauna Loa

16 Is OA affecting oyster survival?
17 Barton et al., 2012 Oyster larvae Production is lower with lower ph Growth in feeding stage slower with lower ph


18 Barton et al., 2012 Oyster larvae Production is lower with lower ph Growth in feeding stage slower with lower ph Waldbusser, OSU
19 Ocean Acidification: what we know 1. Atmospheric CO 2 has increased from human activity 2. The oceans absorb CO 2 3. The increased CO 2 causes ocean acidification (OA); this changes the water chemistry, reducing the ph and carbonate levels in the ocean 4. OA reduces growth and survivorship in some organisms

20 OA is a global condition with local effects

21 Global condition OA trend consistent across ocean basins Canary Is. Bermuda pco 2 ph Hawaii Source: IPCC 2013 [Carbonate]

22 Local effects

23 WA Blue Ribbon Panel Report, 2012
 [O 2 ] (μmol/l) Ω aragonite West Coast East Coast Jiang et al.")
24 Ocean Acidification: Upwelling Distance from shore (km) salinity Depth (m) [O 2 ] (μmol/l) Ω aragonite West Coast East Coast Jiang et al., L&O, 2010


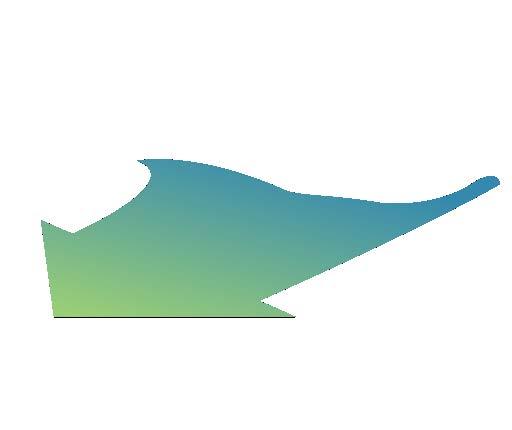

25 Seasonal upwelling brings high CO 2, low ph water to surface Wind Stress Offshore water displacement due to earth s rotation Upwelling Image: NOAA PMEL

26 Processes that fuel increased respiration yield higher CO 2 and lower ph CO 2 CO 2 Photosynthesis consumes CO 2 at the surface CO 2 Respiration releases CO 2 near the bottom Image: NOAA PMEL
 Science")
27 Are local stressors contributing too? Kelly et al. (2011) Science
 Impacts on the nervous system of some fish Potential increase in toxicity of harmful algal blooms Potential")
28 Implications for Marine Food Webs & Many biological processes are sensitive to changes associated with OA. These include: Ecosystem Services Increased mortality among pteropods (a type of plankton) Impacts on the nervous system of some fish Potential increase in toxicity of harmful algal blooms Potential loss of water quality benefits provided by shellfish, which filter nutrients out of marine waters Pteropod Photo: Russ Hopcroft

29 Implications for Marine Food Webs & Some responses could help us meet the challenge locally. These include: Seagrasses and kelps could partially mitigate local effects Ecosystem Services Some species may be able to adapt Photo: T. Klinger

30 The rate of change is rapid Oct CO 2 level: 391 ppm Figure source: based on published data through 2000

31 Rate of change is important Hönisch et al., Science, 2012


32 Ocean Acidification: Future directions What determines local nearshore CO 2 levels? How can CO 2 levels be measured easily and quickly? What management can reduce local OA? How fast and far can species acclimate and adapt? Where are the crucial tipping points? Which ecosystems are more or less resilient?