Skyhydrant. Membrane filtration. Project in cooperation with Norplan And Ministry of Rural Rehabilitation Department
|
|
|
- Garry Cunningham
- 5 years ago
- Views:
Transcription

1 Skyhydrant Membrane filtration Project in cooperation with Norplan And Ministry of Rural Rehabilitation Department May 2015 Written by Cecilie Kolstad
2 Summary Fetching water from rivers, springs and ponds are common by the rural population in Afghanistan. The quality range and a polluted water source is an emerging problem leading to frequent exposure towards waterborne diseases. This report focus on the performance of a membrane filtration unit, Skyhydrant, and how the turbidity affect the filtration rate (Output). The experiment was conducted from the 3 rd - 12 th of May The raw water tank was kept at a constant level maintaining a differential pressure of 2.5 meters. Manual cleaning was performed daily and when changing raw water. Measurements on total coliforms (faecal coliforms) and E.coli were conducted on the raw water, directly from the filter and from the fresh water tank. Turbidity and output was hourly measured. The output ranged from 360 l/h to 690 l/h, depending on the turbidity, hours of filtration and the frequency of backwashing. Results revealed that the filtrated water had a turbidity of 0 NTU and was free from total coliforms and E.coli. However, one sample taken from the freshwater tank reviled presence of total coliforms (Faecal coliforms).
3 Contents Summary... 2 Introduction... 4 Methodology... 5 Experimental setup... 6 Results... 7 Total Suspended solids (TSS) Discussion Conclusion References Pictures... 18
4 Introduction In the rural areas of Afghanistan, 61 % of the people lack access to potable drinking water (1). Most of them fetch water from rivers, springs, ponds and wells that are highly polluted (2). As a result water borne diseases is a common problem among the population, claiming the lives of children yearly (1), where diarrhoea, dysentery and cholera are the main illnesses (3). Pollution of surface water and groundwater is an emerging problem where physical, biological and chemical pollutants are the main objects, and as much as 90 % of the streams and wells in Afghanistan are contaminated (4). The surface water consist of mainly five river basins and they cover 90 % of the land (5). Estimates shows that the country has 75 billion cubic meters (BCM) of water, where 57 BCM are surface water (6). Surface water is exposed to various hazards and often require treatment when used for drinking purposes. Physical, chemical and biological pollutants are the three main groups (7) and they cause among others, - colour and taste, and the presence of particles and pathogens are common (8). They originate from sediments, storm runoff, direct discharge from industries and sewer systems, air contaminates, agriculture, and generally human pollution (9). However, there are the natural chemicals, originated from rocks and sediments that are the cause of most of the health problems (10). Turbidity of the water is one of the main indicators when evaluating the suitability of a water source used for drinking purposes (11). In order to meet the challenges related to drinking water it is essential to come up with sustainable technical solutions with the potential to produce safe drinking water. Membrane filtration is a physical barrier preventing materials up to a certain size to pass the filter, depending on the pore size of the filter. There are four different types of membranes; Ultrafiltration (UF), reverse osmosis (RO), nanofiltration (NF) and microfiltration (MF), depending on what degree of purification needed (12). Due to high levels of turbidity and colour in surface water in the central areas of Afghanistan, a UF membrane filter was selected for investigations for this project. This study has focused on how the raw water quality affect the frequency of backwashing the filter, water produced, and the treatment efficiency with respect to suspended solids (turbidity) and total coliforms (faecal coliforms) and E.coli of the filtrated water.

5 Methodology The skyhydrant is a gravity fed ultra-filtration unit with a nominal membrane pore size of 0.04 µm. The filter has a height of 1430 millimetres, width of 180 mm and a length of 250 mm. The approximated weight is 12 kilogram when the filter is dry and 27 kg when the filter is operating. The nominal capacity is set to be 400 to 1000 l/h, depending on the raw water quality and pressure. The maximum recommended turbidity of the raw water is 500 NTU. The pressure requirements is set to be between meters. All the outlets use 20 mm (3/4 ) connectors. A 20 mm water hose distributed the raw water to the filter, connector T1 (Figure 1). The raw water was filtered from downstream to upstream the filter where the filtrated water was discharged from T3 (Figure 1). A 20 mm water hose was thereby connected to T3 (Figure 1) and to the drinking water tank, having a volume of 1 m 3. Cleaning of the filter was performed by rotating the cleaning handles (Figure 1), and the backwash water was discharged out through T2 (Figure 1). The skyhydrant is designed to remove turbidity, bacteria, protozoa, cysts and to significantly reduce the level of viruses (13). For further instructions, regarding manual cleaning and additional technical specifications visit Figure 1: Skyhydrant (13)
6 Experimental setup The function has been assessed by evaluating the quantity of filtrated water (Output) without backwashing the filter, by having a stable pressure of 2.5 metres. Primary data was collected from 3 rd to 12 th of May, and turbidity, Output, total coliforms (faecal coliforms) and E.coli levels were registered, together with the frequency of manual cleaning. The raw water was pumped from the tanker truck and to the raw water tank. The pump was continuously pumping the raw water to the tank keeping the water level constant, and the overflow was circulated back into the tanker. The water was continually flowing through the system, and the filter was kept saturated when not in use. Water with different turbidity was fetched from the Lalander and Gulbagh River where the turbidity ranged from 15 to 331 NTU. The output was measured every hour using a bucket, and a 10 l and a 1 l cup measured the quantity. The measurement was taken directly from the filter, connector T3 (Figure 1). Tests regarding turbidity, total coliforms (faecal coliforms) and E.coli were performed daily on the MRRD lab. Hourly measurements on the turbidity was performed, using a turbidity meter, Hanna instruments HI 93703, with unit NTU. Measurements on Coliforms bacteria and E.coli were measured on both the raw water and the filtrated water, using the Readycult Water Check method and a Dehydrated Culture Media (Membrane Lauryl Sulphate Broth) provided by Avonchem. The incubator temperature was 37 for total coliforms (faecal coliforms) and 44 for E.coli. The Veterinarian lab in Kabul city performed a analyse on the turbidity, suspended solids, total coliforms (Faecal coliforms) and E.coli on the river water sampled the 9 th 10 th of May. A duplicate was tested in the MRRD lab for quality control. The water pump was of the brand Dulf Water Pump, model QDXL and had an effect of 0.37 kw (0.5HP). The Q rate of the pump was 1500 l/h.
7 Results On the 3 rd of May the raw water contained an initial turbidity of 140 NTU. After three hours of operating, the output decreased from 660 l/h to 600 l/h (Table 1). The filtrated water had a turbidity of 0 NTU. Table 1: Output and turbidity 3 rd of May Date: Name: Lalander River Hour Output (l/h) Manual cleaning Yes Turbidity (NTU) 140 Output 3 rd of May Output (l/h) Hours Figure 2: Output on the 3 rd of May
8 On the 4 th of May the raw water contained an initial turbidity of 31 NTU. After filtration, the turbidity was reduced to 0 NTU. The initially output was 690 l/h (Table 2) and this was decreased by 132 l/h after 6 hours of operating. Table 2: Output and turbidity (NTU) 4 th of May Date: Name: Lalander River Hour Output (l/h) Manual cleaning Turbidity (NTU) Yes Output 4 th of May Output (l/h) Hours Figure 3: Output on the 4 th of May
9 On the 5 th and 6 th of May the initial turbidity of the raw water was 176 NTU, and the total amount of hours measured were 10 hours. The output decreased from 654 l/h to 438 l/h, while the turbidity ranged from 176 to 47 NTU. Table 3: Output (l/h) and Turbidity 5 th and 6 th of May Date: Name: Gulbagh river Hour Output (l/h) Manual cleaning Turbidity (NTU) Yes 64 Output and Turbidity, 5-6 th of May Output (l/h) Hours Turbidity (NTU) Output Turbidity Figure 4: Output (l/h) and turbidity (NTU) on the 5 th and 6 th of May.
10 On the 9 th and 10 th of May the turbidity ranged from 331 to 80 NTU (Table 4). The output was at its highest at hour zero, of 654 l/h, and had its lowest flow after 10 hours of filtration, 360 l/h. A backwash was performed during the 10 th and 11 th hour, which resulted in an increase in output. Table 4: Output (l/h) and Turbidity 9 th and 10 th of May Date: Name: Output Hour (l/h) Gulbagh river Manual cleaning Turbidity (NTU) Yes Yes 80
11 Output and Turbidity, 9 th - 10 th of May Output (l/h) Hours Turbidity (NTU) Output Turbidity Figure 6: 5: Output (l/h) and turbidity (NTU) on the 9 th and 10 th of May. The output was reduced from 540 l/h to 468 l/h on the 11 th and 12 th of May. There was conducted a backwash during the 5 th and 6 th hour of filtration that increased the output to 552 l/h. The turbidity ranged from 98 to 15 NTU.
12 Table 5: Output (l/h) and Turbidity 11 th and 12 th of May Date: Name: Hour Output (l/h) Mixed Gulbagh river and borehole water Manual cleaning Turbidity (NTU) Yes Yes 15 Output and Turbidity, 11 th - 12 th of May Output (l/h) Hours 100 Turbidity (NTU) Output Turbidity Figure 6: Output (l/h) and turbidity (NTU) on the 11 th and 12 th of May.
13 The microbiological tests showed positive for Coliform bacteria (Faecal coliform) and E.coli in the raw water. Samples taken directly from the filter (named After filtration) tested negative for Total coliforms (Faecal coliforms) and E.coli. However, water sampled from the fresh water tank (named Freshwater tank) tested positive for Total coliforms (Faecal Coliforms) on the 6 th of May. After chlorination of the tank on the 9 th of May, the sample was negative. Table 6: Showing Microbiological tests in form of Total coliforms and E.coli. Sample code Date Before filtration / after filtration / freshwater tank Before filtration *Water quality tested in the Veterinary laboratory, Kabul. ** Estimated number Volume filtrated (ml) No. of colonies E.coli No. of colonies Total Coliforms (faecal coliforms) After filtration Before filtration After filtration Freshwater tank Before Filtration Freshwater tank Before filtration (+- 10)** After filtration * Before filtration 100 Positive Positive 165* After filtration 100 Negative Negative
14 Total Suspended solids (TSS) Sample 164 (Raw water): Turbidity: 138 NTU Weight filter: 76.2 mg Weigh filter+ residue: 81.8 mg Calculation for TSS: x 10 = 56.0 mg/l 1 L 56 mg 13 h of filtration Average flow 497 l /h on the 9 th and 10 th of May 56 x 497 x = 361 g Estimations suggest that after 13 hours of filtrating water with a turbidity 138 NTU the amount suspended solids in the filter is 361 g. Sample 165 (Filtrated water): Turbidity: 0 NTU Weight filter: 75.5 mg Weigh filter+ residue: 77.0 mg Calculation for TSS: x 10 = 15.0 mg/l
15 Discussion The results show that the output ranges from 360 l/h to 690 l/h depending on the turbidity of the water. The output decreased with an increase in turbidity and out the operating period when not backwashing. A turbidity of 31 NTU showed a decrease in output of 96 and 132 l after 3 and 6 hours of filtration. The average hourly decline was 22 l/h after 6 hours of operating with a turbidity of 31 NTU. Raw-water with the turbidity of 176 and 331 NTU slowed the filtration rate by 108 and 122 litres respectively after 3 hours, and 138 l and 198 l after 6 hours of filtration. With the initial turbidity of 93 NTU the output decreased by 42 l after 3 hours of operating and 72 l after 5 hours of operating. On the 5 th and 6 th of May the turbidity ranged from 47 to 176 NTU where the highest output was during the start-up hour, of 654 l/h. After 10 hour of operating, the output decreased to 438 l/h, resulting in an hourly average decrease of 21.5 l/h. On the 9 th and 10 th of May the turbidity ranged from 80 to 331 NTU having the highest output at the start up hour, 654 l/h. The output decreased to 360 l/h after 10 hours of filtration, resulting in an hourly average decrease of 29.5 l/h. Performing an backwash during the 11 th hour resulted in an increase in output to 582 l/h. The turbidity ranged from 15 to 98 NTU on the 11 th and 12 th of May having the highest outputs in the start-up hour and hour 6, 540 l/h and 552 l/h respectively. The output was decreased by 72 l/h after 6 hours of operating. A backwash conducted between the 6 th and 7 th hour increased the output to 84l l/h. During the 7 th and 12 th hour the output decreased by 54 l, resulting in an hourly average decrease of 7.7 l/h. The raw-water tested positive for both total coliforms (faecal coliforms) and E.coli. Samples taken directly from the filter showed negative values, which indicates that the filter removes all bacteria as indicated. One sampled tested positive for total coliforms (faecal coliforms) in the fresh water tank, which indicates that the water can be contaminated after leaving the filter. After chlorination of the freshwater tank, the test was negative. The turbidity levels in the raw-water decreased due to settling in the tanker truck. The manual cleaning was easily preformed, however some leakages was observed from the cleaning handles during performance.
16 Conclusion The results reveal that the output ranges from 360 l/h to 690 l/h having a stable pressure of 2.5 m. In this experiment, the output depended on the turbidity of the water and the frequency of backwashing. However, it is assumed that a change in pressure will also have an effect on output. The raw water had a turbidity that ranged between 31 to 331 NTU, which contained both Total coliforms (faecal coliforms) and E.coli. Tests showed that the output had a turbidity of 0 NTU, and was free from bacterial contamination. However, one sample tested positive for total coliforms in the fresh water tank. The set-up, manual cleaning and chlorination of the unit was quick and easily performed. The use and maintenance of the filter is assumed suitable for local peoples to perform, independent on level of education. However, proper guidance and training of the people is required. This membrane filter is as a good fit in areas where people fetch drinking water from surface water containing high turbidity and bacterial contaminations. The membrane provides a water free from both particles and bacteria, while it also provides a satisfactory output.
17 References 1. UNICEF (2011) Afghanistan Country Office. WASH. November FACTSHEET. Available at: _November_2011.pdf 2. Khaama Press (2013). Available at: Accessed Mintpress news (2014). Available at: Accessed Habib, H. (2014). WATER RELATED PROBLEMS IN AFGHANISTAN.International Journal of Educational Studies, 1(3), Kamal, G. M. (2004). River basins and Watersheds of Afghanistan.Afghanistan Information Management Services, Kabul. 6. Qureshi, A. S. (2002). Water resources management in Afghanistan: The issues and options (Vol. 49). IWMI. 7. Arnell, Nigel. Hydrology and global environmental change. Pearson Education, WHO (2011) Guidelines for Drinking-water Quality. 4 th ed. Available at: (Accessed ) 9. EPA, United States Environmental Protection Agency (2011) Available at: (Accessed ) 10. WHO (2004) Chemical safety for drinking-water: assessing prioritites for risk management. Draft for review and comments. Available at: Department of Civil and Environmental Engineering, the Turbidity Tube: Simple and Accurate Measurement of Turbidity in the Field, Available at: Koch Membrane system (2013) Available at: Koch-Membrane-Sys.aspx 13. Skyjuice Foundation (2013). Available at: (Accessed )


 Picture 4:")

18 Pictures Picture 1: Skyhydrant Picture 2: Chlorination of freshwater tank Picture 3: Colonies of total coliforms in the raw water (left and directly from filter (right) Picture 4: Filtrated water in the centre of the picture and raw water samples gathered around


19 Picture 6: High team effort assembling the tanks Picture 5: Measurement of output Picture 8: Water sampling Picture 7: Raw water inside tanker truck


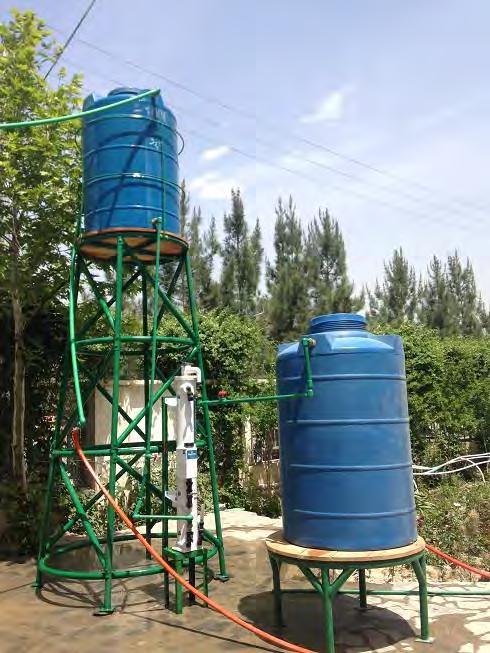
20 Picture 12: Overview Skyhydrant Picture 11: Overview Skyhydrant Picture 9: Overview Skyhydrant Picture 10: Overview Skyhydrant