Introduction to the Science of Climate Change
|
|
|
- Louisa Gregory
- 5 years ago
- Views:
Transcription
, Dhaka Introduction to the Science of")
")
1 Workshop on HEALTH AND CLIMATE CHANGE held at Institute of Epidemiology, Disease Control & Research (IEDCR), Dhaka Introduction to the Science of Climate Change Dr. A.K.M. Saiful Islam Professor Institute of Water and Flood Management (IWFM) Bangladesh University of Engineering and Technology (BUET)
2 Outline Global Warming and Green house effect Climate Change Predictions Potential Impact of Climate Change Responsibility? Climate Change Negotiations & Paris Agreement
3 Understanding climate change at Global, Regional and Local Scale
4
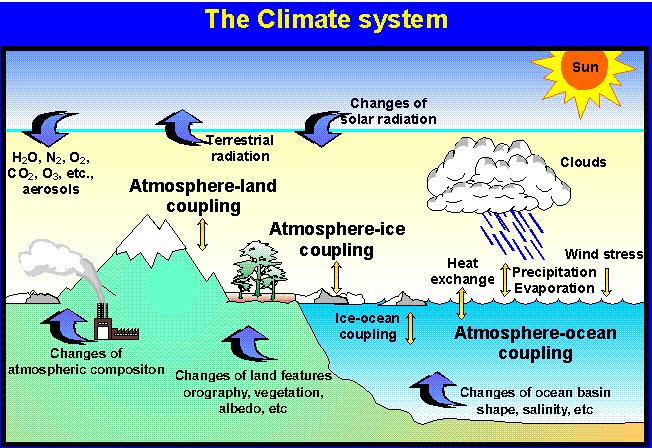
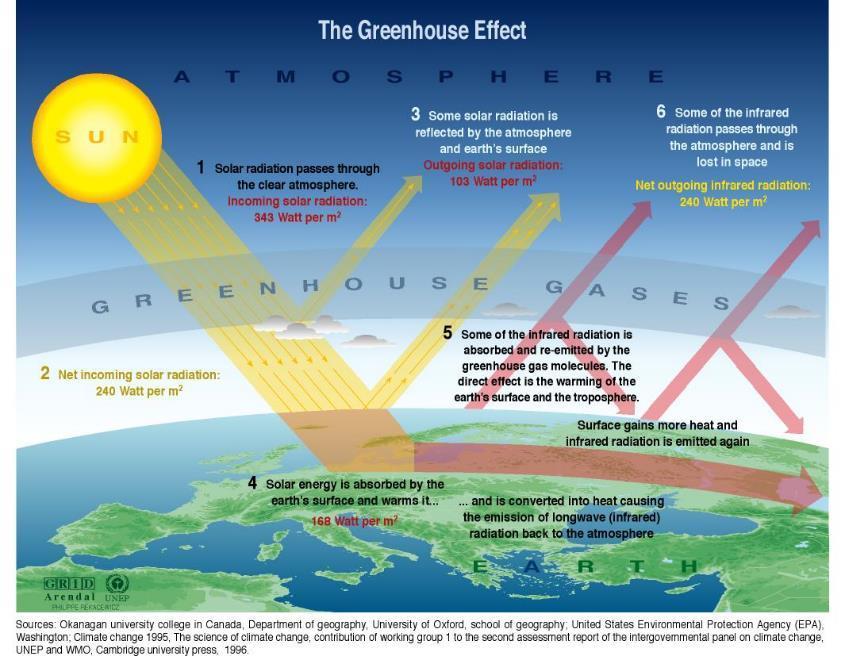
5 Green house gases CO 2 and some other minor gases 1. Absorb some of the thermal radiation leaving the surface of the earth. 2. Emit radiation from much higher and colder levels out to space. These radiatively active gases are known as greenhouse gases. They act as a partial blanket for the thermal radiation from the surface which enables it to be substantially warmer than it would otherwise be, analogous to the effect of a greenhouse.
 acted as a partial")

6 Climate Change, Global Warming and Green House Effect Co2 and some minor radioactively active gases are (known as greenhouse gases) acted as a partial blanket for the thermal radiation from the surface which enables it to be substantially warmer than it would otherwise be, analogous to the effect of a greenhouse
7
8 Increasing trends of CO2
9 Human induced changes of green house gases
 is located at an altitude of 3400")
10 CO 2 from the measuring station at Mauna Loa (Hawaii) is located at an altitude of 3400 meters

11 Global temperature and Greenhouse gases

12 Temperature variation past 1,000 years

13 Increase of Temperature past 140 year

14 Trends of increase of Temperature

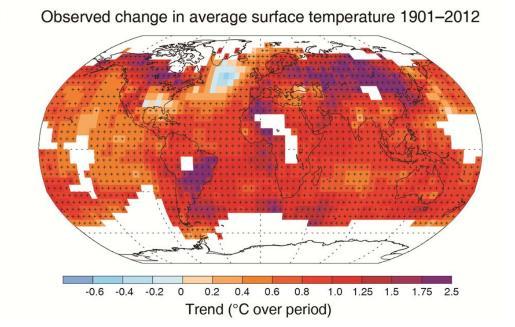
15 Surface Air temperature ( )

16 Trends of Seal Surface temperature

17 Changes of Sea Surface Temperature
 and 2003 (right).")
18 Ice melting Images from gathered from the Defense Meteorological Satellite Program of NASA show the minimum Arctic sea ice concentration 1979 (left) and 2003 (right)

19 Cracks in Ice bars

20 Sea Level Rise ( )
21 Trends of Precipitations
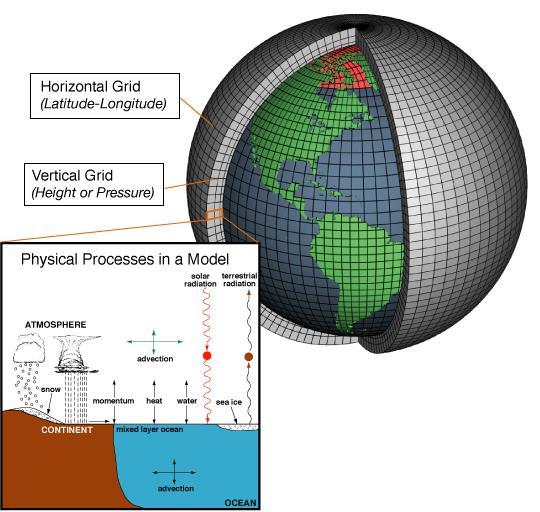
22 Predictions by Climate Models Climate models are computer-based simulations that use mathematical formulas to re-create the chemical and physical processes that drive Earth s climate. To run a model, scientists divide the planet into a 3- dimensional grid, apply the basic equations, and evaluate the results. Atmospheric models calculate winds, heat transfer, radiation, relative humidity, and surface hydrology within each grid and evaluate interactions with neighboring points. Climate models use quantitative methods to simulate the interactions of the atmosphere, oceans, land surface, and ice.
23

24 GCM typical horizontal resolution of between 250 and 600 km, 10 to 20 vertical layers in the atmosphere and sometimes as many as 30 layers in the oceans.

25 Projected Annual Green House Gas Emission
26 Future Projection of Green House Gas

27 Global Average Surface warming

28 Projected Change in Average Annual Temperature


29 Near Term projections of global mean temperature

30 Predicted Arctic sea Ice Results from community climate system models Arctic Sea Ice in 2000 Arctic Sea Ice in 2040

31 Prediction of Sea level rise

32 Changes of Average Precipitation
33 Impacts of climate change Human Health impacts Ecosystem Impacts Agriculture Impacts Water Resources Impacts Market Impacts
34 Possible Climate Change Impact for Bangladesh Increase of intensity and duration of natural disasters such as floods, Cyclones and Storm Surges. Increase of moisture stress (droughts) due to erratic precipitation Salinity intrusion due to Sea Level Rise Inundation due to sea level rise leading towards Climate Refugees Effect on health and livelihood of coastal people. Effect on Bio-diversity, Ecology & Sundarbans. Hampered Food Security & Social Security.
35 Possible Climate Change Impact for Bangladesh Increase of intensity and duration of natural disasters such as floods, Cyclones and Storm Surges. Increase of moisture stress (droughts) due to erratic precipitation Salinity intrusion due to Sea Level Rise Inundation due to sea level rise leading towards Climate Refugees Effect on health and livelihood of coastal people. Effect on Bio-diversity, Ecology & Sundarbans. Hampered Food Security & Social Security.
 Bangladesh (rate 1.03 0 C /century) 26 25 24 y = 0.0103x + 25.428 R 2 = 0.")
36 Observed changes climate of Bangladesh Mean daily temperature of Bangladesh has increased with a rate of C per century during BMD stations 27 (c) Bangladesh (rate C /century) y = x R 2 = Dhaka (rate C /century)
37 Minimum temperature during December Both maximum and minimum temperature has been increased during December which pose adverse impact on clod loving crops.


38 Decadal Changes of Annual Rainfall Trend of Daily Rainfall is increasing as a rate of mm per century. Rainfall greater than 95 th Percentile exhibits an increasing trend

39 Changes of Consecutive Dry Days Consecutive Dry Day is also found increasing. Winter becomes more dry which will impact crop production.
40 Number of rainy days when rainfall is more than 100mm R100 is decreasing whereas total rainfall is increasing. Short duration high intensity rainfall is increasing in Bangladesh.

41 Changes of the extreme meteorological drought over the last 40 years Frequency of extreme drought increased in the north western part of Bangladesh. Changes of Extreme Droughts calculated based on 3-month SPI during Rabi season for two 20 years period (during and )


42 Regional Climate Modeling (RCM) for Bangladesh over CORDEX: South Asia GCM provides output more than 150km resolution which is not enough to capture mesoscale processes. RCM daily output with horizontal resolution 50km are available for South Asia CORDEX domain. Predictions are considered for extreme emission scenarios, RCP 8.5
 Increasing trend ranging between 3.77 C to 5.77 C under RCP 8.")
43 Temperature Anomaly (ᵒC) relative to for Bangladesh (RCP8.5) Increasing trend ranging between 3.77 C to 5.77 C under RCP 8.5 scenario over Bangladesh.


44 Mean temperature of Bangladesh will rise 2 0 C latest by 2040 and 4 0 C by

45 Temperature Anomaly ( C) relative to for 2020s, 2050s and 2080s Highest increase of temperature in February during 2080s ranging between 3.6 C and 9.8 C. July, August and September temperature increase ranging between 0.7 and 4 C.
 ranging between 125mm 615mm.")
46 Change of Precipitation in the 2020s, 2050s and 2080s from Highest increase in rainfall to be occurred during the pre-monsoon period (i.e. March, April and May) ranging between 125mm 615mm.
47 Inter-seasonal changes of rainfall from CMIP5 models over CORDEX domain Pre-monsoon and Monsoon rain increasing Winter rain decreasing


48 Spatial distribution of temperature anomaly (ᵒC) for 2020s, 2050s and 2080s In general there is an indication of warmer Bangladesh with notable increase of temperature over Bangladesh for the 2080s. Temperature will increase from north to south and they range between 0.36 C and 4.61 C.


49 Percent change of precipitation for 2020s, 2050s and 2080s relative to Significant increase of rainfall up to 12% over north east and south east region of Bangladesh is evident. Also highest increase of rainfall up to 20.39% over the Eastern hilly region of Bangladesh is prominent.

50 Changes of extremes A clear shift of Rx1 has been observed from the 2020s time period. Annual Rx1 will increase up to 30 days per year in the 21st Century. Rx50 will drastically increase over the hilly region than flatter part of the country. an increasing shift in mean probability at 2050s and 2080s time period. It means extremity of temperature would become more prominent from the mid to end of the 21st Century. From distribution of minimum temperature, TNn shows a reduction of its extremity in future years.

51 Spatial patterns of extremes Heavy rainfall (Rx50) show a significant increase over the hilly regions of the county in all three time slices. Increase of heavy rainfall events eventually extend the risk of flash flooding in an alarming level. Interestingly, temperature extremity will also increase over the same regions. The vulnerability of water borne diseases can increase in future years.
, India (33.6%), Bangladesh (8.1%) and Bhutan (7.8%) (Gain et al. 2013). Average discharge of the Brahmaputra is approximately 20,000 m 3 /s.")
52 Water Resources Impact Assessment: SWAT Modeling for the Brahmaputra basin The Brahmaputra is a major transboundary river which drains an area of around 530,000 km 2 and crosses four different countries: China (50.5% of total catchment area), India (33.6%), Bangladesh (8.1%) and Bhutan (7.8%) (Gain et al. 2013). Average discharge of the Brahmaputra is approximately 20,000 m 3 /s. The climate of the basin is monsoon driven with a distinct wet season from June to September, which accounts for 60 70% of the annual rainfall (Immerzeel, 2008).
53 Uncertainty in the Changes of Future Flow increasing tendency of the discharge of Brahmaputra River at Bahadurabad station during monsoon when flood usually occurs, while some other models show a decreasing tendency towards the end of the 21 st century. During the pre-monsoon period (MAM), some of the models show significant increases of the discharge peaks, while most of the models show that the peak during this season will remain relatively unchanged.
 hydrodynamic (and transport) simulation")

54 Coastal modeling using Delft3D &FVCOM DELFT3D- FLOW is a multi-dimensional (2D or 3D) hydrodynamic (and transport) simulation program which calculates unsteady flow and transport phenomena that result from tidal and meteorological forcing on a rectilinear or a curvilinear, boundary fitted grid.


55 Complex Error(cm) Tidal Validation: Complex Error of tidal constituents Hiron Point FES2012: 40 cm DELFT3D: 17.5 cm Cox's Bazar Char Changa FES2012: 54.5 cm DELFT3D: 44.8 cm M2 S2 K1 O1 total Harmonic Constituents FES2012 FES2014 DELFT3D
 Inundation area will be increased")
56 Inundation map for 1.0m and 1.5m Sea Level Rise (SLR) Inundation area will be increased under SLR 1.0m SLR 1.5m SLR 0.5m 1.0m
57 Changes of Inundation area due SLR SLR Inundated Area(sq.km) Percent of total Bangladesh Percent of Coastal Zone Affected population 0.5m ,00,000 1m ,00, m ,00,000 1m (No Polder) ,00,000


58 Inundation statistics for the Sundarbans SLR (m) Inundated Area (km 2 ) % of inundation Area

59 Impact of Crop Yield on climate change Yield of Boro rice will be reduced while T.Aman rice will be increased 30 Boro Rice 4 T. Aman Rice s 2050s 2080s s 2050s 2080s Rajbari Chapai Nawabganj Satkhira Sunamganj Rajbari Chapai Nawabganj Satkhira Sunamganj Crop modeling has been conducted using DSSAT model
60 Responsibility?

61 Global Emission 2005

62 Global Emission

63 Per capita CO 2 emission

64 Per capita emission

65 Bangladesh ton ton
66 Conference of Parties from Copenhagen to Paris Six years, six cities and six COPs later after Copenhagen And why it looks likey that we will achieve a new robust and durable climate change agreement under The Convention. COP15 in COPENHAGEN: the Parties failed to agree on a new protocol text which was meant to replace the KP after the first commitment period. But Parties agreed to take note of The Copenhagen Accord and extended the mandates of the negotiations until COP16/CMP6 in COP16 in CANCUN: In The Cancun Agreement the Parties recognized for the first time the need for deep cuts in global emissions in order to limit the global average temperature rise to 2 C above pre-industrial levels and established a wide range of institutions like the GCF (Green Climate Fund). COP17 in DURBAN: The Durban Outcome covered a second commitment period under the KP ( ); Parties launched the ADP (Ad-hoc Durban Platform) to develop a protocol, another legal instrument or an agreed outcome with legal force under the Convention applicable to all Parties. The ADP is scheduled to complete these negotiations by 2015, with the new instrument entering into force in 2020.
67 Why all the COPs since Copenhagen were targeting to achieve a robust and durable new climate agreement for the world at the end of COP18 in DOHA: the Doha Climate Gateway ensured the second commitment period of the KP while terminating the AWG-KP. This self bonding decision is now forcing Parties to come to an agreement in COP19 in WARSAW: Parties decided to invite all parties to bring forward their intended nationally determined contributions (INDCs). COP20 in LIMA: Negotiations focused on outcomes under the ADP to advance toward an agreement at COP21 in Paris in Parties elaborated on the INDC process and asked to bring forward INDCs as early as possible in Parties also discussed the elements of a draft negotiating text. Additionally Parties adopted the Lima Call for Climate Action which includes the negotiations toward the 2015 agreement, the process for submitting and reviewing INDCs, and addresses enhancing pre-2020 ambitions of the Parties.
68 COP 21: Paris Agreement New agreement applicable to all Parties that will put the world on track to achieve the below 2 C objective. Agreement should address in balanced manner mitigation, adaptation, means of implementation and transparency, to be finalized in Paris December 2015 and to be implemented from Commitment of developed countries: mobilise jointly US$ 100 billion/year by 2020 from various sources for mitigation and adaptation in developing countries from various.
69 Approx. 25 % of 2014 GHG emissions are from the G7 nations Approx. 25 % of 2014 GHG emissions are from China Approx. 25 % of 2014 GHG emissions are from the rest of the G20 nations except G7 and China Approx. 25 % of 2014 GHG emissions are from the rest of the world except G20

70 Questions?