Irrigation Scheduling in Orchards. Terry Prichard CE Water Management Specialist UC Davis Dept LAWR
|
|
|
- Gwendoline Dawson
- 5 years ago
- Views:
Transcription
1 Irrigation Scheduling in Orchards Terry Prichard CE Water Management Specialist UC Davis Dept LAWR
2 Irrigation Scheduling When to apply irrigation water How Much to apply
3 When and How Much? Different crops Different orchard development stage Different stage of growth Presence of an orchard vegetative cover Climate Irrigation system
4 Orchard water use Determined by: Climate Stage of Growth (Canopy size) Presence of ground cover

5 Climate Evapotranspiration ETo

6 ca.gov
7
8 Stn Id Station Date Precip (in) CIMIS ETo (in) PPT Eto 70 Manteca 7/1/ Manteca 7/2/ Manteca 7/3/ Manteca 7/4/ Manteca 7/5/ Manteca 7/6/ Manteca 7/7/ Manteca 7/8/ Manteca 7/9/ Manteca 7/10/ Manteca 7/11/ Manteca 7/12/ Manteca 7/13/ Manteca 7/14/ Manteca 7/15/ Manteca 7/16/ Manteca 7/17/ Manteca 7/18/ Manteca 7/19/ Manteca 7/20/ Manteca 7/21/ Manteca 7/22/ Manteca 7/23/ Manteca 7/24/ Manteca 7/25/ Manteca 7/26/ Manteca 7/27/ Manteca 7/28/ Manteca 7/29/ Manteca 7/30/ Manteca 7/31/
9 ETo = Kc x ETo Where: ETc = crop evapotranspiration Kc = crop coefficient ETo = evapotranspiration of the reference crop (station Information)
10 Canopy Coverage Mature -- more than 62% Shading Use established crop coefficients Less than 62% Shading Use a 2:1 ratio 20% shade = 40% use of mature orchard

11 Cover increases water use by 25-30%
12
13
14
15 Kc Peach Almond Walnut Pistachio period Mar Apr Apr May May June June July July Aug Aug Sept Sept Oct Oct Nov
16 Date Irrigation scheduling using ETo values based on a 20-year average Manteca, CIMIS Station 70 Leaf out: 3/15 Leaf drop: 11/15 Walnut No cover crop Evapotranspiration Reference ET o Crop Coefficient k c Water Use (inches) ET c Cumulative Inches ET c Mar Apr Apr May May Jun Jun Jul Jul Aug Aug Sep Sep Oct Oct Nov


17 Water Use / Losses Evapotranspiration Transpiration Evaporation Runoff Non Uniformity Deep percolation

18 Irrigation Management Sprinkler

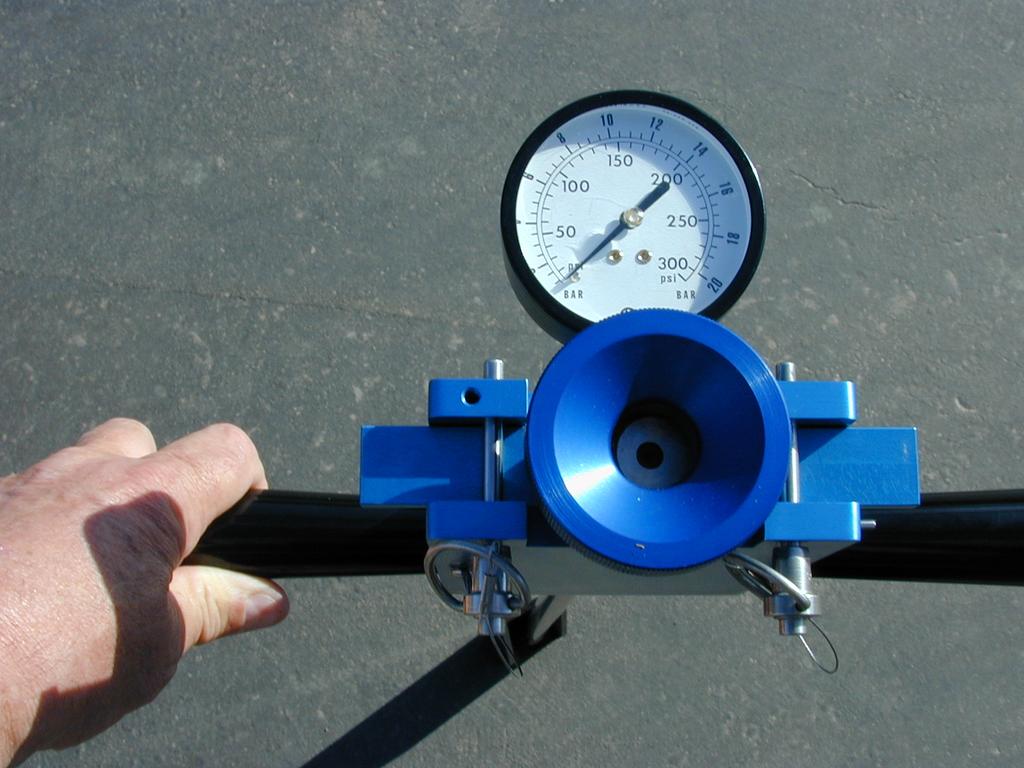
19 Pressurized systems Engineered Distribution Uniformity Not perfect Sprinkler Micro irrigation

20 Evaluate and upgrade irrigation systems improve distribution uniformity Sprinkler Pressure variation Nozzle size uniformity Micro Irrigation Pressure Regulation Emitter Clogging
21 Irrigation 1. Determine Net Irrigation Requirement 2. Determine Application Rate Determine Average application rate Uniformity of applied water 3. Measure Applied Water
22 Evaluate (Measure) Irrigation System Average Application rate Distribution uniformity
23 Quantifying Irrigation System Performance Distribution Uniformity (DU 1/4) An indication of how evenly the water is distributed across the system DU = Average of the low quarter of volume measurements Average of all volume measurements X % well designed and maintained system
24 ETo x Kc = ET / DU = Gross Irrigation Sta 21 no cover Biweekly Biweekly Period Kettelman Kc Net irr Gross Date ETo (in.) 1/1-1/ /16-1/ /1-2/ /16-2/ /1-3/ /16-3/ /1-4/ /16-4/ /1-5/ /16/5/ /1-6/ /16-6/ /1-7/ /16-7/ /1-8/ /16-8/ /1-9/ /16-9/ /1-10/ /16-10/ /1-11/ /16-11/ /1-12/ /16-12/ Distribution Uniformity 85% DU Low Quarter


25 Applying the Correct Amount Water meter
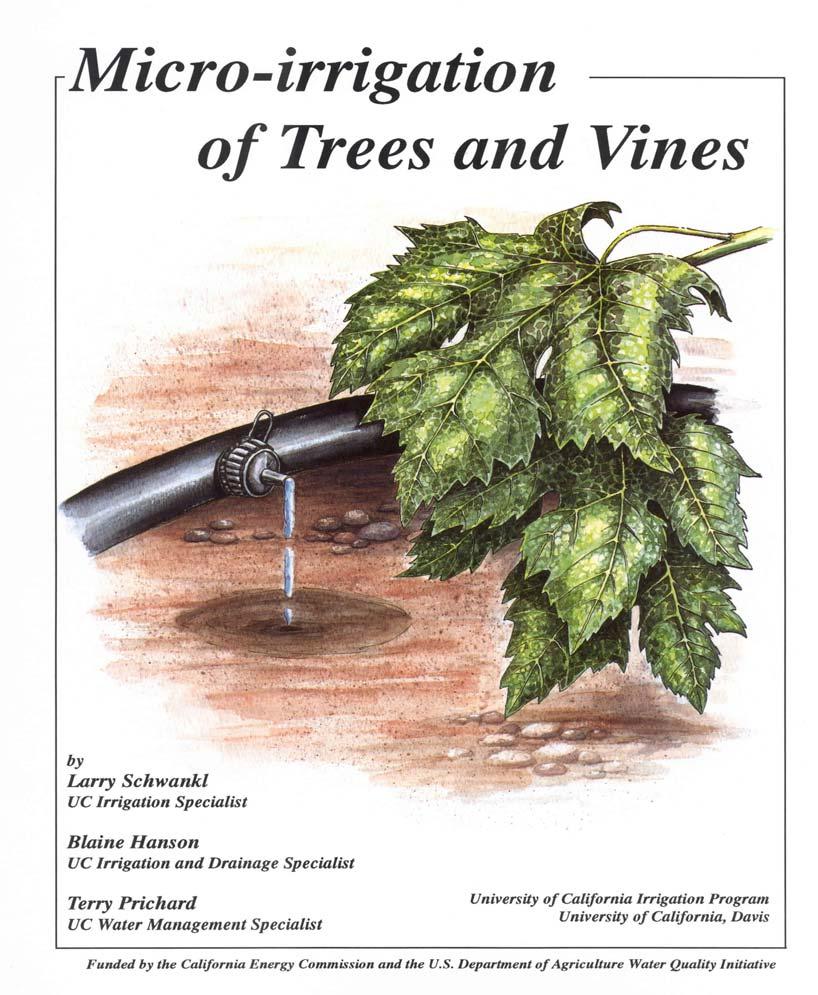
26 Measuring Micro Irrigation Discharge Rate
27 Soil Based Irrigation Scheduling Devices that measure moisture Status Content

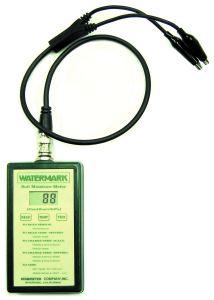
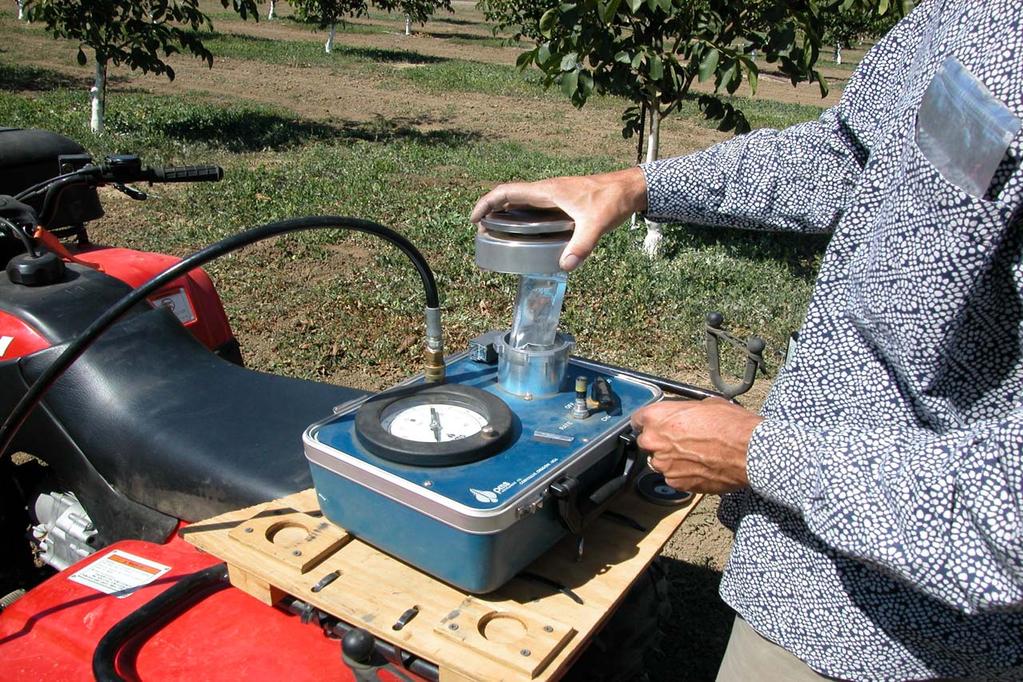
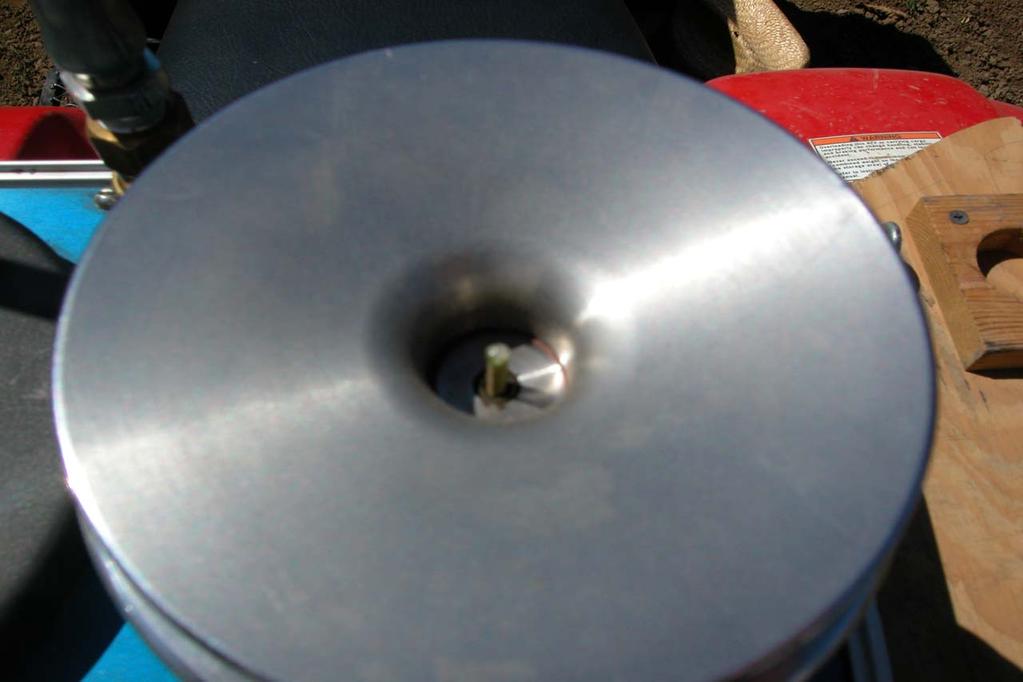
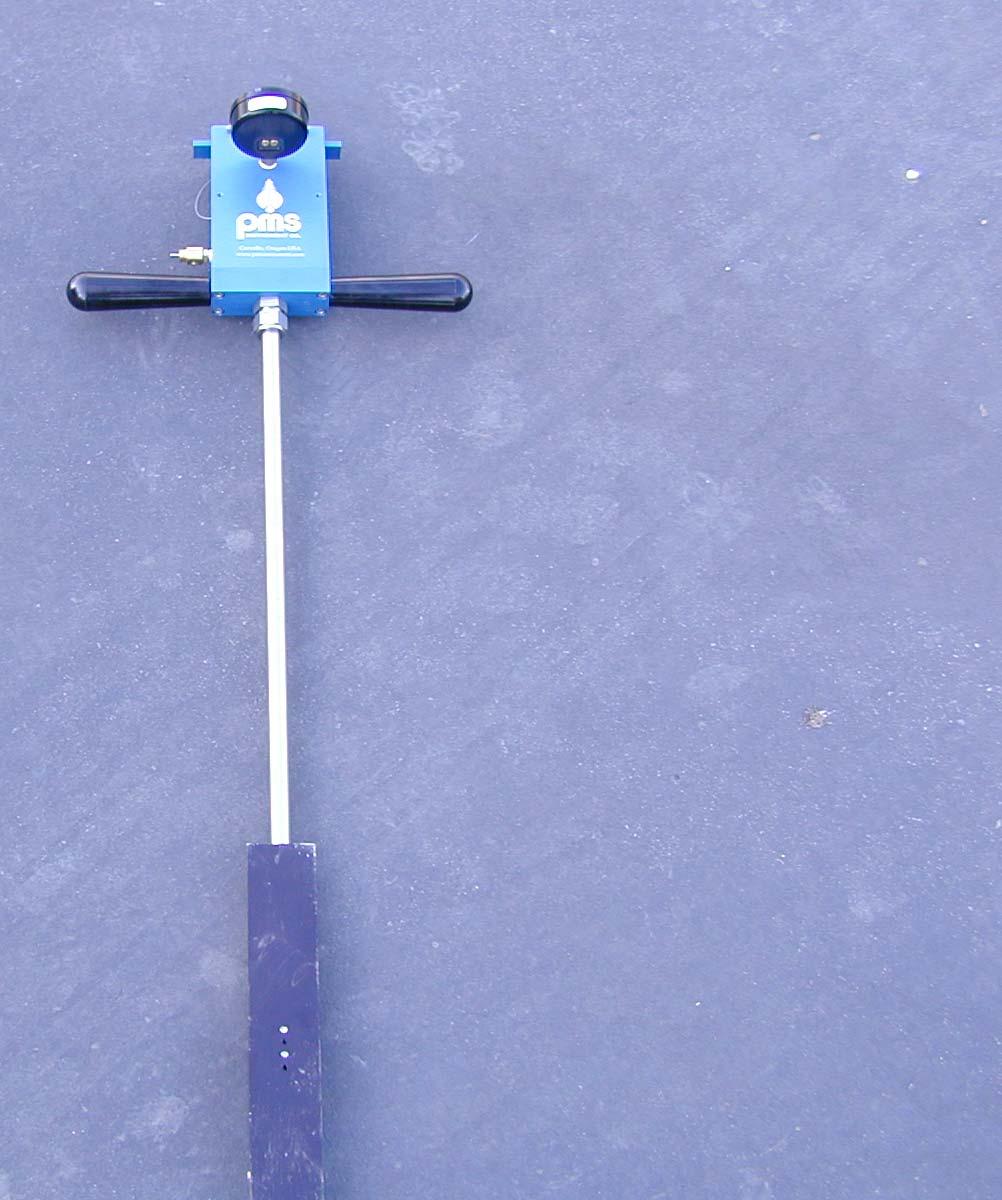
28 WaterMark Sensor


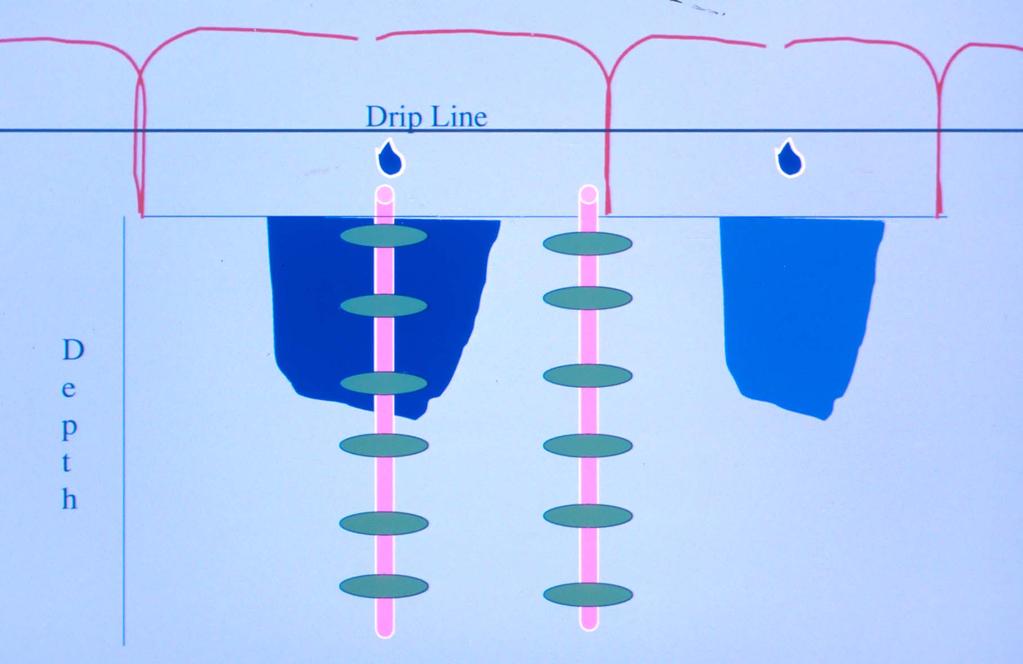
29 Solar Panel Cable Data Logger Ground Surface Electrode Electrode Access Tube Permanent/logging Multi depth Portable Single point measure
30 Capacitance Probe
31 Moisture C-Probe 12in 24 in 36 in 48 in 60 in Irr = 1.4 in 6/13 6/20 6/27 7/4 7/11
32 C-Probe in 24 in 36 in 48 in 60 in Sum Irr = 1.4 in Moisture /13 6/20 6/27 7/4 7/11
33
34 Plant Based Irrigation Scheduling Stem Water Potential
35 Plant Based Tree Water Status Use midday stem water potential to assure that you are not over or under- irrigating
36
37
38
39
40 Walnut Stem Water Potential 0 to 2.0 Not commonly observed -2.0 to to to Fully irrigated,, low stress, commonly observed when orchards are irrigated according to estimates of real time evapotranspiration (ETc( ETc), long term root and tree health may be a concern 6.0 Low to mild stress,, high rate of shoot growth visible, suggested level from leaf-out until mid June when nut sizing is completed 8.0 Mild to moderate stress,, shoot declines especially with Black Walnut Rootstock. These levels do not appear to affect kernel development
41 Walnut Stem Water Potential -8.0 to to to Moderate to high stress, shoot growth in non-bearing trees may stop, nut sizing may be reduced in bearing trees 12.0 High stress, temporary wilting of leaves has been observed. New shoot growth may be sparse or absent and some defoliation may be evident. Nut size likely to be reduced Relative high levels of stress, to 18.0 Severe defoliation moderate to severe defoliation, should be avoided
42
43 Web Site URL: Click on: Educational Materials