Releases by Stable Isotope Analysis. Alan Jeffrey, Ph.D. National Environmental Monitoring Conference August, 2012
|
|
|
- Thomasina Johnson
- 5 years ago
- Views:
Transcription


1 Distinguishing Chlorinated Solvent Releases by Stable Isotope Analysis Alan Jeffrey, Ph.D. National Environmental Monitoring Conference August, 2012


2 Chlorinated Solvents PCE dry cleaning solvent TCE vapor degreasing solvent TCA degreasing solvent Dissolve in groundwater; migrate easily Vapors intrude into overlying buildings
3 Chlorinated Solvent Issues Is PCE or TCE in a single plume from one source or from multiple sources? Is PCE or TCE in multiple plumes from the same source or from different sources? Is TCE in a PCE plume from degradation of the PCE or from a separate TCE source?
4 Chlorinated Solvent Characterization PCE, TCE etc are single compounds petroleum products are a mixture of HCs Different sources are chemically identical May be isotopic differences 13 C/ 12 C, Cl/ 35 Cl, D/H ratios differ depending on feedstock and manufacturing process
5 Compound Specific Isotope Analysis Volatiles isolated from groundwater and soil on a Solid Phase Micro Extraction (SPME) fibre Volatiles desorbed in inlet of GC/Isotope Ratio Mass Spectrometer Isotope ratios measured as, 37 Cl, and D in parts per mil ( o / oo ) referenced to standards (0 o / oo )
6 GC/IRMS Instrument Schematic
7 Case 1: Undegraded PCE in Multiple l Aquifers Upper and lower aquifers have PCE contamination Traces of TCE & cdce - little apparent degradation Multiple sources in upper aquifer? Diff t i d l Different sources in upper and lower aquifer?
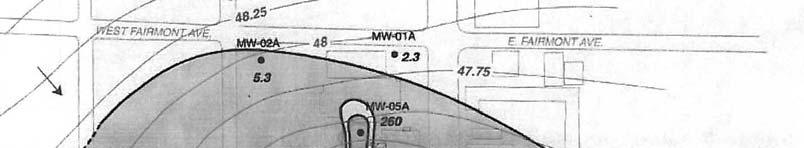
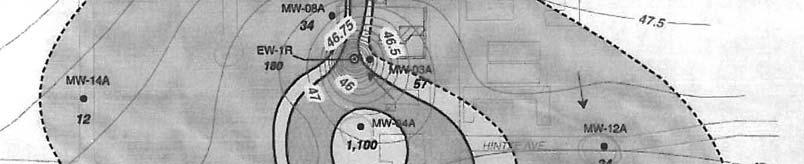
8 PCE Concentrations in Upper Aquifer ug/l 260 1,
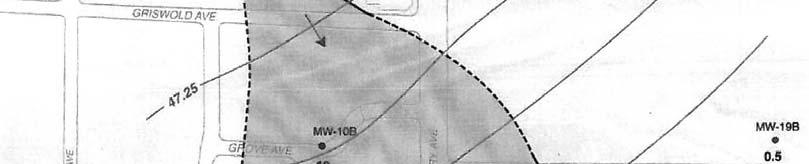
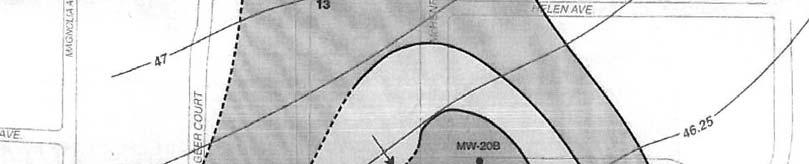
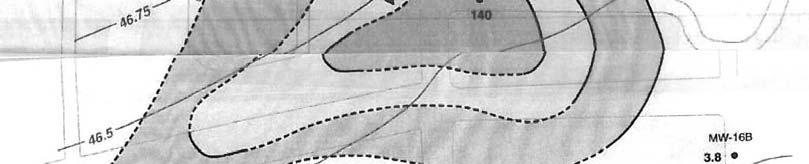
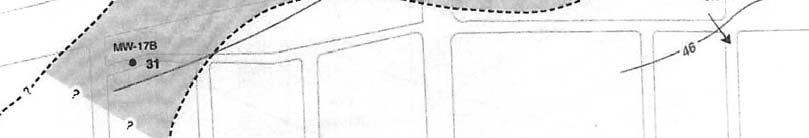
9 PCE Concentrations in Lower Aquifer ug/l 140
10 PCE Isotope Ratios in Upper Aquifer 37 Cl
11 PCE Isotope Ratios in Lower Aquifer 37 Cl
12 PCE in Multiple Aquifers 37 Cl
13 PCE in Multiple Aquifers Upper Lower
14 Conclusions Some differences in carbon and chlorine isotopes in upper aquifer Possibly different sources Significant differences between upper and lower aquifers in the same well Definitely different sources


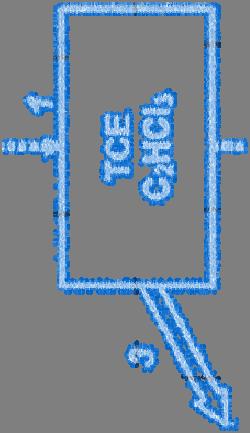

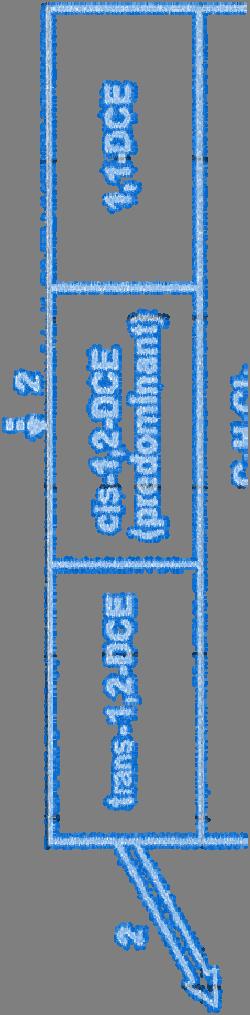

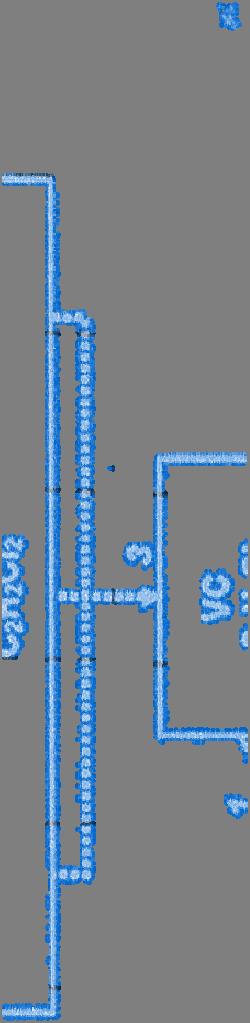


15 PCE and TCE Degradation As PCE or TCE degrades, isotopic i ratio changes
16 PCE Degradation 12 C X Bonds are weaker than 13 C X Bonds In a chemical reaction, 12 C X Bonds break faster than 13 C X Bonds If reaction proceeds to completion all PCE goes to TCE - isotope ratio in product is the same as in starting material If reaction is partially completed, 12 C is concentrated in product, and 13 C is concentrated in starting material Product (TCE) becomes lighter (more negative); Starting material (PCE) becomes heavier (less negative)
17 Isotope Ratio Reconstruction If isotope ratios and concentrations of daughter products are known, isotope ratio of initial PCE can be calculated Initial PCE = PCE moles x + TCE moles x + DCE moles x PCE + TCE + DCE moles Assuming no loss of PCE, TCE, DCE or other daughter products from the system
18 Case 2: Degraded PCE and TCE in Multiple l Plumes Separate plumes with PCE, TCE, and cdce marked differences in degradation d within plumes No vinyl chloride - little apparent loss of chlorinated solvents in the system Multiple TCE sources in the plumes? TCE in PCE plume from migration from TCE plumes?
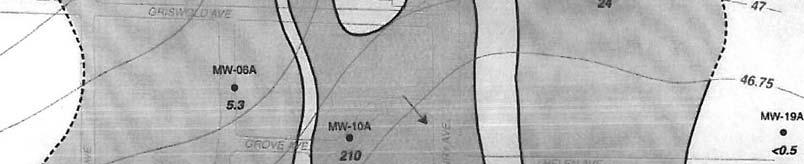
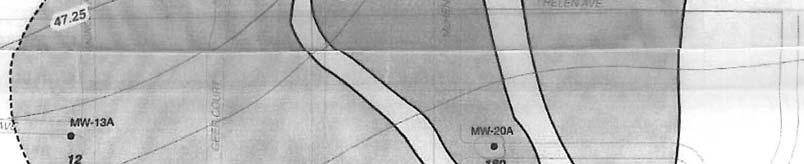
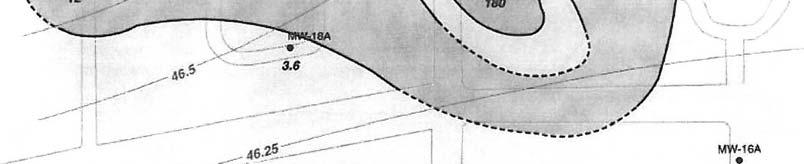
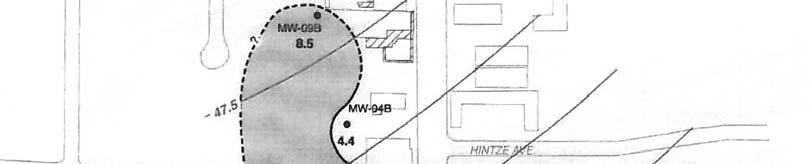
19 Plume Concentrations ND PCE concentration ug/l TCE concentration ug/l DCE concentration ug/l
20 TCE Carbon Isotope Ratios ND TCE Carbon Isotope Ratio o / oo
21 Carbon isotope ratios in Main Plume LSB Current DCE Current TCE % of Chlorinated Solvents
22 Carbon isotope ratios in Main Plume LSB LSB Current DCE Current TCE Initial TCE % of Chlorinated Solvents
23 Carbon isotope ratio in Main Plume MW Current DCE Current TCE % of Chlorinated Solvents
24 Carbon isotope ratio in Main Plume MW MW Current DCE Current TCE Initial TCE % of Chlorinated Solvents
25 Carbon isotope ratios in Main Plume South MW Current DCE Current TCE % Chlorinated Solvents
26 Carbon isotope ratios in Main Plume South MW MW Current DCE Current TCE Initial TCE % of Chlorinated Solvents
27 Carbon isotope ratios in Main Plume South MW-18A Current DCE Current TCE % of Chlorinated Solvents
28 Carbon isotope ratios in Main Plume South MW-18A MW-18A Current DCE Current TCE Initial TCE % of Chlorinated Solvents
29 TCE Carbon Isotope Ratios ND TCE Carbon Isotope Ratio o / oo
30 Carbon isotope ratios in East Plume MW Current DCE Current TCE % of Chlorinated Solvents
31 Carbon isotope ratios in East Plume MW MW Current DCE Current TCE Initial TCE % of Chlorinated Solvents
32 Carbon isotope ratios in East Plume LSB Current DCE Current TCE % of Chlorinated Solvents
33 Carbon isotope ratios in East Plume LSB LSB Current DCE Current TCE Initial TCE % of Chlorinated Solvents
34 Carbon isotope ratios in Main Plume and East Plume Main Plume LSB-1 MW-18A MW-3 MW-8 East Plume MW-15 LSB Current DCE Current TCE Initial TCE % of Chlorinated Solvents
35 Carbon isotope ratios in West Plume GF-H Current DCE Current TCE Current PCE % of Chlorinated Solvents
36 Carbon isotope ratios in West Plume GF-H GF-H Current DCE Current TCE Initial PCE Current PCE % of Chlorinated Solvents
37 Carbon isotope ratios in West Plume GF-H08 and GF-H GF-H Current DCE Current TCE Initial PCE Current PCE % of Chlorinated Solvents
38 Carbon isotope ratios in West Plume GF-H08 and GF-H GF-H08 GF-H Current DCE Current TCE Initial PCE Current PCE % of Chlorinated Solvents
39 Conclusions Isotope ratio reconstruction shows at least three chlorinated solvent releases: TCE in Main Plume Different TCE in East Plume PCE in West Plume with no contribution from TCE plumes