The Greening of Energy. Eskom s role in the Renewables Industry in South Africa
|
|
|
- Curtis Logan
- 5 years ago
- Views:
Transcription


1 The Greening of Energy Eskom s role in the Renewables Industry in South Africa

2 Contents 1 Background and Eskom at a glance 2 Eskom s strategy and aspirations on Renewables 3 Eskom s role in the current IPP process 4 Next key milestones 2
3 Key Messages Eskom is committed to move to a lower emitting and lower water use energy mix and to improve energy efficiency in its own operations and those of its customers and stakeholders. Eskom is clear that that it cannot meet the future electricity demand needs of the country on its own and welcomes the involvement of the private sector to support it in meeting the future needs of South Africa. The solutions to meet the future needs must look at regional options (Central and Southern Africa), distributed generation closer to the customers, ensure that the tariff trajectory is affordable and support the aspirations of Government policy on job creation and local supplier development. Important decisions on the implementation of the Integrated Resource Plan have to be made to continue the momentum of the current renewable energy IPP procurement programme and Eskom s new build programme. 3


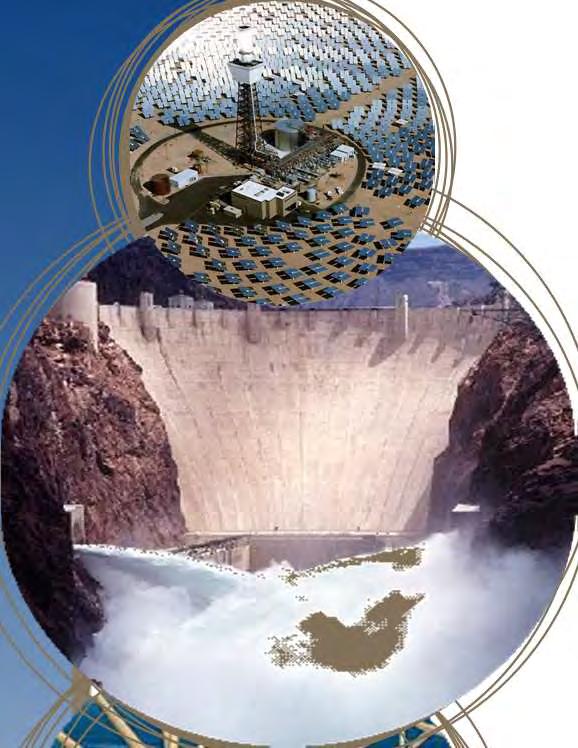
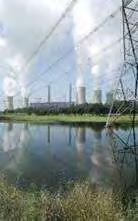
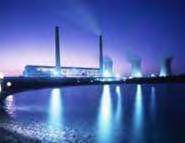
4 Energy Production in South Africa 0.1%0.5% 5.7% 1.2% Coal fired Gas turbine Hydroelectric Nuclear 92.5% Pumped Storage South Africa heavily relies on coal, followed by Nuclear 4
5 Eskom at a glance Type Number Nominal capacity Utility and country Total electricity produced (TWh) 237 Coal-fired 13 stations MW Electricity generation mix: Gas/liquid fuel turbine Hydroelectric Pumped storage 4 stations 6 stations 2 stations 2 426MW 661MW 1 400MW Coal-fired power stations (%) 92.8 Renewables (%) 0.8 Pumped storage and other (%) 1.2 Gas (%) 0.1 Nuclear (%) 5.1 Environmental performance Nuclear 1 station 1 910MW Water usage [L/kWh SO] CO 2 [kg/kwh SO] Wind energy 1 station 3MW TOTAL 27 stations MW Particulate emissions [g/kwh SO] SO 2 emissions [g/kwh SO] NO x [g/kwh]
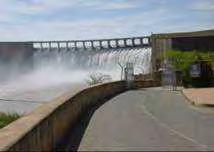
6 Eskom at a glance Station Location Nominal capacity MW Gas/liquid fuel turbine stations (4) Acacia Cape Town 171 Ankerlig Atlantis Gourikwa Mossel Bay 746 Port Rex East London 171 Hydroelectric stations (6) 661 Colley Wobbles Mbashe River 42 First Falls Umtata River 6 Gariep Norvalspont 360 Ncora Ncora River 2 Second Falls Umtata River 11 Vanderkloof Petrusville 240 In support of 6
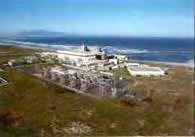
7 Eskom at a glance Station Location Nominal capacity MW Pumped-storage (2) Drakensberg Bergville Palmiet Grabouw 400 Wind energy (1) Klipheuwel Klipheuwel 3 Nuclear (1) Koeberg Melkbosstrand In support of 7
 How do we keep")


8 Strategic Drivers South Africa growth 64% Real GDP 14% Power capacity (~5 000 MW) How do we keep the lights on and move to a cleaner future? The gap between demand and supply requires vast investments in power generation capacity: To meet the demand, Eskom total generating capacity has to increase to MW by

9 Strategic Drivers Total additional new capacity (without committed) until 2030 in GW Policy-Adjusted IRP (Capacity) 15% 23% 6% 6% 9% 42% 6,3 9,6 2,6 2,4 3,9 17,8 8,4 1,0 8,4 Share of total new GW Solar PV CSP Wind IRP 2010 Capacity allocations under policy adjusted scenario, places a strong emphasis on renewable energy in the new capacity allocation The country will be faced with shortages until 2015 with the peak being a 9 TWh shortage in Coal Nuclea r Hydro Gas - CCGT Peak - OCGT Renew -ables 10,1 0,0 0,05 0,0 1,0 1,0 35,5 1,8 2,1 0,0 2,4 0,0 in 2010 Energy share in 2030 Σ = 260 TWh Σ = 454 TWh 90% 5% 5% 0% < 0,1% 0% 65% 20% 5% 1% < 0,1% 9% Source IRP
10 IRP 2010 was developed to meet several key government objectives including lower carbon emissions Integrated Resource Plan Is a living plan, which will be updated on an on-going basis to reflect the changing needs of South Africa and respond to changes in our economic, social and technological environment. This is the first IRP that government directed and it seeks to find a balance between competing government objectives: Affordability Reducing carbon emissions (Towards a Green Economy) Water conservation Localization and, Regional development 10
11 IRP reduces carbon intensity by ~34% while coal and nuclear is still the backbone of the energy supply Power supply sources Energy mix Capacity installed EoY in GW 1 Electric energy supplied in TWh p.a PV CSP Wind Hydro Nuclear PV CSP Wind Hydro Nuclear CCGT/OCGT Renewable TWh's in 2030 (14%) Carbon free TWh's in 2030 (34%) 50 OCGT CCGT Coal 20 Coal CO 2 intensity 912 g/kwh 600 g/kwh -34% 11
12 Contents 1 Background and Eskom at a glance 2 Eskom s strategy and aspirations on Renewables 3 Eskom s role in the current IPP process 4 Next key milestones 12


13 Eskom is fully supportive of renewable energy generation in South Africa Developing renewable energy in South Africa is important Reduce CO 2 -emissions Mitigate climate change Diversify energy sources Government has taken several important steps to drive renewables deployment Large portion of IRP allocated to renewables Renewable Energy Purchase programme introduced South Africa has abundant resources (especially for solar) Average solar radiation of about 2,300 kwh/m 2 /year Large areas in the cape with average wind speeds of more than 6 m/s Eskom facilitates the deployment of renewable energy and the ramp up of a renewable energy industry in South Africa 13


14 Very high solar irradiation in South Africa excellent for Solar Technologies Solar irradiation in South Africa as compared to Germany, where residential grid parity will be reached soon Yearly total of global irradiation on horizontal surface Average for Germany Average for South Africa SOURCE: Joint Research Center of the European Commission; PVGIS; BCG analysis 14


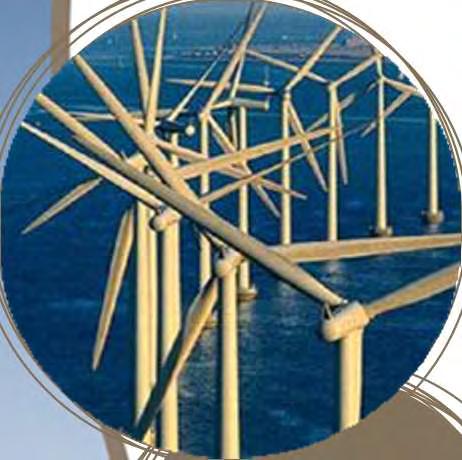
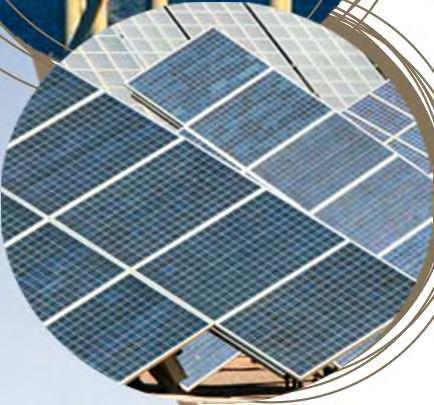
15 We aim to contribute to a cleaner, more sustainable energy future for South Africa Addressing climate change requires addressing both supply and demand factors in the energy sector Reduce carbon intensity of energy supply One key lever is to increase the share of renewable energy and nuclear in the overall energy mix Concentrated Photovoltaic Solar Power Reduce demand through more efficient energy use Eskom is also driving a number of demand side management initiatives Solar water heaters Often 30-40% of electricity is used for water heating, which can be saved with solar water heaters Wind Energy efficiency program Industrial demand side management Installation of energy efficient equipment e.g. compact fluorescent lights bulbs. Energy auditing & optimizations for industrial clients 15

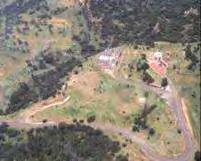
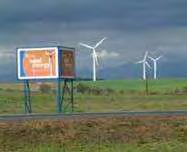
16 Eskom has a long history with renewable energy 16


17 While awaiting for an IRP allocation from DoE, is already delivering first projects for the country Eskom Sere Wind Farm PV at Eskom sites CSP demo plant Description 100 MW Wind farm being constructed in Western Cape region ~50 turbines of 2 MW each Scheduled completion in 2013 Description Installation of photovoltaic systems at Eskom sites Initial installation of one hectare per site at two sites adding 1 MWp of capacity in 2011 Description World s largest 100 MWe Concentrating Solar Power plant with molten salt for energy storage is being developed for construction near Upington. Summary Wind is recognised as the most proven renewables technology worldwide ~220,000t CO2 saved per year based on 0.9t CO2 /MWh Summary PV is zero emissions technology PV does not require water during the power production cycle PV is a well-established, safe technology PV can be installed quickly at plant site Summary Plant required to investigate CSP technology in South Africa Vital to Eskom s carbon footprint reduction/ low carbon growth strategy Eskom is currently discussing its role regarding developing, operating and maintaining renewables assets, driving local industry development and developing local skills with the key relevant players. 17

18 Contents 1 South Africa's electricity industry & Eskom at a glance 2 Eskom s Strategy and Aspiration on Renewables 3 Eskom s role in the current IPP process 4 Next milestones

19 Eskom s role 19
20 Eskom plays a significant role for renewable energy IPPs in South Africa Process undergone by all IPPs Renewable IPP Allocation of renewable energy capacity PPAs Grid connections Who leads Eskom s role DoE No role played no influence DoE Make information concerning current and future grid capacity publically available System operator provides information of grid capacity and stability to DoE to assess the impact of renewable energy on grid stability Eskom Buyer s Office Eskom signs PPAs for all capacity allocated and make payment to IPPs, recovering costs through tariffs Eskom does not influence or have access to the process of PPA allocation within the country. The role-playing entities are ring-fenced from each other Eskom Transmission/ Distribution (excludes municipal connections) Eskom Transmission and Distribution ensure equitable and fair access to the grid In order to assist in service delivery, Eskom set up a Grid Access Unit for generators 20
21 Eskom process, related to grid connection and the role of the Grid Access Unit Consultation with, and advising IPPs on grid connection Quotation, contracting and connection of generators Operation of IPPs and generators Eskom Grid Access Unit for generators role Manage and facilitate the service relationship with IPPs Facilitate grid access for generators Submit questions for clarification or enquiries on grid connection to the network owner (Eskom or the municipality) Eskom grid access process on or


22 Contents 1 Background and Eskom at a glance 2 Eskom s strategy & aspirations on Renewables 3 Eskom s role in current IPP process 4 Next key milestones 22

23 What are the next key milestones? 23
24 Please partner with us Embrace energy saving as a national culture, joining the global journey towards a sustainable future 49M campaign aims to create a culture of energy efficiency in SA Remember the three Ps: save power, save your pocket and save our planet. If you re not using it, switch it off! 24

25 THANK YOU 25 25