Korea s Renewable Energy Policy - An Update -
|
|
|
- Cameron Foster
- 5 years ago
- Views:
Transcription


1 Korea s Renewable Energy Policy - An Update - Dr. Chang Hoon Lee Korea Environment Institute

2 Contents 1 2 Renewable Energy Use Policy Framework - RPS 3 New Issues 4 Perspectives 2
3 Renewable Energy Use Renewable Energy Supply (share in TPES) Share of RE Share of RE excl. WasteE Share of RE excl. WasteE, Hydro & Fuel Cell 3.18% 3.52% 4.08% 4.12% 2.06% 2.08% 2.13% 2.24% 2.37% 2.43% 2.50% 2.60% 2.74% 1.64% 1.24% 1.40% 1.36% 1.20% 1.02% 0.89% 0.65% 0.76% 0.58% 0.07% 0.09% 0.51% 0.54% 0.55% 0.54% 0.63% 0.70% 0.84% 0.06% 0.08% 0.08% 0.08% 0.11% 0.16% 0.21% 0.26% 0.37% 0.44% 0.52% '01 '02 '03 '04 '05 '06 '07 '08 '09 '10 '11 '12 '13 '14 '15 Source: MOTIE(2015), The Economic Consequences of Outdoor Air Pollution Definition of Korea s New & Renewable Energy : RE(IEA) + Waste Energy (mostly industrial waste gas) + Large Hydro + Fuel Cell 3
4 Renewable Energy Use Renewable Energy Supply 12,000.0 E n 10,000.0 e r g y ( 1, T O E ) 8, , , ,000.0 Ocean GeoThermal Fuel Cell Solar Thermal Wind PV Bio Hydro Waste Energy 0.0 '01 '02 '03 '04 '05 '06 '07 '08 '09 '10 '11 '12 '13 '14 4
5 Renewable Energy Use Renewable Electricity Share of RE Share of RE excl. WasteE Share of RE excl. WasteE, Hydro & Fuel Cell 4.92% 3.46% 3.66% 3.95% 2.30% 1.56% 1.82% 1.33% 1.08% 1.02% 1.03% 1.00% 1.07% 1.24% 1.42% 1.62% 1.46% 0.04% 0.07% 0.01% 0.03% 0.04% 0.06% 0.08% 0.11% 0.18% 0.27% 0.39% 0.42% 0.66% 0.93% 0.47% '01 '02 '03 '04 '05 '06 '07 '08 '09 '10 '11 '12 '13 '14 * No data for electricity generation from waste energy before
6 Renewable Energy Use Renewable Electricity 30,000 g e n e r a t i o n ( G W h ) P o w e r 25,000 20,000 15,000 10,000 5,000 Ocean Waste E Fuel Cell Wind PV Bio Hydro 0 '01 '02 '03 '04 '05 '06 '07 '08 '09 '10 '11 '12 '13 '14 6
7 Renewable Energy Use Main Drivers of Recent Development 3,000 2,500 2,000 1,500 1,000 PV Wood Pellet Wind Fuel Cell PV : new installation of 1 GW per year in Wood Pellet (imported) : co-combustion in coal-fired plants 7
8 Renewable Energy Use Capacity target of renewable electricity Category Installed Installed Installed Installed Share(%) Share(%) Share(%) Share(%) Capacity Capacity Capacity Capacity Annual increase PV 2, , , , Wind , , , Bio Hydro 1, , , , Ocean , Waste 2, , , , Fuel cell , , , Coal IGCC Total 9,013 17,867 25,381 39,261 The 4 th New and Renewable Energy Plan (2014) 8

9 Policy Framework - RPS RPS Target Mandatory for power producers with installed capacity over 500MW (18 firms in 2016) RPS Target (%) year target, target, PV Target Target (GWh) Corresponding New capacity (MW) (No extra PV target from 2016) ,235 1, ,156 1,577 1, ,353 1,
10 Policy Framework - RPS REC Weight REC Weight REC Weight Energy sources & Types PV Non PV 1.2 ~100kW 1.0 On general land 100kW~3,000kW 0.7 3,000kW~ 1.5 ~3,000kW On existing buildings 1.0 3,000kW~ 1.5 Floating facilities on the water 1.0 Plants for own use 0.25 IGCC, Waste Gas 0.5 Waste, LFG 1.0 Hydro, onshore wind, bio-energy, RDF, Waste gasification, tidal (with existing embankment) 1.5 Wood biomass, offshore wind (grid connection less than 5 km), water heat 2.0 Fuel cell, Current 2.0 offshore wind (grid connection longer than 5 km), Fixed weight 1.0~2.5 geothermal, tidal (with existing embankment) Variable weight ESS (connected to wind power)
11 Policy Framework - RPS RPS compliance PV 276, ,820 1,390,359 Target(REC) (A) Non-PV 6,144,279 10,161,737 11,515,072 Total 6,420,279 10,896,557 12,905,431 PV 264, ,461 1,332,922 Performed(REC) (B) Non-PV 3,890,047 6,627,400 8,745,429 Total 4,154,227 7,324,861 10,078,351 PV 95.72% 94.90% 95.90% B/A (%) Non-PV 63.31% 65.20% 75.90% Total 64.70% 67.20% 78.10% Penalty for Non-fulfillment : less than150% of the market price, considering the reasons etc. 11
12 Policy Framework - RPS REC Price Spot market 300, , , , ,000 50,000 0 PV(Won/REC) non-pv(won/rec) REC market is unified since Jan
13 Policy Framework - RPS REC Contract Market for PV : Price and Volume 250, , , , , Fall Spring Fall Spring Fall Spring Fall Spring Fall Spring Contract Volume (MW) Average Price (Won/REC) Mandatory for 6 big power producers (with capacity over 5GW) to buy RECs in a bidding system in a 12-year constant price contract : 300MW per year Prefer the small scale PVs : at least 150MW for the capacity less than 100kW 13
14 Policy Framework - RPS PV Revenue (REC price + SMP) 600,000 PV Revenue : REC price + SMP 500, , , , ,000 - SMP Large-scale PV(REC Weight 1.0) Small-scale PV(REC Weight 1.5) SMP(System marginal price) : wholesale electricity price 14
15 Policy Framework - RPS LCOE of PV <Table> LCOE of Small scale PV Category Unit Investment Costs 1,000KRW/kW 2,500 2,365 2,060 1,794 1,562 1,360 Technical lifetime Years Fixed O&M 1,000KRW/kW Load Factor % LCOE KRW/kWh <Table> LCOE of Large Scale PV Category Unit Investment Costs 1,000KRW/kW 2,100 1,981 1,713 1,481 1,280 1,107 Technical lifetime Years Fixed O&M 1,000KRW/kW Load Factor % LCOE KRW/kWh


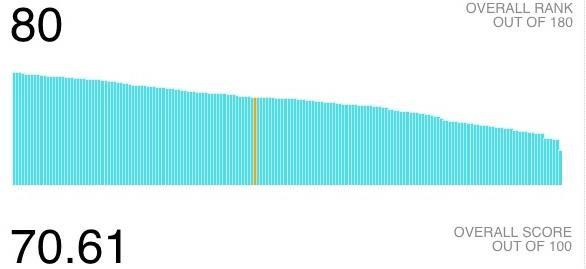
16 New Issues Air Pollution : Environmental Performance Index


17 New Issues Air Pollution : OECD Better Life Index

, The Economic Consequences of Outdoor Air")
18 New Issues Air Pollution : Health Risk Premature deaths from exposure to particulate matter and ozone (Number of deaths caused by outdoor air pollution per year per million people) Source: OECD(2016), The Economic Consequences of Outdoor Air Pollution 18
19 New Issues Air Pollution : Trend reversed Source: S.Kim et. al. (2016) New Measures (2016.6) From diesel to electric or hybrid cars Shut down of old coal-fired power plants 19
20 New Issues Climate Change : INDC Korea s INDC 37% Reduction from the BAU level : (MtCO2eq) 11.7% of 37% by using international market mechanism Source: NRDC(2015), Paris Climate Conference South Korea 20
21 New Issues Climate Change : INDC Greenhouse Gas Emissions in BAU (MtCO2eq) Energy total Energy Industries Manufacturing & Construction Transport Other Sectors Fugitive emissions Industrial Process Agriculture Waste Total CO2 Equivalent Emissions Source: 2013 data from National Greenhouse Gas Inventory Report of Korea 2015, 2030 data (estimated) from Y. Cho(2016) Limited reduction target for industry: 12 % reduction from the BAU level More pressure for the energy sector From Coal to Nuke, LNG, Renewable Energy? 21
22 Iceland Norway Austria New Zealand Canada Portugal Switzerland Denmark Sweden Italy Chile Spain Slovenia Finland Germany Greece Ireland Slovak Republic Turkey Luxembourg United Kingdom Mexico Belgium France Australia Japan Korea(2035) United States Poland Netherlands Estonia Czech Republic Hungary Israel Korea Perspectives How much of Renewable Energy? Higher RPS target for 2018~2020 as a response to PM issues mainly to compensate for earlier shut-down of 10 old coal-fired plants (3GW) year target, target, target, * 2016 target from : MOTIE(2016.7), Measures for New Energy Industry and Improved Regulation. Is it not too low to set 2035 RE target as much as 11% (13.4% of electricity supply)? 100% 80% Share of Renewable Electricity 2014 (OECD Renewables balance) 60% 40% 20% 0% 22
23 Perspectives How : Is the RPS enough? A very weak diffusion of the small-scale facilities - The market mechanism of RPS is too complicated to a private household Installed Capacity of PV in 2014 (kw) 347, , , ,166 3,189 67,135 ~1kW 1~3kW 3~10kW 10~50kW 50~100kW 100~1000kW 1,000kW~ A Re-Introduction of FIT for small scale facilities is in discussion. But in avoiding windfall profit caused by an artificial tariff setting in traditional FIT - Setting the tariff similar to market price of REC & SMP of the last year or the last quarters - Volume-dependent tariff setting analog to German FIT(2014) 23
24 Perspectives Who pays for more Costs of RE? A main reason of switch of FIT to RPS in 2012 : an unclear financing mechanism no automatic transfer mechanism of more production costs of renewable energy to consumer price of electricity (contrary to German and Japanese cases) More costs of RE was paid by the Electricity Industry Fund which is financed and limited by a surcharge(3.7%) of electricity tariff A big concern of the government about the case in that the subsidy for RE is not fully covered by the fund Electricity consumer price is a regulated price in Korea RPS implementation costs of electricity producers are paid by KEPCO, the sole electricity retailer, but the consumer price is not automatically adapted so much, but regulated by Ministry of Strategy & Finance Electricity price stability is a very high priority of the government, not only for private consumers, but also to back up the competitiveness of Korean manufacturing industries Regardless of RPS or FIT, an automatic pricing and transfer mechanism of more costs of renewable energy is indispensable to ensure a more expansion of renewable energy financially to have a demand management effect additionally 24

25 Thank you