Presented by: Andrew Craig DNR Nonpoint Source Planning Coordinator Nov 2016 National NPS Conference Boston, MA
|
|
|
- Hillary Wilson
- 5 years ago
- Views:
Transcription


1 Presented by: Andrew Craig DNR Nonpoint Source Planning Coordinator Nov 2016 National NPS Conference Boston, MA Nonpoint source pollution continues to be the leading source of water quality impairments throughout the United States. Draft Sect. 319 Grant Guidelines November 2012

2 Multiple Wisconsin Planning Efforts with Something in Common NPS Areawide Water Quality Management Plan

3 DNR 9 Key Element Plan Web Page keyword: 9 Key
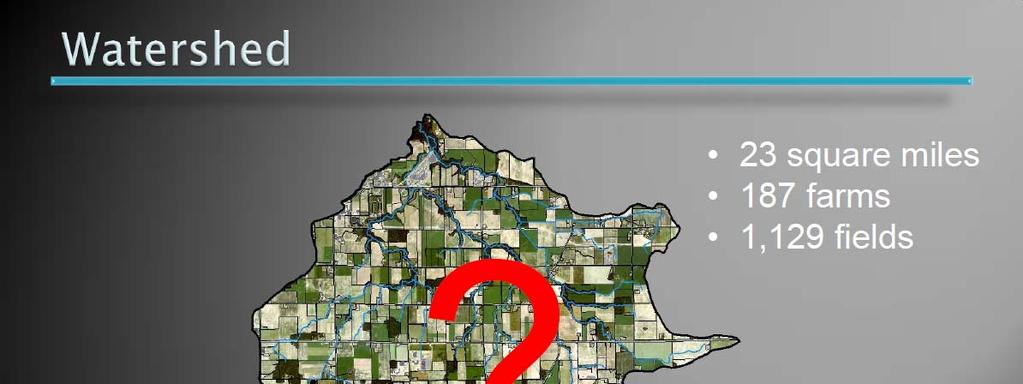
4 Challenges for 9 Element Plans (1) Watershed Size? Large watershed = more inventory, practices, resources, monitoring and longer time for WQ response HUC 10 = 225 square miles 40, ,000 acres Small watershed = less inventory, practices, resources, monitoring and shorter time for WQ response HUC 12 = 35 square miles 10,000 40,000 acres
5 Challenges for 9 Element Plans (1) Watershed Type and Characteristics? River, Stream or Lake? Number, Location and Types of Nonpoint and Point Sources Identify Existing Activities and Plans in Watershed Recent WQ Monitoring Data? Recent Land Use and Crop Rotation Inventory CDL, Transects, NMPs? TMDL Approved or Under Development? Local Interest and Participation Ag Producer Groups, Farmer Led Councils? Federal, State, Local Conservation Programs and Grants? WQBEL limits for point source(s)? County and State Requirements Status and Implementation? County LW plans, Farmland Preservation, NR 151 performance standards
6 Challenges for 9 Element Plans (2) Identify the causes and sources of pollution in watershed that need reduction to meet WQ standards Select significant pollutant sources Estimate number and location of sources and background levels Use Maps and Tables (3) Describe management measures to reduce pollutant sources to meet WQS What practices Identify/map priority area(s) for practices (4) Estimate the load reductions expected from selected management measures Use models or other methods (e.g., literature, surveys, edge of field measurements)
7 Wisconsin Impaired Waters 2014 Phosphorus Sediment Toxics Bacteria

8 Wisconsin Impaired Waters: Phosphorus and Sediment Sources Loss of Uses

9 Adopted 2011 Helpful for watershed selection and establishing watershed plan goals and milestones

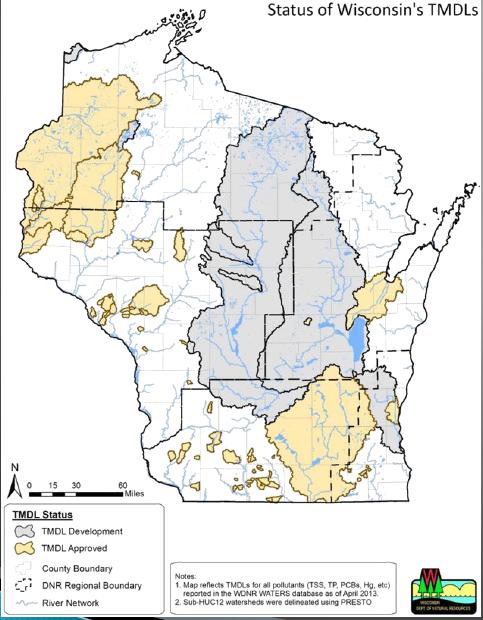
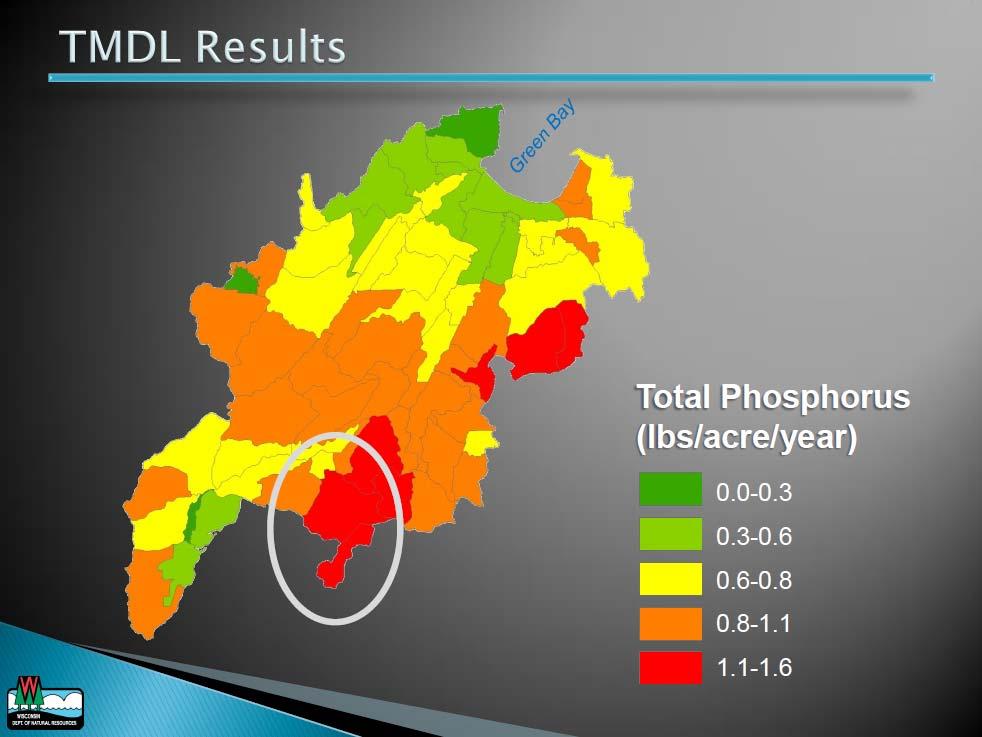
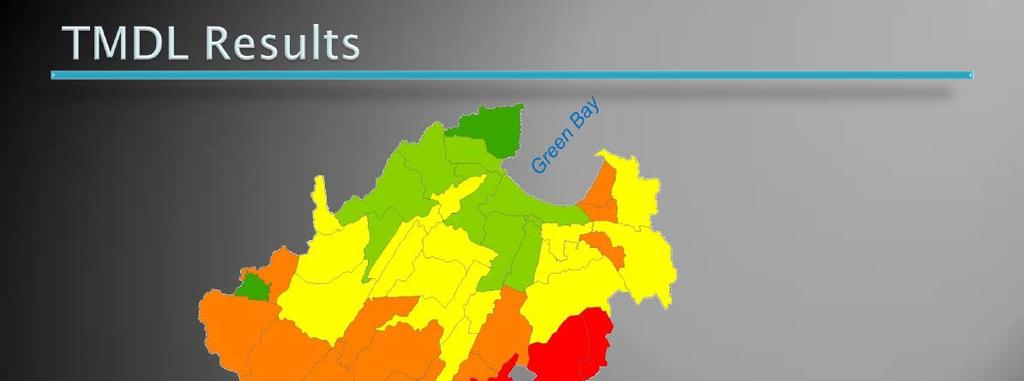
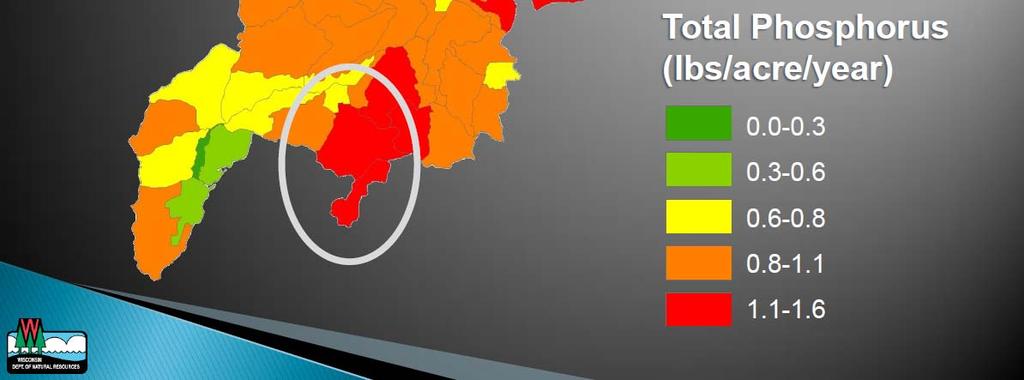
10 2016 Wisconsin TMDLs Approved Tan Areas Under Development Grey Areas Phosphorus + Sediment are Primary Impairments

11 Wisconsin Impaired Waters


12 Pink = Approved TMDL watersheds Cross hatch = 9 Element Plan Green = P or Sediment Impaired Water Purple = Recently Approved 9 Element Plan

13 May 2016 Green /Red = Recently Approved 9 Element Plan Yellow = Expire in 2016 White = Expire in 2019 Green = Impaired Water
14 Solution to 9 Element Plans Use Approved TMDLs TMDL Modeling Outputs and Findings Use TMDLs under development TMDL Model Assumptions related to Watershed Conditions; WQ data to calibrate Use WQ monitoring and assessment data related to TMDLs May help focus watershed plan areas/activities/practices
15
16
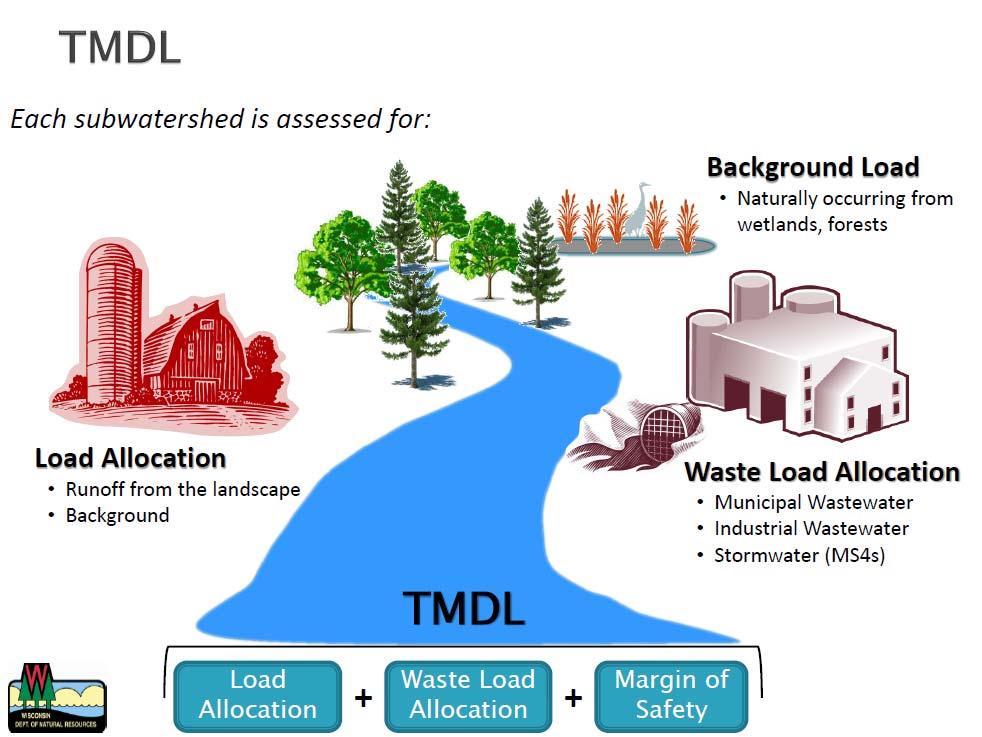
17
18

19 Reduce Pollutant Load Proportionally by Source
20


21 9 Element Watershed Plans DNR Runoff and WQ staff
22 and County Coordination
23
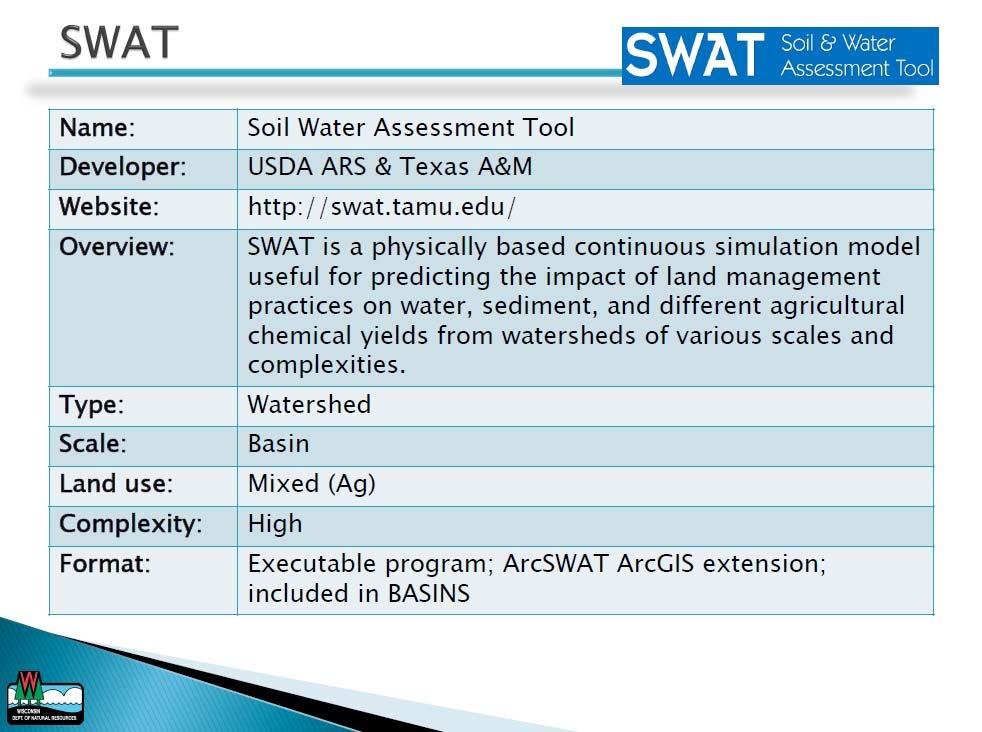
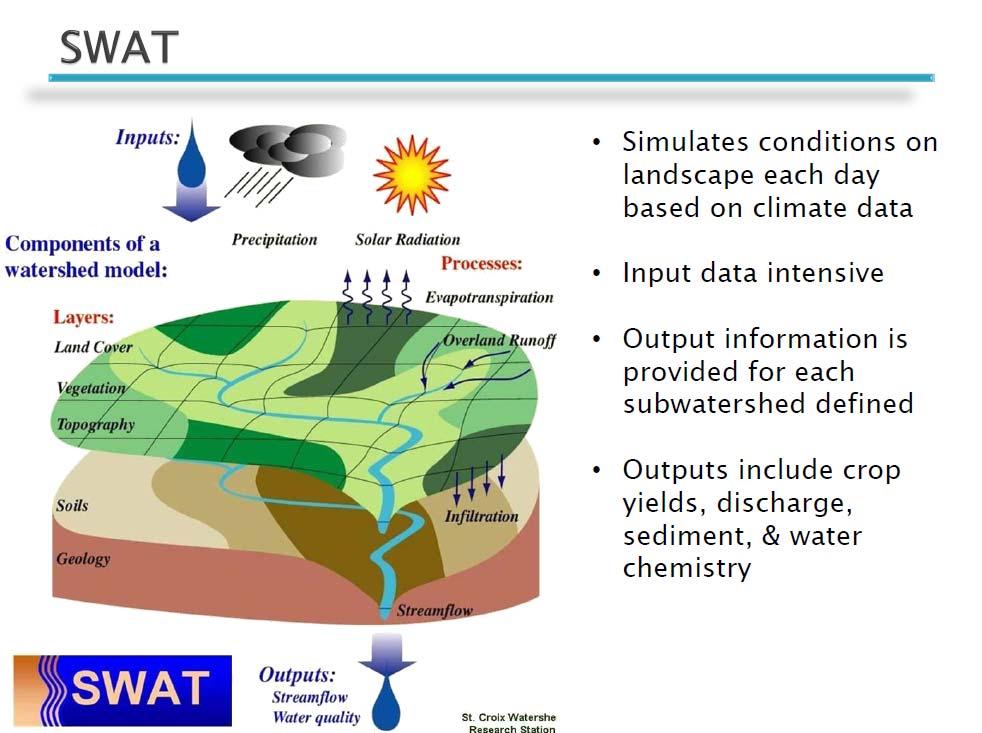
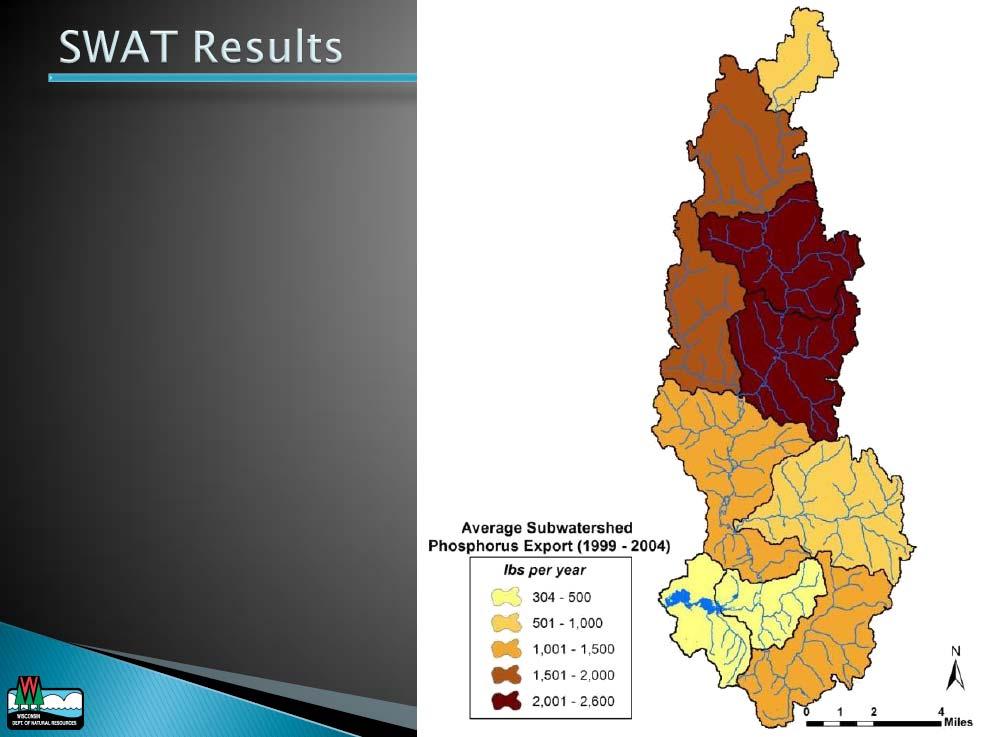
24 Wisconsin TMDL Reaches, Load Allocations and 9 Element Plans TMDL Watershed is divided into sub watersheds (reaches) For each reach, a baseline pollutant load and load reduction target (allocation) is calculated using SWAT model TMDL Load Allocation = pollutant reduction needed to meet WQ standards at reach discharge point Load Allocation expressed as a mass (lbs/year) and also percent reduction from baseline load Within Wisconsin, we use TMDL reaches and the load allocation percent reduction to develop 9 Element Watershed Plans

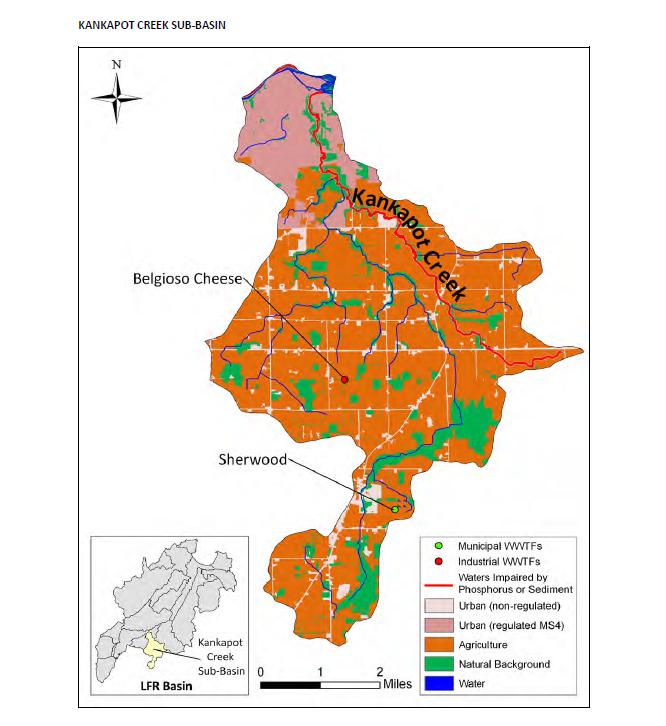
25 TMDL reach used for 9 Element Watershed Plan
26
27


28 TMDL Reach Loading Analysis
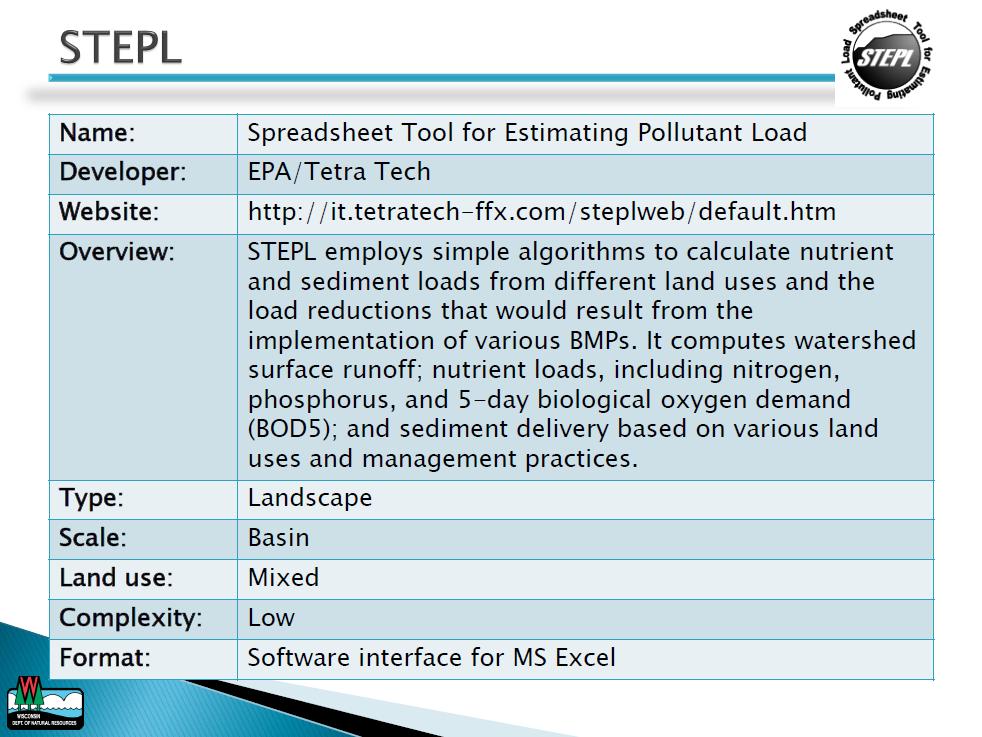
29 Solution for 9 Element Plans Incorporate TMDL findings, Percent Reduction Targets and SWAT variables into 9 Element Plans Problem: Significant effort to complete multiple SWAT analyses to measure load reductions from practices over time Viable Alternative: Use TMDL SWAT assumptions and Percent Reduction targets with models that are watershed or field specific and simpler to use!! STEPL Spreadsheet to Estimate Pollutant Loads EPA SnapPlus Soil Nutrient Application Planner Wisconsin
30
31 in a watershed
32 Use TMDL SWAT model variables or local watershed land use information for these data requirements
33 SnapPlus software or other local information/research can be used for calculating BMP efficiencies for various practices... more on this later

34 (Use TMDL SWAT variables or SnapPlus to define)


35 Modify Soil P Concentration % to reflect watershed location, known soil test values within watershed

36 BMP types and pollutant reduction efficiencies can be revised in STEPL

37 Use TMDL watershed variables or local watershed land use in STEPL to define watershed baseline practices, then apply BMPs to determine % reductions


38 Methods STEPL INPUT SCREEN
39 STEPL INPUT SCREEN 1. BMPs and efficiencies for different pollutants on CROPLAND, ND=No Data Watershed Cropland N P BOD Sediment BMPs % Area BMP Applied W ND Reduced Reduced Tillage Tillage Systems Systems 50 STEPL BMP Calculator BMPs and pollutant reduction efficiencies can be added or revised Landuse BMP & Efficiency N P BOD Sediment Cropland Cropland 0 No BMP Cropland Combined BMPs-Calculated Cropland Contour Farming ND Cropland Cover Crops Cropland Diversion ND 0.35 Cropland Filter strip ND 0.65 Cropland NMP - N and P bal Cropland Reduced Tillage Systems ND 0.75 Cropland Streambank stabilization and fencing ND 0.75 Cropland Terrace ND 0.85
40 STEPL OUTPUT SCREEN 1. Total load by subwatershed(s) Watershed N Load (no BMP) P Load (no BMP) N Reduction P Reduction BOD Load (no BMP) BOD Reduction Sediment Load (no BMP) lb/year lb/year lb/year t/year W N Load P Load BOD (with (with BMP) (with BMP) BMP) Sediment Load (with BMP) lb/year lb/year lb/year t/year Sediment Reduction lb/year lb/year lb/year t/year % % % % Before After Compare STEPL BMP % reduction to TMDL % reduction target

41 How do I capture practice variability in a watershed plan? Use multiple cropland practice combinations in STEPL to determine average pollutant reduction efficiency
42 SnapPlus and 9 Element Plans
43 Solution for 9 Element Plans Incorporate TMDL findings, Percent Reduction Targets and SWAT variables into 9 Element Plans Viable Alternative: Use TMDL SWAT assumptions and Percent Reduction targets with models that are watershed or field specific and simpler to use!! STEPL Spreadsheet to Estimate Pollutant Loads EPA SnapPlus Soil Nutrient Application Planner Wisconsin


44 Conservative Planning Tool GREAT for developing Nutrient Management and 9 Element Watershed Plans!!


45
46 SnapPlus does not account for drain tiles
47
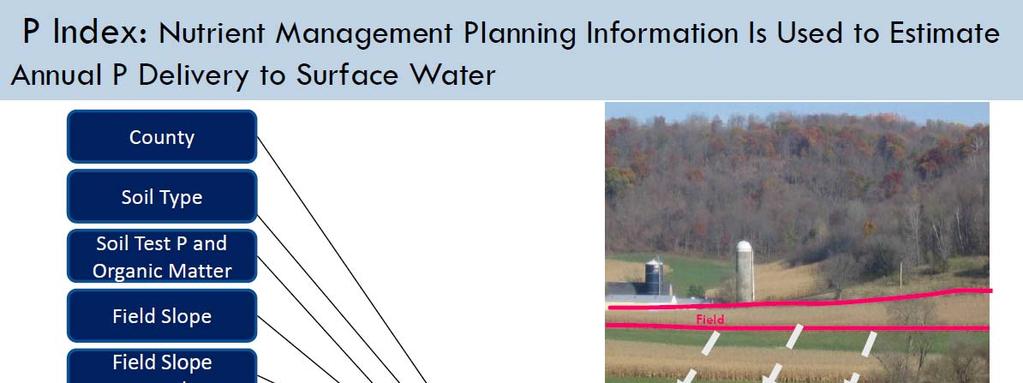
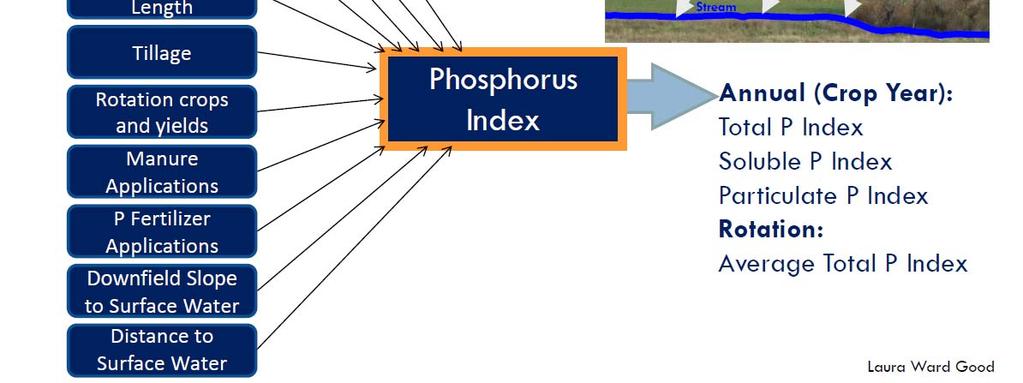
48 Solution for 9 Element Plans We use SnapPlus Soil Nutrient Application Planner to model: Baseline Watershed Conditions Soil and P loss Select dominant soil types, crop rotations, tillage and manure and fertilizer applications and other practices OR Incorporate TMDL SWAT model assumptions to define baseline and compare to specific farm/field management Pollutant Reductions from Cropland Practices Calculate as percent reduction, not mass SNAP mass is not equivalent to SWAT TMDL mass each has different pollutant delivery assumptions Compare to TMDL % reduction target or TMDL SWAT baseline condition Pollutant Reduction Efficiencies Reflect BMP or combination of BMPs performance for specific soils, fields or watershed Transfer into STEPL watershed model Use as stand alone
49 Solution for 9 Element Plans Example: SnapPlus + TMDL % Reduction TMDL Reach/Watershed shows a 58% reduction in TP is required to meet WQ standards at reach outlet. The watershed land use is predominantly dairy farms and associated crop rotation. SnapPlus shows the current dairy rotation in watershed results in rotational P Index of 5 lbs/ac/year. If additional practices (reduced tillage, cover crops after corn silage) are adopted for same dairy rotation, the P Index is lowered to 1.8 lbs/ac/year = 3.2 lbs/ac/year = 64% reduction from baseline. TMDL Reach Reduction goal will be met, if additional practices are implemented and maintained on most dairy acres in reach/watershed.
50 Other Tools for creating 9 Element Plans
51
52
53
54

55
56
57
58

59
60
61 Challenges for 9 Element Plans (1) Watershed Size, Type and Characteristics? (2) Identify the causes and sources of pollution in watershed that need reduction to meet WQ standards Select significant pollutant sources Estimate number and location of sources and background levels Use Maps and Tables (3) Describe management measures to reduce pollutant sources to meet WQS What practices Identify/map priority area(s) for practices (4) Estimate the load reductions expected from selected management measures
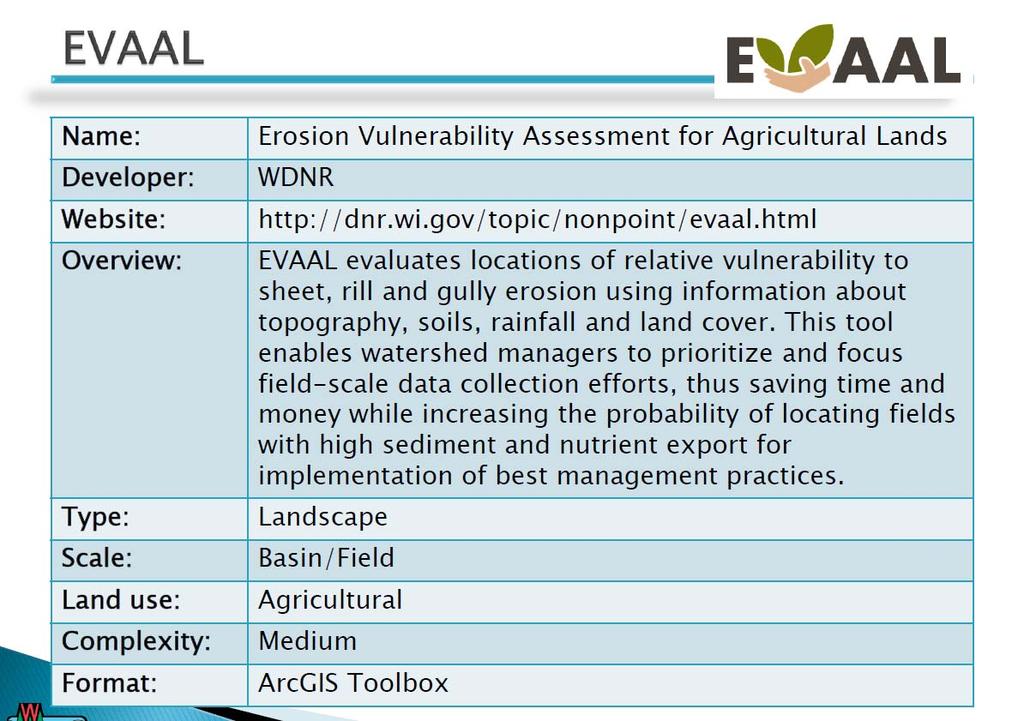
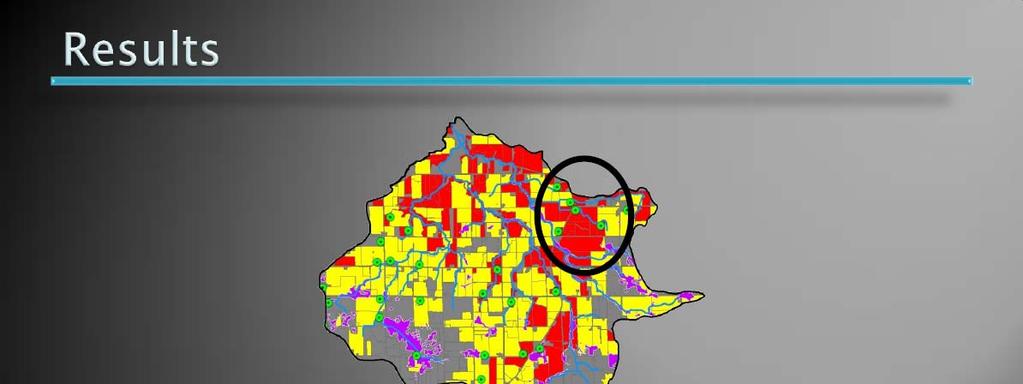
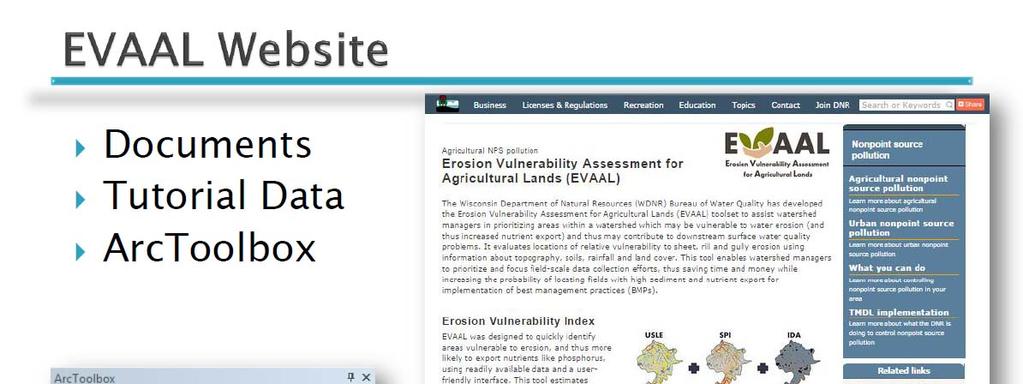
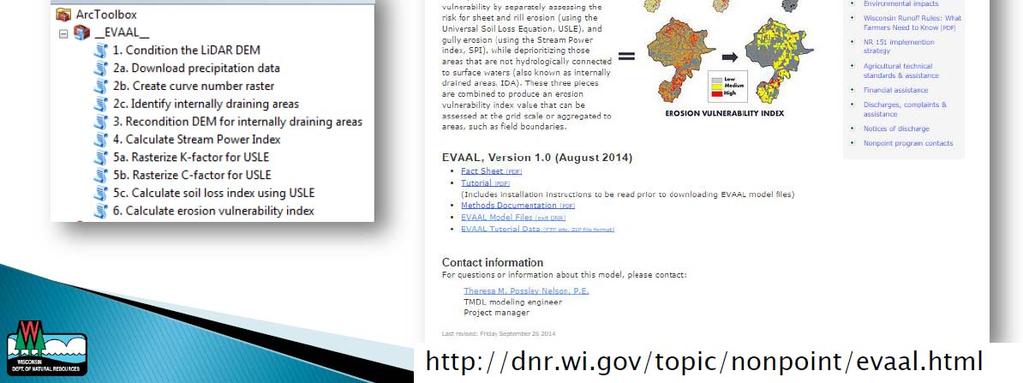
62 Solutions for 9 Element Plans TMDL s Approved or Under Development; use Reach Areas and % Reductions STEPL model Characterize watershed; select practices to meet TMDL % reductions SnapPlus model Incorporate into STEPL or use separately to reflect TMDL % reductions; use for site/practice specific pollutant reduction efficiencies EVAAL tool Prioritize areas for practices in TMDL reaches or other watersheds Existing Activities and Resources WQ monitoring and Assessment Data Before or after TMDL or other activities
63 Contact Information Andrew Craig DNR Nonpoint Source Planning Coordinator (608)