Seattle Center City Connector Environmental Assessment
|
|
|
- Justina Wright
- 5 years ago
- Views:
Transcription


1 The Seattle Department of Transportation Seattle Center City Connector Environmental Assessment March 2016 TR SEA MARCH 2015 TRANSPORTATION TECHNICAL REPORT I DRAFT-FOR INTERNAL DISCUSSION ONLY. WORKING DOCUMENT SUBJECT TO INTERNAL DELIBERATION AND REVIEW.
2 Cover image from SDOT
3


4
5 CONTENTS Executive Summary... ES-1 What is the Center City Connector?... ES-1 Why is the Center City Connector needed?... ES-1 Where is the Center City Connector located?... ES-1 Why is an environmental analysis being prepared?... ES-3 What alternatives were considered?... ES-3 How were alternatives screened?... ES-5 What is the Locally Preferred Alternative?... ES-6 When would construction begin and how long would it take?... ES-8 What potential impacts would result?... ES-10 What are the proposed methods to minimize or mitigate potential impacts?... ES-14 How have interested members of the public and key stakeholders been involved?... ES-16 1 Introduction Project Purpose and Need Project Purpose Project Need Alternatives Alternatives Screening Process Range of Alternatives Considered Screening Results Initial Screening Tier 1 Screening Tier 2 Evaluation Alternatives Carried Forward No Build Alternative Locally Preferred Alternative Affected Environment, Consequences, and Mitigation Measures Transportation Regional Facilities and Travel Transit Systems Arterials and Local Streets Freight Non-motorized Facilities Parking Mitigation Measures Air Quality and Greenhouse Gas Air Quality Standards and Conformity Air Quality Conditions Impacts Mitigation Measures Noise and Vibration Noise Vibration Impacts Mitigation Measures TBG SEA MARCH 2016 ENVIRONMENTAL ASSESSMENT PAGE III
6 CONTENTS 4.4 Land Use Impacts Mitigation Measures Economics Impacts Mitigation Measures Social and Community Effects Neighborhood Characteristics Community Facilities Demographics Impacts Mitigation Measures Visual and Aesthetic Resources Assessing Impacts on Visual and Aesthetic Resources Existing Conditions Impacts Mitigation Measures Stormwater/ Water Quality Impacts Mitigation Measures Utilities, Energy, and Electromagnetic Fields Utilities Existing Energy Use and Supply Electromagnetic Fields Impacts Mitigation Measures Hazardous Materials Hazardous Materials Sites within the Study Area Impacts Mitigation Measures Geologic and Soil Resources Topography, Regional Geology, and Seismicity Hydrogeological Conditions Geologic Hazards Impacts Mitigation Measures Public and Emergency Services Fire and Emergency Medical Services Police Impacts Mitigation Measures Parks and Recreational Resources Impacts Mitigation Measures Historic, Cultural, and Archaeological, Resources/Section Historic Architectural Resources Archaeological Resources in the APE Impacts Mitigation Measures Environmental Justice Study Area Demographics TBG SEA MARCH 2016 ENVIRONMENTAL ASSESSMENT PAGE IV
7 CONTENTS Outreach to Minority and Low-Income Populations Impacts Mitigation Measures Cumulative Impacts Geographic and Temporal Boundaries of Cumulative Analysis Past and Present Actions Reasonably Foreseeable Future Actions Cumulative Impact Assessment Transportation Air Quality and Greenhouse Gas Noise and Vibration Land Use Economics Social and Community Impacts Visual and Aesthetics Resources Stormwater/Water Quality Utilities, Energy, and Electromagnetic Fields Hazardous Materials Public Services and Safety Park and Recreational Resources Historic, Archaeological, and Cultural Resources Environmental Justice Mitigation Measures for Cumulative Effects Mitigation Measures Public, Tribal, and Agency Coordination and Involvement Overview of Phased Outreach Efforts Stakeholder Interviews Public Open Houses and Comment Cards Online Materials and Surveys Targeted Outreach Agency Coordination Federal Agencies and Native American Tribes Regional, State, and Local Agencies List of Appendixes A1 Acronyms and Abbreviations A2 References A3 List of Recipients A4 List of Preparers B1 Seattle Center City Connector Transit Study Volume I: Locally Preferred Alternative Report (on CD only) B2 Seattle Center City Connector Transit Study Volume II: Detailed Evaluation Report (on CD only) C Construction Phasing Concepts D4.2-A Intersection Data D4.2-B Synchro Data D4.2-C CAL3QHC Data TBG SEA MARCH 2016 ENVIRONMENTAL ASSESSMENT PAGE V
8 CONTENTS D4.4 Consistency with Land use Plans, Goals, and Policies D4.10 Hazardous Material Sites with Potential to Affect the Project (EDR Forms on CD only) D4.14 Historic Properties in the Area of Potential Effect Listed or Determined Eligible for the National Register of Historic Places D4.15 Social Resources and Environmental Justice Impacts and Mitigation Summary E Permits and Approvals F Section 4(f) G Preliminary Design Drawings of Locally Preferred Alternative H1 Transportation Technical Report (available on CD, or separately bound upon request) H3 Noise and and Vibration Technical Report (available on CD, or separately bound upon request) H7 Visual and Aesthetic Resources Technical Report (available on CD, or separately bound upon request) H14 Cultural, Historic, and Archaeological Resources Technical Report (available on CD, or separately bound upon request) I Endangered Species Act Screening Checklist List of Figures ES-1 Project Location, Showing Connections with South Lake Union and First Hill Streetcar Systems... ES-2 ES-2 Alternatives Considered... ES-4 ES-3 Design Options Considered... ES-5 ES-4 Locally Preferred Alternative... ES-7 ES-5 Construction Segments for the Center City Connector Trackway... ES-9 ES-6 Public Engagement at Key Milestones... ES Project Vicinity in Seattle, Showing Connections with South Lake Union and First Hill Streetcar Systems Evaluation Process Overview Range of Alternatives Considered Design Options Considered Existing, Planned and Funded Transportation Facilities in the Study Area Project Components Map Stewart Street and First Avenue Cross Sections TSP and Turning Modifications for Intersection along the LPA TPSS Locations and OCS/Wireless Segments TPSS as a Freestanding Structure (example located at Broadway and Minor Avenue) TPSS Placed Inside an Existing Parking Garage (example located in Portland, Oregon) Site Plan of the South Lake Union OMF Expansion Site Plan of the Chinatown-International District OMF Expansion Construction Segments for the Center City Connector Trackway Construction Phasing Study Area for Transportation Analysis TBG SEA MARCH 2016 ENVIRONMENTAL ASSESSMENT PAGE VI
9 CONTENTS Major Existing and Planned Transit Service along Proposed Alignment Future Daily Streetcar Boardings by Station, Future Daily Streetcar Boardings by Station, No Build Alternative and LPA Intersection LOS, PM Peak No Build Alternative and LPA Intersection LOS, PM Peak No Build Alternative and LPA Travel Time (by mode) No Build Alternative and LPA Travel Time (by mode) Existing Pedestrian Facility Condition along LPA Existing and Proposed Bicycle Facilities Existing Parking Facilities Air Quality Maintenance Areas MSAT Trends FTA Project Noise Impact Criteria Examples of Groundborne Vibration Levels and Human/Structural Response Noise Monitoring Locations and Impacts at 25 MPH Vibration Monitoring and Vibration Impacts Urban Villages in Downtown Urban Center and the Center City Connector Study Area Zoning in the Center City Connector Study Area Center City Connector FAZ Area Map Percent of Total Employment by Industry Sector (2010) Percent of Total Employment by Industry Sector (2040) Unemployment Rates ( ) Community Facilities in the Study Area Landscape Units and Key Observation Points (KOPs) Typical Visual Character Photos for Each Landscape Unit Protected Views KOP 1 McGraw Square as Seen From Stewart Street and Fifth Avenue, Looking East KOP 2 Stewart Street and Olive Way Between Third Avenue and Fourth Avenue, Looking East (Downhill) KOP 3 Pike Street and First Avenue, Looking North (Uphill) KOP 4 Pike Street, Looking West toward First Avenue KOP 5 Looking North (Uphill) along First Avenue from the Southwest Corner of First Avenue and Madison Street KOP 6 Looking North (Uphill) along First Avenue from the Southeast Corner of First Avenue and Marion Street KOP 7 Looking Northwest Along Portion of First Avenue S Between Cherry Street Columbia Street Location of South Lake Union Streetcar Expansion Seattle City Light Electricity Generation by Type, Locations of High-Risk Sites Public Services within the Half-Mile Study Area Park Resources in the Center City Connector Study Area TBG SEA MARCH 2016 ENVIRONMENTAL ASSESSMENT PAGE VII
10 CONTENTS Plan View of McGraw Square versus Roadway Right-of-Way with LPA Tracks and Westlake Station Area of Potential Effects (APE) Historic Properties in Westlake and Pike Place Market Area Historic Properties along First Avenue and Pioneer Square Area Historic Properties in International District-Chinatown District Historic Properties in South Lake Union Area Simulation of Third/Fourth Station at Stewart Street and Olive Way Simulation of Pike Station Simulation of Madison Station Simulation of Pioneer Square Station TPSS Site 2 within NRHP-eligible Bon Macy s Parking Garage at Stewart Street and Third Avenue TPSS Site 3 Adjacent to NRHP-listed Colonial/Grand Pacific Building within Vacated Seneca Street and below First Avenue Cross Section of OCS Pole Attachment Example of OCS Wire Suspension Pole Consolidated with Lighting and Signage Example of OCS Adhered to Historic Buildings in Pioneer Square Minority Populations within the Study Area Low-Income Population within the Study Area RFFAs for the Seattle Area Phased Outreach Milestones List of Tables ES-1 Summary of Impacts for the LPA... ES and 2035 PM Peak Hour Regional Facility Comparison Screenline # and 2035 Travel Impact Comparison Summary Existing Bus Routes and Stops (along Proposed First Avenue and Stewart Street Alignment) No Build Alternative Assumed Transit Service Changes Potential Bus Service Changes with the LPA Peak-Hour Bus Travel Time Comparison for LPA (No Build vs. Build), 2018, 5 6 p.m Peak-Hour Bus Travel Time Comparison for LPA (No Build vs. Build), 2035, 5 6 p.m Streetcar and ETB OCS Conflicts by Intersection Center City Connector Streetcar Operations Streetcar System Weekday Ridership and 2035 PM Peak Hour Vehicle and Person Throughput No Build Alternative vs. LPA (2018 and 2035) Screenline Traffic Volume Forecast Comparison, PM Peak Hour Driveway Turn Restrictions with LPA Future First Avenue Intersection Left-Turn Treatments TBG SEA MARCH 2016 ENVIRONMENTAL ASSESSMENT PAGE VIII
11 CONTENTS Existing and Future Pedestrian Volumes Existing On-Street Parking Inventory along LPA No Build Alternative and LPA On-Street Parking after Project Construction Ambient Criteria Pollutant Concentration Levels Modeled 1-Hour Carbon Monoxide Design Values Modeled 8-Hour Carbon Monoxide Design Values City of Seattle Exterior Sound-Level Limits OMF Sound-Level Limits Groundborne Vibration and Noise Impact Criteria for Light Rail Transit Service Frequency Streetcar General Noise Assessment Input Parameters Ambient Noise Monitoring Locations Streetcar Noise Impact Summary Predicted Streetcar Groundborne Vibration and Noise Levels at 50 feet for a Two-Story Masonry Building Streetcar Operational Vibration Impacts for the LPA FTA Construction Noise Impact Criteria Construction Noise General Assessment for Removal of Existing Pavement Construction Noise General Assessment for Installation of Trackwork Construction Vibration Criteria Building Damage Construction Vibration Sources Construction Vibration Building Damage Impact Buffers Historical and Projected Population Historical and Projected Household Data Employment Estimates from Operations Demographic Characteristics Center City Connector Landscape Units Utilities in the Study Area Projected Daily VMT and Energy Consumption for Impacts on Utilities High-Risk Sites in the Study Area Park and Recreational Resources Within the Study Area Demographic Characteristics Minority Populations in the Study Area Languages Spoken at Home Open Houses RFFAs in the Seattle Area Mitigation Measures by Discipline List of Stakeholder Meetings List of Open Houses TBG SEA MARCH 2016 ENVIRONMENTAL ASSESSMENT PAGE IX
12
13 EXECUTIVE SUMMARY What is the Center City Connector? The Center City Connector would expand the City of Seattle s streetcar system with 1.25 miles of new trackway in downtown Seattle, linking the South Lake Union and First Hill Streetcar lines to provide a streetcar system that is easy to use for a variety of trip purposes. It would serve major visitor destinations, as well as residential and employment centers, in areas where the city is experiencing significant growth. Why is the Center City Connector needed? The purpose of the Seattle Center City Connector is to serve the growing demand for Center City circulation trips 1 with a mode and alignment that are easy to use and provide continuity of travel between the downtown commercial core and Center City neighborhoods served by the South Lake Union Streetcar and the First Hill Streetcar. The Center City Connector is needed to support: Significant existing population and employment, and projected growth in the Seattle Center City. Growth in demand for Center City circulation trips. Expansion of Center City transportation capacity. Mobility needs of tourists and visitors in the Center City. Affordable transportation access to key social and human services located in the Center City. Where is the Center City Connector located? The Center City Connector would operate in public streets in Seattle s downtown commercial core, starting from the Westlake Intermodal (transit) Hub at the junction of Westlake Avenue and Sixth Avenue N, heading south and turning west onto Stewart Street to First Avenue near Pike Place Market, and continuing south along First Avenue to connect with the First Hill Streetcar Station at S Jackson Street and Occidental Street in Pioneer Square (see Figure ES-1). 1 Center City circulation trips are trips that begin or end in, or go through, Center City neighborhoods, which include major attractions, destinations, and connections with local and regional transit services. TBG SEA MARCH 2016 ENVIRONMENTAL ASSESSMENT PAGE ES-1


14 EXECUTIVE SUMMARY Figure ES-1 Project Location, Showing Connections with South Lake Union and First Hill Streetcar Systems TBG SEA MARCH 2016 ENVIRONMENTAL ASSESSMENT PAGE ES-2
15 EXECUTIVE SUMMARY Why is an environmental analysis being prepared? Projects receiving federal funding must complete an environmental analysis under the National Environmental Policy Act (NEPA) to ensure that significant aspects of a proposal are examined and that the public, agencies, and tribes are informed about potential impacts before a decision is made. NEPA also requires project proponents to provide an opportunity for public comment. The Center City Connector project is subject to NEPA because it is receiving funding from the Federal Transit Administration (FTA), the lead federal agency. FTA has determined that an environmental assessment (EA) is the appropriate level of documentation for this project. All City projects must also evaluate probable environment impacts under the State Environmental Policy Act (SEPA). This EA is being developed to jointly satisfy NEPA and SEPA requirements. What alternatives were considered? The City of Seattle Department of Transportation (SDOT) developed and evaluated a range of alternatives for the Center City Connector as documented in the Center City Connector Transit Study Volume I: Locally Preferred Alternative (LPA) Report (August 2014) ( Transit Study ). Five streetcar modes and seven alignments (see Figure ES-2) for the action alternatives were considered in the August 2014 study. Modes Considered Enhanced bus service Streetcar with exclusive transit way Streetcar in mixed traffic Light rail Monorail Alignments Considered SDOT considered a couplet alignment on Fourth and Fifth Avenues and other alternatives on First and Third Avenues, as well as several suggested by the public. However, SDOT eliminated alignments outside the Center City and those that would not effectively leverage city and regional partner transit investments. Based on public and city input, four East-West Design Options connecting First Avenue and Westlake Station were also considered, as shown on Figure ES-3. SDOT also considered a No Build Alternative, and while it does not meet the project purpose and need, it is carried forward as a baseline for comparison against the action alternative. The No Build Alternative describes what would happen if the Center City Connector were not to be built. The No Build Alternative includes all reasonably foreseeable and funded projects in the study area that are documented in relevant local and state plans, including Puget Sound Regional Council s (PSRC s) Transportation 2040 (PSRC, 2010). TBG SEA MARCH 2016 ENVIRONMENTAL ASSESSMENT PAGE ES-3

16 EXECUTIVE SUMMARY Figure ES-2 Alternatives Considered TBG SEA MARCH 2016 ENVIRONMENTAL ASSESSMENT PAGE ES-4
17 EXECUTIVE SUMMARY Figure ES-3 Design Options Considered How were alternatives screened? Alternatives that might meet the project purpose and need were evaluated and documented in the Transit Study. The evaluation framework consisted of three stages of analysis, each of which was accompanied by extensive public outreach activities (see Chapter 7 of this EA), which in turn guided the refinement and ultimate identification of the LPA, as endorsed by the Seattle City Council on July 21, Initial Screening. The initial screening phase evaluated a broad range of alignments to confirm that each would meet the purpose and need. While Third Avenue met many of the criteria, it would impact existing transit capacity and would be less effective at serving other Center City destinations. Because of lack of continuity of travel served by South Lake Union Streetcar and First Hill Streetcar, three modes were removed from further consideration: monorail, light rail, and enhanced bus. Tier 1 Screening. In the Tier 1 Screening phase, mixed-traffic and exclusive streetcar modes were found to meet both the purpose and need as well as broader City transportation goals and were advanced to the Tier 2 Evaluation. The Fourth/Fifth Avenue couplet alternative was removed because it fared poorly on travel time and would cause delays in transit service. Additionally, Fourth Avenue is already heavily used by transit buses, and street right-of-way will become limited when the City Bicycle Plan is implemented, involving a lane on Fourth Avenue converted to Bicycle way. Tier 2 Evaluation. The Tier 2 evaluation, again, compared mixed-traffic and exclusive streetcar modes. Using refined alternatives and more detailed measurements, results showed that the mixed-traffic mode would have less reliable travel times and lower ridership than the exclusive-lane streetcar mode. The mixed-traffic mode alternative also received weak public support. The East-West Design Options that would use Pike and Pine Streets with Fourth and Fifth Avenues were removed for similar reasons. TBG SEA MARCH 2016 ENVIRONMENTAL ASSESSMENT PAGE ES-5
18 EXECUTIVE SUMMARY The Transit Study is available in Appendix B of this EA and details the range of alternatives considered, the criteria upon which they were evaluated, and the ways in which the public, stakeholders, and agencies were engaged in the process. What is the Locally Preferred Alternative? The LPA is the alternative connecting the South Lake Union and First Hill Streetcars that was identified by the Mayor of Seattle and endorsed by the Seattle City Council on July 21, 2014 (City Council Resolution Number 31526). In addition to the alignment (described below), the LPA includes a single track between Westlake and Terry Avenues on Republican Street and five new stations. Station platforms would generally contain a small shelter, ticketing machines, and safe waiting areas outside of travel lanes. The LPA would add six new streetcars for the Seattle Streetcar fleet. Beginning at the northern-most end, the LPA would operate from Republican Street traveling on the existing South Lake Union trackway on Westlake Avenue to a new station adjacent to the Westlake Intermodal (transit) Hub. From here, the streetcar would travel on the new double trackway, turning westbound onto Stewart Street to First Avenue. Except for a short one-way couplet that would use Olive Way northeast-bound between Third and Fourth Avenues, the southwest-bound streetcar trackway would remain on Stewart Street. The LPA would continue southbound in an exclusive, double track in the center of First Avenue through Pioneer Square to connect with the existing Streetcar Station at S Jackson Street and Occidental Avenue S (see Figure ES-4). It would continue, using the existing First Hill Streetcar trackway, along S. Jackson Street to Eighth Avenue S. Streetcars would use the existing Chinatown- What is a Locally Preferred Alternative (LPA)? An LPA is the transportation alternative selected by the City leaders that best balances project needs and constraints. Project Component Definitions Turnback Track: A short track that the streetcar uses to cross from the current track to the center of two tracks and then, upon changing direction, cross into the opposite track direction. Access Track: A short track section used uniquely for accessing the OMF. Station Platform: The area where passengers wait at the station. Platforms can be located on the sidewalk or in the median of the road between the streetcar tracks. Platforms would be compliant with the Americans with Disabilities Act. International District operation and maintenance facility (OMF) access tracks on Eighth Avenue S to stop before King Street and then return in the opposite direction. The LPA would also expand one or both of the existing OMFs, located in the South Lake Union neighborhood at Fairview Avenue N and Thomas Street and in the Chinatown-International District at S Charles Street and Eighth Avenue S, for additional vehicle storage. TBG SEA MARCH 2016 ENVIRONMENTAL ASSESSMENT PAGE ES-6


19 EXECUTIVE SUMMARY Figure ES-4 Locally Preferred Alternative TBG SEA MARCH 2016 ENVIRONMENTAL ASSESSMENT PAGE ES-7
20 EXECUTIVE SUMMARY The streetcar would be electrically powered. For much of the route, streetcar vehicles would use onboard energy storage systems powered by overhead contact system (OCS) wires, which would convey electric power from the traction power substation (TPSS) to the streetcar. The OCS wires would be supported by wires suspended above the roadway from standard utility poles or from clips attached to adjacent building façades. The LPA would require one or two new TPSS sites, to be selected from among six potential locations shown on Figure ES-5. For portions of the route, the Center City Streetcar would operate wirelessly. When would construction begin and how long would it take? Construction on the Center City Connector would begin in fall of 2017 and would take between 12 and 24 months to complete. The project would primarily be phased within four primary segments (as illustrated on Figure ES-5): 1. Pioneer Square: 2 From the First Hill Streetcar Station at Jackson Street and Occidental to First Avenue and Columbia Street. 2. Madison Office Core: From Columbia Street along First Avenue to Union Street. 3. Pike Place Market: From Union Street along First Avenue to Stewart Street. 4. Westlake Connection: From First Avenue to the Westlake Station. 5. Other Project Components: Construction would also take place at the South Lake Union OMF and the Chinatown-International District OMF. The single-track on Republican Street to support access to the South Lake Union OMF would be installed at the same time as the South Lake Union OMF construction. As an option to the track on Republican Street, a First Hill turnback track would be built north of the Westlake Station. This approach would limit construction impacts at any particular location in the study area and provide flexibility in construction scheduling: Segment 1 (Pioneer Square) could occur in the beginning of the construction schedule, overlapping with Segment 3 (Pike Place Market), or it could be delayed to overlap with Segment 4 (Westlake Connection). Detailed information on construction phasing is available in Appendix C, Construction Phasing Concepts. 2 Due to the narrow right-of-way in this portion of the LPA, a detour route for 1 direction of travel during construction would be necessary. A more detailed description is provided in Section Arterial Roads, Construction Impacts. TBG SEA MARCH 2016 ENVIRONMENTAL ASSESSMENT PAGE ES-8


21 EXECUTIVE SUMMARY Figure ES-5 Construction Segments for the Center City Connector Trackway TBG SEA MARCH 2016 ENVIRONMENTAL ASSESSMENT PAGE ES-9
22 EXECUTIVE SUMMARY What potential impacts would result? The LPA would have both beneficial and adverse impacts. The adverse impacts generally would be short-term and the project will use mitigation measures to reduce them; as a result, the project is not expected to result in significant impacts. The LPA would not acquire any property, and it would be sited in a highly urbanized area that does not contain natural areas, farmlands, or open waterways. In the EA, the impacts are grouped as follows: Operational impacts are those long-term direct or indirect impacts that would result from the implementation and operation of the project. Construction impacts are those short-term or long-term direct or indirect impacts that would likely occur during the construction phase of the proposed action. Cumulative impacts result from the incremental impact of the action when added to other past, present, and reasonably foreseeable future actions. The No Build Alternative would not result in adverse effects in the study area. However, it would conflict with the City s transportation master plan and PSRC s regional transportation plans, and it would not enhance transportation connections to address the growth occurring in the Center City and connecting neighborhoods. It would not facilitate linkages with other regional transit modes. Table ES-1 summarizes the LPA s operational and construction impacts, after which cumulative impacts are summarized. Table ES-1 Summary of Impacts for the LPA Resource Discipline Operational Impact Summary Construction Impact Summary Transportation No noticeable change in regional trips or freight traffic. Improves movement of persons in study area and for those on connecting streetcars systems, including approximately 15,100 more streetcar system riders compared to 2014 ridership; improves transit travel times, reliability, and convenience. Minor changes to bus routes 12, 16, and 66, and elimination or rerouting of route 99 bus service. Conflicts with Electric Trolley Buses crossing wire. Conflicts with five driveways along First Avenue. Reduces First Avenue from four or five lanes during peak hour to one lane in either direction for non-transit vehicles with some left-hand turn pockets and one transit-exclusive lane in either direction; reduces vehicle carrying capacity while increasing No impacts on regional trips or freight traffic. Increase in traffic congestion. Diversion of northbound traffic to adjacent streets around Pioneer Square segment under construction. Hindered access to Alaskan Way as detour around Pioneer Square will degrade intersections below standards, unless four lanes of Alaskan Way can be restored during this time. Detours for bus transit service. Pedestrian access would be maintained, but detours of bicyclists around construction activities. Loss of on-street parking and loading zones in construction area. Additional congestion during large events, especially in Pioneer Square segment construction. TBG SEA MARCH 2016 ENVIRONMENTAL ASSESSMENT PAGE ES-10
23 EXECUTIVE SUMMARY Resource Discipline Operational Impact Summary Construction Impact Summary Air Quality and Greenhouse Gases person travel capacity via streetcar between frequent destinations. See Section for more detail. Intersections along the LPA alignment on average would experience an approximately 26 percent increase in delay (from about 13 to 17 seconds per vehicle) in 2018 and an approximately 40 percent increase in delay (from about 18 to 26 seconds per vehicle) in 2035 within the study area; but only one intersection (Westlake at Republican) would further delay a poorly operating intersection and additional 29 seconds (from 122 to 151 seconds per vehicle). Eliminates 4 of 7 northbound-towestbound and 2 of 5 southbound-toeastbound left-hand turns. Increase in pedestrians at station areas. Relocates one bike lane on Stewart Street. Loss of approximately 194 parking and vehicle loading zones (of 230 total), most of which are peakrestricted parking along First Avenue and Stewart Street and about 11 of which are on Republican Street. Slight increase in carbon monoxide concentrations at some intersections; none would cause an exceedance in air quality standards. Reduced mobile source air toxics emissions along the entire corridor. Reduced direct greenhouse gas emissions. Noise and Vibration 10 potential noise impacts, which would be substantially eliminated by operating speeds of 10 to 15 mph in these areas (at stations and corners). 7 potential vibration impacts, which would be substantially eliminated by operating speeds of 10 to 15 mph in these areas (at stations and corners), except an existing impact at one building along South Lake Union tracks. Temporary increases in fugitive dust, engine exhaust, volatile organic compounds, and other emissions; none that would exceed air quality standards. Temporary increases in noise levels from construction equipment. Temporary vibration impacts associated with construction equipment. TBG SEA MARCH 2016 ENVIRONMENTAL ASSESSMENT PAGE ES-11
24 EXECUTIVE SUMMARY Resource Discipline Operational Impact Summary Construction Impact Summary Land Use and Property Acquisition No property acquisition and no displacements. Consistent with regional and local goals and policies. Economics No business displacements. No reduction in property tax revenues. Loss of on-street parking mitigated with adequate off-street parking. Supports projected growth via enhanced connectivity. Creation of 22 new permanent jobs to operate project. Social and Community Effects Better connections between neighborhoods in Seattle. More reliable transportation. Easier access to certain parts of downtown. Visual and Aesthetics Visible project features include streetcars, trackway, OCS poles, and overhead wires, but the project would not lower visual quality of the corridor. Locating a TPSS in Westlake Square would have a minor visual impact but would not lower visual quality. No noticeable light and glare effects Streetcar passing through intersections would not block protected views more than typical traffic does. Water Quality Replaces 3.9 acres of existing pollutant-generating impervious surface. Utilities, Energy, and Electromagnetic Fields Permanent relocation of utilities from under trackway. No conflicts with electromagnetic fields. Additional use of electric energy for streetcar power, but project would reduce fossil fuel energy usage for inner city trips. No change to land use during construction. Short-term reductions in business activity, especially among retail establishments. Construction employment Increased sales tax revenues. Temporary noise, dust, and visual disturbance, and loss of on-street parking, but without significant impacts on social interaction and community functions. Temporary change in visual setting as a result of construction equipment and activities. Potential for erosion and sediment runoff to enter stormwater system. Potential unintended, short-term service disruption; potential relocation of large utility vaults out of trackway. Non-recoverable energy use during construction, which would be offset by energy savings over 15 years of operation. No electromagnetic field effects. Geology and Soils None. None, due to consideration of geologic conditions during design and construction methods development. TBG SEA MARCH 2016 ENVIRONMENTAL ASSESSMENT PAGE ES-12
25 EXECUTIVE SUMMARY Resource Discipline Operational Impact Summary Construction Impact Summary Hazardous Materials Continued long-term management of one high-risk hazardous materials site on currently owned City property. Potential accidental spills of hazardous materials at OMFs. Public and Emergency Services Park and Recreational Resources Historic, Cultural, and Archaeological Resources/ Section 106 Environmental Justice Minor increase in peak period travel time (less than 30 seconds) in 2035, but emergency vehicles could use trackway to circumvent traffic at their discretion. Reduced loading zones may alter when and where postal and waste service can be delivered. Potential placement of TPSS on Westlake Square, which would not change use or function of the square. Better access to some park resources. Minor impacts from OCS clips attached to façades or OCS suspension poles placed in areaways and potential placement of TPSS inside Bon Macy s parking garage. No adverse effects under Section 106. No high and adverse impacts disproportionately borne by Environmental Justice populations. Increased accessibility to other local and regional destinations for residents and employees in Center City, including low-income and minority populations. Section 4(f) No use of park and recreational resources that qualify for Section 4(f) consideration. De minimis use of Historic Resources that are eligible for the National Register of Historic Places by placing OCS clips and poles on or near historic properties and potential placement of TPSS inside Bon Macy s parking garage. Potential accidental release of hazardous materials. Minor increase in response and travel time for emergency responders. Potential for construction-related accidents. Slight annoyance to some park users from potential increase in noise and dust. Minor visual impacts on historic structures. Potential inadvertent archaeological discovery during construction. No adverse effects under Section 106. Short-term, minor effects that are not borne disproportionately by lowincome and minority populations. No construction use of park or historic resources eligible for consideration under Section 4(f). TBG SEA MARCH 2016 ENVIRONMENTAL ASSESSMENT PAGE ES-13
26 EXECUTIVE SUMMARY Cumulative Impacts. The Center City Connector s period of construction may overlap with other nearby development projects, as well as with many of the following large infrastructure projects in the vicinity: Removal of the Alaskan Way Viaduct and the replacement projects Continuing construction of the Elliot Bay Seawall Continuing construction of the SR 99 deep-bore tunnel and/or demolition of the Alaskan Way Viaduct Upgrades to the Seattle combined sewer system Improvements to the Seattle Waterfront Pier improvements at Piers 46, 66, and 62 Pier replacement at the Colman Dock Ferry Terminal Cumulatively, these projects would present collective impacts during construction in terms of automobile congestion, bus, and bike detours, air quality, visual nuisances, noise, hazardous materials, water quality, soil erosion, and potential economic hardships for some businesses in construction zones. These cumulative effects would be temporary, although some affected people may have to endure these impacts for a longer duration; but the other projects would be subject to the same best management practices (BMPs) and permitting requirements as the Center City Connector, which may reduce the magnitude of impacts. However, SDOT will convene a project coordination committee consisting of representatives of SDOT, the Washington State Department of Transportation, King County Metro, Washington State Ferries, the Port of Seattle, and Community Transit (agencies that participated in the Regional Transit Coordination for Downtown Seattle Committee) that will be responsible for resolving potential schedule conflicts between major public projects. As necessary, private development contractors will be included in coordination and construction phasing strategies. Coordination issues for this committee include traffic circulation, detour routes, or staggered construction sequencing in efforts to avoid concentrations of congestion, overlap in transit detours, and relocated stops, and managing loss of parking and changes to bike routes during construction, as warranted. Additionally, SDOT will coordinate construction activities through the SDOT Street Use Construction Hub Coordination Program. The HUB team consists of project and on-site coordinators who assess work throughout construction in areas where multiple simultaneous construction projects (both public and private) are occurring. The HUB team also coordinates with other City departments. Mitigation measures also address coordinating and implementing avoidance and minimization strategies on overlapping noise impacts, strains on businesses, disruptions that affect residents and the public, visual nuisances, delays, and rerouting emergency responses. Mitigation measures for the Center City Connector would substantially reduce potential impacts to less than significant. TBG SEA MARCH 2016 ENVIRONMENTAL ASSESSMENT PAGE ES-14
27 EXECUTIVE SUMMARY What are the proposed methods to minimize or mitigate potential impacts? The LPA design incorporates avoidance and minimization elements. For example, keeping the trackway within the public street right-of-way avoids the need for property acquisition. Similarly, using streetcars with onboard energy storage systems reduces overall energy use and minimizes the visual nuisance of OCS in portions of the corridor. The project would continue to advance minimization measures throughout the development and refinement of the project design. Regarding impacts from operations, design refinements would include Mitigation Measures are actions or design changes that reduce environmental impacts in several ways, including avoiding, minimizing, rectifying, and reducing the impact of an action or compensating for an impact by replacing or providing substitute resources or environment. development of specific signage to redirect parking to off-street lots, finalize restrictions on turning movements, finalize agreements with property owners of driveways to become right-in and right-out along First Avenue, identify areas for bicycle parking, finalize bike path rerouting details, and solidify areas available to replace loading zones. The City of Seattle would coordinate with King County Metro on minor changes to bus route planning and implementation. Final design would refine operation speeds and station bell noise levels to confirm that noise and vibration impacts can be avoided. Design would incorporate Seattle Municipal Codes to properly manage stormwater. Selection of the TPSS sites may consider five (5) other sites or aesthetic treatment of the potential Westlake Square location. No further measures would be necessary for the operations phase. To prevent or minimize impacts during construction, SDOT will develop a construction plan that requires the contractor to follow industry best practices. Elements of the construction plan will include: A transit and traffic control plan, which will anticipate detours, reductions in parking, bus traffic, and major events. BMPs will address bike and pedestrian safety and detour signage. An air quality control plan requiring fugitive dust control measures, including management of excavated materials, washing of vehicles, general maintenance of staging areas, and inspections of construction equipment to minimize exhaust emissions. A noise and vibration control plan, which will identify reduction measures, including limiting idling of equipment and requiring installation of barriers around noisier and vibratory equipment, and which would specify adherence to City of Seattle noise ordinance restrictions and allowable construction periods and identification of circumstance that may require obtaining a noise variance levels and maintaining safe buffers from areaways to avoid vibration impacts. A plan to address the needs of businesses in the construction area, improve signage, provide access, and implement promotional marketing strategies, as well as providing two-way communication during construction. A public information plan to provide open and regular construction updates and advanced notification of activities that may affect the community. TBG SEA MARCH 2016 ENVIRONMENTAL ASSESSMENT PAGE ES-15
28 EXECUTIVE SUMMARY Screening options to reduce visual nuisance in residential and high-traffic areas and direct night lighting downward to avoid light nuisance. A temporary erosion and sediment control plan and a stormwater pollution prevention plan, which would require BMPs to reduce sediment and contaminants from entering the stormwater system. A utility relocation plan, and coordination with utility providers to facilitate temporary backup services as needed. A standard, project-specific geotechnical investigation to determine where to avoid nearsurface obstructions, where soils need to be improved, and where seismic design considerations are needed. A spill prevention plan consistent with regulatory requirements and protocols to respond to accidental release of hazardous materials. Emergency route planning and ongoing communication for route detours. An archaeological monitoring and inadvertent discovery plan. Coordinate with the City s Special Events Committee and Seattle Police Department traffic control to provide enhanced public awareness of congestion and alternative modes during large events. The possible cumulative transit impacts of the Center City Connector construction period, which may overlap with other projects in the Center City vicinity, are being addressed by early and ongoing coordination with the Washington State Department of Transportation, King County Metro, Community Transit, Sound Transit, and other City of Seattle departments. Similar coordination would occur with transportation agencies that have projects under construction during the same period. This coordination and cooperative flexibility would reduce overlap of construction activities. Agency coordination will address cumulative impacts that affect traffic, transit, bike and pedestrian circulation, loss of on-street parking, emergency access, noise, dust, visual, and impacts on businesses during construction. These efforts would include a coordinated collective communication program that includes routine updates on construction sequencing and short-term utility interruptions and/or detours that may affect their transportation routines, as well as a one-point hotline where local businesses and neighborhoods can inquire about multiple construction issues regardless of which project the issue concerns. A complete list of mitigation measures is presented in Chapter 6 of the EA. The City of Seattle, with oversight from FTA, is committed to implementing and monitoring each mitigation measure, either during construction as applicable or prior to operation, depending on the impact type. Mitigation measures are included in project cost and budgeting. How have interested members of the public and key stakeholders been involved? NEPA requires that the development of the project is a multidisciplinary open process, which includes the project development phase and the environmental review. Figure ES-6 illustrates the key milestones of planning and environmental assessment and shows where input from the public has occurred. The project team designed outreach activities to attract participation from a diverse cross-section of society, and solicited public and stakeholder input at each stage of the study. Outreach efforts included stakeholder interviews, four public open houses held in a range TBG SEA MARCH 2016 ENVIRONMENTAL ASSESSMENT PAGE ES-16

29 EXECUTIVE SUMMARY of Center City locations, comment cards, online materials and surveys, media events, and briefings with community organizations. Open house invitations were translated into Chinese, Vietnamese, and Spanish and distributed broadly throughout downtown. FTA consulted with Native American tribes, including Muckleshoot Indian Tribe, Snoqualmie Tribe, Stillaguamish Tribe, Tulalip Tribes, and Confederated Tribes and Band of the Yakima Nation. Key stakeholders, tribes, and regulatory agencies, have been consulted through in-person meetings, letters, and s, and by document review. In addition, SDOT provided targeted public outreach for residents, business owners, property owners, and interest groups with a stake in transportation in the Center City and South Lake Union areas. Outreach included: Door-to-door outreach along the alignment within a block of the project to distribute the project folio and open house invitation, and to confirm contact information, for: o Large and small businesses, particularly in those areas that would be affected by a reduction in street parking. o Residential property owners and building management in the corridor, including the Four Seasons, 98 Union, Madison Tower, the Watermark, and Merrill Place. Distribution of informational materials to social services providers, low-income housing providers, and homeless shelters, including the Union Gospel Mission, Pike Place Market Foundation, Plymouth Housing, Bread of Life Mission, Yesler Community Center, Plymouth Housing Group Rental Office, the Josephinum, Women s Wellness Center, Plymouth on Stewart, Yesler Terrace Apartments, Gatewood Hotel, Sanitary Market, Livingston Baker, Bell Tower Apartments, Hotel Scargo, Kasota, Oxford Apartments, Market House Condominium, Pike Market Senior Center, and Lewiston Apartments. Chapter 7 of the EA provides additional details on meetings and correspondence. Figure ES-6 Public Engagement at Key Milestones TBG SEA MARCH 2016 ENVIRONMENTAL ASSESSMENT PAGE ES-17
30
.")
31 INTRODUCTION The City of Seattle s Department of Transportation (SDOT) is proposing the Seattle Streetcar the Center City Connector, a modern streetcar line in Seattle s Center City linking the existing South Lake Union and First Hill Streetcar lines (Figure 1-1). The Center City Connector would serve the City of Seattle s three intermodal hub (transit centers) areas: Westlake Intermodal Hub, Colman Dock Intermodal Hub, and King Street Intermodal Hub. In addition, it would provide convenient transfers to the Third Avenue Transit Spine 1 at both ends of downtown Seattle, and Link Light Rail at several locations (Figure 1-1). What is Seattle s Center City? The Center City area encompasses 10 neighborhoods Uptown, South Lake Union, Capitol Hill, Belltown, Denny Triangle, Pike/Pine, Downtown Commercial Core, First Hill, Pioneer Square, and the Chinatown-International District The Center City Connector would provide about 1.25 miles of new double trackway from the Westlake Intermodal Hub at the junction of Stewart Street and Westlake Avenue to First Avenue near Pike Place Market, south along First Avenue to connect with the First Hill Streetcar Station at Jackson Street and Occidental Street in Pioneer Square. Most of it would operate as a transit-only facility. It would also include a single track between Westlake and Terry Avenues on Republican Street, five new stations, and six new streetcar vehicles. It would also expand one or both of the existing streetcar operation and maintenance facilities (OMFs) located in (1) South Lake Union at Fairview Avenue N and Thomas Street and (2) in the Chinatown-International District at South Charles Street and Eighth Avenue South. A City of Seattle planning effort preceded this Environmental Assessment (EA). The City determined the need for certain downtown transportation improvements, as described in Chapter 2. Then, with significant public involvement, it completed a thorough analysis of ways to achieve the project purpose, as described in Chapter 3. That analysis led to the City Council s selection of a Locally Preferred Alternative (LPA) on July 21, Chapter 4 of this EA analyzes the LPA s environmental impacts as required by the National Environmental Policy Act (NEPA) and its implementing regulations, and by the NEPA implementing procedures of the U.S. Department of Transportation Federal Transit Administration (FTA). FTA may be asked to fund part of the project and thus, serves as the lead federal agency on the EA. As required by NEPA, the EA also analyzes a No Build Alternative as a baseline against which to evaluate the build alternative s impacts. 1 The Third Avenue Transit Corridor or Spine becomes a transit-only roadway Third Avenue between Jackson Street in the Chinatown- International District, through the Commercial Core, to the north end of Belltown at Denny Way during peak-hour commute periods, enhancing cross-city reliability and travel-time efficiency. Third Avenue is downtown Seattle s most heavily used transit corridor, used by more than 2,500 buses every weekday, and about 42,000 people board at bus stops on the corridor each day. TBG SEA MARCH 2016 ENVIRONMENTAL ASSESSMENT PAGE 1-1
32 1.0 INTRODUCTION The City of Seattle and FTA will use the EA s analysis and conclusions, augmented by any public comments on the document, in determining whether the project warrants a more detailed Environmental Impact Statement, or whether the analysis supports a finding that the project is not likely to have significant environmental effects. TBG SEA MARCH 2016 ENVIRONMENTAL ASSESSMENT PAGE 1-2

33 1.0 INTRODUCTION Figure 1-1 Project Vicinity in Seattle, Showing Connections with South Lake Union and First Hill Streetcar Systems TBG SEA MARCH 2016 ENVIRONMENTAL ASSESSMENT PAGE 1-3
34
35 PROJECT PURPOSE AND NEED A purpose and need statement explains why a project is being proposed and why it is a worthwhile investment of time and money. It also helps provide context and criteria for developing a range of possible alternatives and eventually the selection of a Locally Preferred Alternative (LPA). This chapter summarizes the purpose and need for the Center City Connector. The complete purpose and need statement can be found in Appendix B1a, Seattle Center City Connector Transit Study Volume I: LPA Report Appendix A (SDOT, 2014). 2.1 Project Purpose The purpose of the Seattle Center City Connector is to serve the growing demand for Center City circulation trips 2 with a mode and alignment that are easy to use, and to connect the existing South Lake Union and First Hill streetcar lines, providing a highly visible and effective Center City circulation system of travel between the downtown commercial core and Center City neighborhoods Project Need The Seattle Department of Transportation (SDOT) has developed a city-wide Transit Master Plan (TMP). The TMP is a comprehensive, 20-year look ahead to the type of transit system that will be required to meet Seattle s transit needs through The 2012 TMP update identified six major initiatives, one of which is to develop transit options in Seattle s Center City to support the continued vitality of an increasingly dense, urban center city. The need for the Center City Connector is based on: Substantial existing population and employment and projected growth in the Seattle Center City. Seattle s Center City neighborhoods have a high concentration of households and employment. Currently, Seattle Center City is estimated to have 200,000 workers and 69,000 residents, the highest employment and population densities citywide (Puget Sound Regional Council [PSRC], 2014). Within the Center City Connector area, PSRC projects a 35 percent increase in population and a 50 percent increase in employment, with an additional 31,000 people and 190,000 jobs expected by 2035 (PSRC, 2014). Recent increase in density zoning ( up-zoning ) amendments to the Seattle Comprehensive Plan encourage high-density residential housing to target areas near the main office core and greater office development in the downtown core. Growth in demand for Center City circulation trips. Within the City Center area, there is a strong market demand for short trips between the 10 neighborhoods that 2 For the purposes of this study, Center City circulation trips would occur between and within Center City neighborhoods, which include major attractions and destinations in the Center City as well as linkages with local and regional transit services to other major destinations. 3 The project was identified in the Seattle Transit Master Plan (Seattle Department of Transportation [SDOT], 2012) as a top priority, because it would increase transit capacity, enhance transit service quality and reliability, and improve transit options for residents, workers, and visitors traveling between and within Center City neighborhoods and attractions. TBG SEA MARCH 2016 ENVIRONMENTAL ASSESSMENT PAGE 2-1
36 2.0 PROJECT PURPOSE AND NEED comprise the Seattle Center City, including many destinations, employment sites, and services in the area (SDOT, 2011). Recent analysis found high demand for trips between Center City neighborhoods and for accommodating last mile connections for trips using existing and planned local and regional transit services (SDOT, 2014). Despite a high intensity of bus service in and through the Center City Connector corridor, few routes are directly oriented to Center City travel markets or last-mile connections from regional transit hubs to the final destination. Moreover, King County Metro bus service was rerouted from First Avenue to the Third Avenue transit way in 2011, leaving First Avenue and Alaska Way without continuous transit service through downtown. First Avenue contains many of the top tourist (e.g., Pioneer Square and Pike Place Market) and business destinations, including access to waterfront features, such as regional ferry service. Constraints on expansion of Center City transportation. There are limited north-south through streets available for transit to serve Center City destinations, and existing and planned transit will use much of the available capacity. Seattle already suffers from frequent congestion, ranking fifth among all U.S. cities in 2015 (TomTom International, 2015). Transportation capacity is already constrained in the Center City, as articulated in the following three points: o There is inadequate commuter access capacity within the mature transportation system, with no new available right-of-way, and a discontinuous street system must funnel traffic into five north-south Center City through streets. Reduced freeway portals (due to removal of the Alaskan Way Viaduct) will further limit how persons can move within the Center City. o Furthermore, increased future transit demand on the Third Avenue transit way and other transit-carrying surface streets limits capacity of inner city circulation, and a majority of these transit services are not oriented for local circulation trips. o Finally, ridership analysis shows that there is high passenger utilization on existing transit services serving connections between Center City neighborhoods. For example, routes traveling through the Commercial Core from Lower Queen Anne to the Chinatown-International District frequently run at 130 to 150 percent of seated capacity during peak periods (King County Metro. 2002). Mobility needs of tourists and visitors in the Center City. Approximately 10 million tourists visit Seattle each year, many seeking to use public transit as their primary means of mobility (Visit Seattle, 2013). Connections between retail districts are needed to support a vital local economy (e.g., Pioneer Square, Pike Place Market, Chinatown- International District, Belltown, and the commercial core). Downtown transit service must also meet the increased demand for access to Seattle s entertainment and cultural centers, such as the Waterfront, Seattle Center, and the Olympic Sculpture Park. Affordable transportation access to key social and human services located in the Center City. Many social service agencies in the Center City rely on good transit connections. Seattle's Center City has the highest concentration of services for homeless and vulnerable populations in the Puget Sound region. There are over 9,000 affordable TBG SEA MARCH 2016 ENVIRONMENTAL ASSESSMENT PAGE 2-2
37 2.0 PROJECT PURPOSE AND NEED housing units 4 located throughout the Center City. There are another 5,000 affordable housing units planned within Pioneer Square District. In South Lake Union, over 11,000 additional housing units are targeted by 2031, 4,000 of which are assigned to be affordable units. 5 Connections for low-income Center City residents to jobs in other Center City areas. While downtown has and continues to develop affordable housing in the City Center area, there is a growing concentration of affordable housing and low- and moderate-income jobs throughout the City. Both residents and employers require increased accessibility to take advantage of cross-community opportunities. Increasing greenhouse gas emissions resulting from vehicles and traffic congestion. Seattle s Climate Action Plan to reduce greenhouse gas emissions cannot succeed without higher-capacity transit to support dense, mixed-use neighborhoods in the Center City. As of 2008, approximately 40 percent of Seattle s greenhouse gas emissions came from road-related transportation sources. Transportation is the only sector in Seattle for which greenhouse gas emissions are continuing to increase, now roughly 7 percent above 1990 levels. 4 Affordable housing is intended for households those whose yearly income is 0-80 percent of the average median income. 5 Housing: South Lake Union 2012 Update: TBG SEA MARCH 2016 ENVIRONMENTAL ASSESSMENT PAGE 2-3
38
39 ALTERNATIVES The alternatives analysis is considered the heart of an environmental process. It involves reviewing a broad range of alternatives and selecting a more limited number to advance for detailed study in an environmental document, and it involves the public and agencies that have an interest in the project. This chapter summarizes the range of alternatives considered for the Center City Connector, outlines the screening process, and describes the results of that process, which led to the selection of the LPA. 3.1 Alternatives Screening Process The City of Seattle s Transit Master Plan, adopted in 2012, identified four corridors with the highest ridership potential and the greatest need for higher capacity transit service. One of these corridors was the Center City Connector, which runs through downtown Seattle and connects the South Lake Union and First Hill Streetcar lines. In 2013, SDOT developed, evaluated, and documented a range of alternatives for the Center City Connector. The process included strong involvement of stakeholders, other interested parties, and the general public by holding public meetings, soliciting input via notices in local newspapers and journals, and door-to-door outreach effort to businesses What is a Locally Preferred Alternative (LPA)? An LPA is the alternative that emerges from the evaluation of mode and alignment options in project planning and is selected by leadership because it is believed to best balance the project s needs and constraints. and property owners. The results of the screening process and public outreach activities are documented in the in the Center City Connector Transit Study: LPA Report (Volume I) (SDOT, 2014a) and Center City Connector Transit Study Detailed Evaluation Report (Volume II) and its technical appendixes (SDOT, 2014b). 6 From this report, the environmental review began, narrowing the remaining design options to further avoid and minimize impacts. The following records this alternatives analysis and the factors that influenced the identification of a Locally Preferred Alternative. The evaluation framework consisted of three stages of analysis: Initial Screening, Tier 1 Screening, and Tier 2 Evaluation. Figure 3-1 illustrates how that process narrowed down all reasonable alignment and mode options into an LPA to be analyzed further in this EA. Extensive public outreach accompanied each stage of the work (see Chapter 7) and influenced the design refinements and ultimate selection of the LPA, by the Seattle City Council on July 21, For more information about the screening and associated community outreach process, see Appendix B1 and B2 of this EA. 7 6 Volumes I and II of the transit study are hereafter referred to as the CCC Transit Study and can be found in Appendix B1 and B2 of this EA. 7 The full study can also be found at TBG SEA MARCH 2016 ENVIRONMENTAL ASSESSMENT PAGE 3-1
.")
40 3.0 ALTERNATIVES Figure 3-1 Evaluation Process Overview 3.2 Range of Alternatives Considered The CCC Transit Study evaluated five potential transit modes and seven transit alignments recommended in the Transit Master Plan (TMP; SDOT, 2012). Transit modes evaluated included the following: Enhanced bus service Streetcar with exclusive transit way Streetcar in mixed traffic Light rail Monorail Transit alignments evaluated included north-south alignments on Fourth/Fifth Avenues (couplet), Third Avenue and First Avenue. The project team solicited public input on these potential alignments at the February 6, 2013 open house. Several additional alignments identified by the public were among the seven alignments initially evaluated. The study then focused on narrowing alternatives in the Seattle Center City to leverage transit investments of city and regional partners by connecting existing streetcar termini at the north and south ends of the downtown area, consistent with the project s purpose and need. Figure 3-2 shows alternatives that were carried forward to the next screening phase. TBG SEA MARCH 2016 ENVIRONMENTAL ASSESSMENT PAGE 3-2

41 3.0 ALTERNATIVES Figure 3-2 Range of Alternatives Considered TBG SEA MARCH 2016 ENVIRONMENTAL ASSESSMENT PAGE 3-3
42 3.0 ALTERNATIVES 3.3 Screening Results The following sections describe the results of the three screening phases and how the LPA was selected Initial Screening The initial screening phase evaluated the various transit modes and a broad range of alignments against criteria derived from the project purpose and need (see Chapter 2). The following initial evaluation criteria were born out of the purpose and need: The consistency of an alternative or option with local and regional plans Whether an alternative or option met the project need of mobility and connectivity An alternative s ability to serve key destinations and anchors Transit capacity Reduction in greenhouse gas emissions Public and stakeholder support Monorail, light rail, and enhanced bus modes, as well as alignments that were outside the study area, were screened out. Similarly, the Third Avenue alignment would have had impacts on other transit services and would have been less accessible from the waterfront. The Fourth/Fifth Avenue and the First Avenue alignments, each with mixed traffic and exclusive streetcar modes, were advanced into the Tier 1 screening (Figure 3-2). For more details on the initial screening process, see Appendix B2 (Seattle Center City Connector Transit Study Volume II: Detailed Evaluation Report) Tier 1 Screening The intended outcome of the Tier 1 Screening process was to determine which alternatives best met the project purpose and need and also met the City of Seattle s broader transportation goals and objectives. The following additional project objectives, consistent with City-wide transportation goals, were added: Enhance: Enhance the customer experience on transit Initial Screening: Modes: Monorail, light rail, and enhanced bus screened out: lack of continuity of travel served by South Lake Union Streetcar and First Hill Streetcars. Alignments: Third Avenue alignment screened out: would not provide adequate service. Tier 1 Screening: Modes: Mixed traffic and exclusive streetcar advanced to Tier 2 Evaluation. Alignments: Fourth and Fifth Avenue couplet alignment screened out: poor travel time and other transit service impacts. Tier 2 Evaluation: Modes: Mixed traffic streetcar screened out: unreliable travel time, lower ridership than exclusive-transit, and weak public support. Alignments: East-West Design Options using Pike and Pine Streets with Fourth and Fifth Avenues design options screened out: same issues as the Fourth and Fifth Avenue alignments in Tier 1 Screening. Locally Preferred Alternative Mode: Streetcar in exclusive transit lanes. Alignment: First Avenue with eastwest connection using Stewart Street and Olive Way TBG SEA MARCH 2016 ENVIRONMENTAL ASSESSMENT PAGE 3-4
43 3.0 ALTERNATIVES Connect: Enhance connections between and access to Center City neighborhoods Develop: Support local and regional economic development goals Thrive: Strengthen downtown and Center City neighborhoods Sustain: Improve and sustain human and ecological health The Tier 1 screening removed the couplet alternative on Fourth/Fifth Avenues because it fared poorly relative to travel time and impacts on current bus service as a result of the heavy use of Fourth Avenue for regional transit routes and because the street right-of-way offers limited opportunity to expand exclusive transit operations, particularly given planned bike facilities identified in the Seattle Bike Master Plan (SDOT, 2014c). The First Avenue alignment had stronger stakeholder support, served tourist and visitor mobility needs more effectively, and had lower impacts on transit, bicycles, and automobiles. The two alternatives carried forward were on one alignment, the difference being that one alternative was an exclusive-streetcar travel lane and the other was mixed streetcar with general purpose traffic flow Tier 2 Evaluation The Tier 2 evaluation used many of the same evaluation measures used for the Tier 1 evaluation. However, during this phase, more detailed data and modeling were available. Based on stronger performance against the evaluation criteria and greater public support, the City Council selected the First Avenue Exclusive Streetcar as the Center City Connector LPA. However, the Council also requested further analysis of East-West Design Options for connecting First Avenue and Westlake Station (Council Resolution 31526). The East-West Design Options are described below and shown on Figure 3-3: Design Option A (identified as LPA): Travels from First Avenue east on Stewart Street and veers right onto Olive Way between Third and Fourth Avenues, before returning to Stewart Street then northbound on Westlake Avenue to reach the Westlake Station. Returning westbound from Westlake Avenue, it remains on Stewart Street to reach First Avenue. Stations would be at Third/Fourth Avenue and Stewart Street and at Westlake Avenue and Sixth Avenue. Design Option B: Travels from First Avenue east on Stewart Street, veers right onto Olive Way and turns south on Fifth Avenue. It returns westbound on Pine Street to reach First Avenue. Stations would be at Fifth Avenue and Olive Way, at Third Avenue and Stewart Street, and at Fourth Avenue and Pine Street. Design Option C: Travels from First Avenue east on Pike Street, north on Fourth Avenue and east again onto Olive Way. It returns south on Fifth Avenue before traveling westbound on Pine Street to reach First Avenue. Stations would be at Fifth Avenue and Olive Way, at Fourth and Pike Street, and at Fourth Avenue and Pine Street. Design Option D: Travels from First Avenue east on Pike Street, north on Fourth Avenue and east again onto Olive Way. It returns south entirely on Stewart Street to First Avenue. Stations would be at Fifth Avenue and Olive Way, at Fourth Avenue and Pike, and at Third Avenue and Stewart Street. TBG SEA MARCH 2016 ENVIRONMENTAL ASSESSMENT PAGE 3-5

44 3.0 ALTERNATIVES Figure 3-3 Design Options Considered The public supported Option A, which also had the best overall transit and vehicle performance and would interfere least with dedicated bicycle and pedestrian zones. This option has been incorporated into the LPA, with minor refinements as described in Section Finally, a design option for a side platform located on Eighth Avenue S at S King Street was considered as an element of the proposed turnback operation for cars originating from the northern terminus of the streetcar system (Fairview Avenue N at Campus Drive). The proposed station would have allowed passengers to board at this location, rather than boarding at the existing Seventh Avenue S and S Jackson Street platform. The proposal was evaluated but removed from further consideration because the second boarding location for the trips returning to the Center City and South Lake Union may cause confusion for riders and add delay to the turnback operation. 3.4 Alternatives Carried Forward Two alternatives were carried forward for detailed study in this EA: the No Build Alternative and the LPA, along with station locations and expansion of one or both of the OMFs No Build Alternative The No Build Alternative analyzed in this EA consists of the existing transportation system with planned regional and local projects that are committed to occur within the project study area. In the Center City Connector Project s Opening Year (2018), major infrastructure improvements assumed to be in place in the No Build Alternative include the Alaskan Way Viaduct Replacement Project, Elliott Bay Seawall Replacement Project, Waterfront Seattle Program, Seattle Streetcar Broadway Extensions, and Sound Transit s Link Light Rail expansion. Other major infrastructure improvements assumed to be in place by the Design Year (2035) include the Seattle Multimodal Terminal at Colman Dock and further expansion of Sound Transit s Link Light Rail system to destinations including Lynnwood to the north, Overlake to the east, and Kent/Des Moines to the south. (See Appendix H1, Transportation Technical Report, for a detailed list.) These assumptions are based on the latest information, but project dates can change. Figure 3-4 provides an overview of existing and planned transit services and facilities in the Center City. TBG SEA MARCH 2016 ENVIRONMENTAL ASSESSMENT PAGE 3-6

45 3.0 ALTERNATIVES Figure 3-4 Existing, Planned and Funded Transportation Facilities in the Study Area TBG SEA MARCH 2016 ENVIRONMENTAL ASSESSMENT PAGE 3-7
46 3.0 ALTERNATIVES Key downtown transit infrastructure includes the Third Avenue Transit Way (or spine), which is a roadway that converts to transit-only during peak commute periods; the Downtown Seattle Transit Tunnel; South Lake Union Streetcar, First Hill Streetcar, and Broadway Streetcar; and major multimodal hubs at Westlake Center, King Street, and Colman Dock. Transit services under construction include expansion of Link Light Rail to Capitol Hill, the University District, Northgate, and South 200th (Angle Lake). Other notable existing, planned, and funded transportation-related projects included in the No Build Alternative are the Alaska Way Viaduct Replacement tunnel construction work, removal of the Alaska Way Viaduct (SR 99), improving the Alaska Way arterial, and the recent implementation of protected bike lanes on Second Avenue and Pike Street. (Refer to Appendix C to the What is the No Build Alternative? The No Build Alternative provides a baseline for establishing and comparing the environmental impacts of alternatives. It describes what would happen if the project were not built and includes planned improvements that are part of the fiscally constrained longrange plan, which also includes the state DOT's transportation improvement program and local agency's capital improvement program. Transportation Technical Report [Methods and Assumptions Technical Memorandum] see Appendix H1 of this EA). The No Build Alternative for the 2035-year analysis includes Sound Transit s north and east expansion of the Link Light Rail system, which would limit the Downtown Seattle Transit Tunnel to light rail operations only, when all bus service that is currently inside the tunnel will be operating on surface streets at that time Locally Preferred Alternative The Center City Connector LPA would add 1.25 miles of double track, connecting the South Lake Union Streetcar trackway in northern downtown Seattle at the Westlake Transit Hub with the First Hill Streetcar trackway, which currently terminates in the Pioneer Square area at S Jackson Street and Occidental Avenue S. The new trackway would be transit-only, with the exception of a few one- or two-block segment on Stewart Street where adjacent uses do not allow a restricted-use lane. In addition, the Center City Connector would include five stations, turnback tracks, and expansion of either or both of the existing streetcar OMFs. The LPA would include a single-track using the south parking lane on Republican Street to connecting existing South Lake Union streetcar tracks on Terry and Westlake Avenues. Streetcar station platforms and sidewalk crossings would be compliant with Americans with Disabilities Act (ADA) throughout the Project Component Definitions Turnback Track: A short track that the streetcar uses to cross from the current track to the center of two tracks and then, upon changing direction, cross into the opposite track direction. Headways: The time between streetcar arrivals at each stop (frequency of stops). Platform: The area where passengers wait at the station. Platforms can be located on the roadside sidewalk or in the median of the road between the streetcar tracks. Platforms would be compliant with the Americans with Disabilities Act (ADA). TBG SEA MARCH 2016 ENVIRONMENTAL ASSESSMENT PAGE 3-8
47 3.0 ALTERNATIVES corridor. The Center City Connector would allow the First Hill Streetcar and South Lake Union Streetcar to operate as independent lines, with approximately 2 miles of overlapping service from Republican Street near South Lake Union to Eighth Avenue S in the Chinatown-International District (see Figure 3-5). The overlapping portion of the lines would have 5-minute headways between 7 a.m. and 7 p.m. on weekdays and Saturdays and between 8 a.m. and 7 p.m. on Sundays. The alignment and the individual components of the LPA are described below and illustrated in Appendix G. Beginning at the northern-most end, the streetcars would overlap starting at Republican Avenue, traveling on the existing South Lake Union trackway to a new station adjacent to the Westlake Transit Hub. From Westlake Avenue at Sixth Avenue the streetcars would travel on the new double trackway turning westbound on Stewart Street to First Avenue, except for a short oneway couplet that would use Olive Way northeast-bound between Third and Fourth Avenues. The southwest-bound streetcar trackway would remain on Stewart Street. The LPA would continue double track in transit-exclusive center lanes of First Avenue south to Pioneer Square, where it would connect with the First Hill Streetcar Station at S Jackson Street and Occidental Avenue S (see Figure 3-5). From here, the route would use the existing First Hill Streetcar trackway, along Jackson Street to Eighth Avenue S. Streetcars would use the existing Chinatown-International District OMF access tracks on Eighth Avenue S to return the streetcars in the opposite direction. No change to the existing track on Eighth Avenue S would be necessary. As shown on Figure 3-5, five new streetcar stations would be added along the corridor: Westlake: A center-median platform would be located on Westlake Avenue at Sixth Avenue. The existing platform on McGraw Plaza would remain and be used for events where there is demand for extra streetcar service. Third/Fourth Avenues: Located between Third and Fourth Avenues, the station would be split, with the southwest-bound platform on Stewart Street on the existing traffic island and the northeast-bound platform located on the sidewalk on Olive Way. Pike: This station would be a center-median platform on First Avenue between Pike and Pine Streets. Madison: One center-median platform would be located between Madison Street and Spring Street. Pioneer Square: A center-median platform on First Avenue would be located between Columbia and Cherry Streets. The station platforms would range in width from 10 to 12 feet, and the length of the stations would vary to maximize accessibility. In some cases, the station would be the length of the block to provide access at either end of the block. Stations may include benches, fare dispensers, and small canopy covers and would be designed in accordance with commercial and historic district guidelines. Other urban design features could include distinctive paving for transit-exclusive travel lanes. TBG SEA MARCH 2016 ENVIRONMENTAL ASSESSMENT PAGE 3-9


48 3.0 ALTERNATIVES Figure 3-5 Project Components Map TBG SEA MARCH 2016 ENVIRONMENTAL ASSESSMENT PAGE 3-10
49 3.0 ALTERNATIVES Roadway Operations and Transit Priority The Center City Connector would run in transit-exclusive travel lanes between the Westlake Intermodal Hub and the King Street Intermodal Hub with a minor exception on Westlake Avenue where vehicles exiting the Bon Macy s parking garage have a forced right turn eastbound into the lane where the Streetcar is planned. Currently, on First Avenue, the curb lanes designated for parking and loading zones become peak-hour travel lanes (see Figure 3-6). The LPA would remove these curb lanes to accommodate the exclusive double-track streetcar and station platforms. One general-purpose northbound and southbound lane would remain on either side of the center-running streetcar trackway. Example LPA trackway and station cross sections are illustrated on Figure 3-6. There are 15 signalized intersections along the alignment on First Avenue and another five on Stewart Street between Second and Westlake Avenues (for more information see Section 4.1, Transportation).Transit signal priority (TSP) treatments (see sidebar) has been analyzed along First Avenue and where possible along the route for maximum streetcar reliability and safety. Figure 3-7 illustrates the LPA s TSP and turning modifications for each intersection (also see the project drawings in Appendix G, Concept Design Drawings). The LPA would eliminate six existing left-hand turns along First Avenue: four for northbound vehicles turning west toward Elliot Bay at Columbia, Union, Pine, and Stewart Streets and two for southbound vehicles turning east at Marion and What is Transit Signal Priority? Traffic signals can be programmed for efficient traffic movements. A transit signal priority typically includes a detection system that alerts the traffic signal to prioritize the streetcar and other transit movements through the intersection, which helps keep transit on time but may mean that other traffic movements would be de-emphasized. What is Peak Hour? Traffic volumes tend to be heaviest in the morning and evening commute periods. The hour with the heaviest traffic volume is known as the Peak Hour. What is Signal Preemption? To make a signal preemption is to give signal priority. A normal signal time is modified to prioritize transit, emergency response, or a particular traffic movement. Cherry Streets. Vehicles turning left at Pike, University, Spring, Madison and S Jackson Streets would receive a unique turn-signal cycle to avoid crossing in front of a moving streetcar Streetcar Vehicles and Overhead Contact System Nine modern streetcar vehicles with on-board energy storage systems (OESS) would be purchased for the City of Seattle s streetcar fleet. Three existing vehicles without OESS would be surplused, bringing the City s total streetcar fleet to 16 vehicles. Streetcars with OESS can operate through wireless segments with no external power supply. The elimination of overhead wires in portions of the corridor would reduce conflicts with existing wires for trolley buses and minimize visual and aesthetic impacts. Figure 3-8 on illustrates the potential location of overhead contact system (OCS) wires and wireless segments along the proposed alignment. (See sidebar on Page 3-15.) TBG SEA MARCH 2016 ENVIRONMENTAL ASSESSMENT PAGE 3-11

50 3.0 ALTERNATIVES Figure 3-6 Stewart Street and First Avenue Cross Sections TBG SEA MARCH 2016 ENVIRONMENTAL ASSESSMENT PAGE 3-12


51 3.0 ALTERNATIVES Figure 3-7 TSP and Turning Modifications for Intersection along the LPA TBG SEA MARCH 2016 ENVIRONMENTAL ASSESSMENT PAGE 3-13
52 3.0 ALTERNATIVES Figure 3-8 TPSS Locations and OCS/Wireless Segments TBG SEA MARCH 2016 ENVIRONMENTAL ASSESSMENT PAGE 3-14
53 3.0 ALTERNATIVES Traction Power System and Substations The OCS would be powered by traction power substations (TPSS), which convert alternating current (AC) power from the Seattle City Light distribution network to direct current (DC) power at 750 volts, which the streetcars electrical system requires for operation. The north and south ends of the Center City Connector segment would be connected to the traction power systems of the South Lake Union and First Hill lines; one or two more TPSS would be added in the middle segment in locations selected during final design. The TPSS would be aboveground, enclosed structures approximately 15 feet by 30 feet (25 feet by 40 feet when including the grounding mat around the substation). Each TPSS would be located on public property in a prefabricated metal building (like the Broadway and Minor Avenue substation shown on Figure 3-9), in a custom building, or in an existing structure adjacent to the alignment, such as a private parking garage (as shown on Figure 3-10). Figure 3-8 identifies the locations of six potential TPSS sites. (See sidebar.) Operations and Maintenance Facilities How are the streetcars powered? The streetcar power system has four key components: Traction Power Substation (TPSS): An electric substation that converts power to the appropriate voltage, current type, and frequency for streetcars. Overhead Contact System (OCS): A contact wire, supported above the trackway, that conveys electric power from the TPSS to the streetcar. Pantograph: A metal arm on top of the streetcar that maintains contact with the OCS to convey power to the streetcar vehicle. On-Board Energy Storage System (OESS): A rechargeable lithium-ion battery system that provides an alternative power source. The batteries are charged from energy generated when the streetcar brakes while it is operating on the OCS. The OESS allows operation over parts of the alignment that do not have contact with the OCS. Storage for the six vehicles added to the fleet would require expansion at either or both the South Lake Union and Chinatown-International District OMFs. Figures 3-11 and 3-12 display the maximum expansion needed at either site: the South Lake Union and Chinatown-International District OMFs respectively. The expansion would include storage tracks, switches, OCS poles and wire. To consolidate the two OMFs into a single site, SDOT would need a half-acre at either South Lake Union or Chinatown-International District; alternatively, it could expand both facilities by one-third of an acre. 8 The Chinatown- International District OMF expansion area is located in an industrial zone on the southernmost portion of the existing OMF, away from residential units. Current office, shops, and support facilities at the Chinatown- International District OMF could accommodate the additional staff necessary for this expansion, but South Lake Union OMF would need an approximately 1,800- square-foot annex building. 8 Each OMF is located on City-owned property adequate to accommodate facility expansion. No new land acquisition would be required. TBG SEA MARCH 2016 ENVIRONMENTAL ASSESSMENT PAGE 3-15


54 3.0 ALTERNATIVES Figure 3-9 TPSS as a Freestanding Structure (example located at Broadway and Minor Avenue) Figure 3-10 TPSS Placed Inside an Existing Parking Garage (example located in Portland, Oregon) Figure 3-11 Site Plan of the South Lake Union OMF Expansion Figure 3-12 Site Plan of the Chinatown- International District OMF Expansion TBG SEA MARCH 2016 ENVIRONMENTAL ASSESSMENT PAGE 3-16
55 3.0 ALTERNATIVES To make room, an existing City-owned building on city property at the corner of Harrison Street and Fairview Avenue would be demolished. This lot is separated from residential units by the existing, fully enclosed OMF. The project would include a new access track on Republican Street between Westlake Avenue N and Terry Avenue N to improve access to the South Lake Union OMF and to accommodate returning northbound to southbound streetcars. Alternatively, a crossover and storage track planned just north of the Westlake Station platform would allow First Hill streetcars to turnback rather than continue north to Republican Street. The City has adequate property at either location to expand the streetcar storage tracks or consolidate the OMF at one location. A decision would be made following public review of this EA Construction The anticipated construction period (while influenced by several variables) could range between 12 months and 2 years. It would involve utility relocations, track work, and roadway reconstruction. Construction would be staged along the approximately 1.25-mile route, and duration of construction of any given portion of the project would typically be limited to between 6 and 8 months. Generally, one lane of traffic in each direction would be open along the streetcar alignment during active construction periods, although full road closures may be necessary for short periods during evenings or weekends. On-street parking would be eliminated during lane closures, and loading zones would be relocated in coordination with adjacent businesses, except where street right-of-way allows loading zone pockets without blocking through lanes. Pedestrian access would be maintained on both sides of the streets, except for short periods necessary for safety purposes. Business access would be maintained throughout construction except for rare situations that would be coordinated whenever possible to occur during off-business hours. Excavations at intersections would typically occur only at night or on weekends, with the opening covered with steel plates to allow weekday traffic. The following sections provide details on Center City Connector construction activities, phasing and staging. Construction Scope and Activities Construction of the Center City Connector project would involve the following activities: Installation of temporary traffic control measures Removal of existing pavement Relocation, modification, or protection in-place of utilities in conflict with or affected by excavations for street-level trackwork and streetcar platforms Installation of trackwork, complete with preparation of track bed, track slab, rail, fasteners, communication ducts, and infill concrete Adaptation of surface and subsurface drainage systems, if needed Construction of streetcar stops using cast-in-place concrete Construction of TPSS with electrical power feeds Installation of traffic signal and streetcar control improvements Installation of OCS poles, wires, support brackets, and feeder cables TBG SEA MARCH 2016 ENVIRONMENTAL ASSESSMENT PAGE 3-17
56 3.0 ALTERNATIVES Construction of station stop design finishes, such as canopies, benches, signage, trash receptacles, lighting, and other amenities necessary for a functional streetcar stop Signage and pavement markings Construction would require graders, bulldozers, cranes, concrete trucks, flatbed trucks, dump trucks to haul dirt, and other equipment, as described below. Trucks would haul away spoil materials to approved disposal sites. Staging area(s) for equipment and material storage would be within the street right-of-way, with a potential for use of vacant lots near the project, with appropriate permissions and permits. These locations would be selected to minimize impacts on nearby uses. A track-welding staging area would be located inside the S Main Street right-ofway between Occidental Avenue S and Second Avenue S. Construction Staging and Phasing Staging in Segments As shown on Figure 3-13, construction would be separated into four distinct geographic work segments, within which all or most of the track and roadway work would be completed: 1. Pioneer Square: 9 This segment would extend from the First Hill Streetcar Station at Jackson Street and Occidental to First Avenue and Columbia Street. 2. Madison Office Core: This segment would run along First Avenue from Columbia Street to Union Street. 3. Pike Place Market: This segment would extend down First Avenue from Union Street to Stewart Street. 4. Westlake Connection: This segment would extend from First Avenue to the Westlake Station. 5. Other Project Components: Construction would also take place at the South Lake Union OMF and the Chinatown-International District OMF in parallel with segment construction. The single-track on Republican Street to support access to the South Lake Union OMF and First Hill Streetcar turnback would be installed as part of the South Lake Union OMF construction. Within each segment, the work elements are generally grouped into utility relocation and track and platform civil work. Appendix C outlines the sequence for utility relocation, trackwork, and roadway reconstruction for each segment. The conceptual construction plans in Appendix C also describe anticipated lane closures, detours, and staging areas construction for each segment. Schedule Phasing Construction phasing will determine how long construction would take. Within each segment, a construction work area or zone would occupy two to eight consecutive blocks. The larger the work area or zone, the shorter the construction duration. Similarly, if construction activities continue through holidays and summer periods, the construction duration could also be shorter. 9 The narrow right-of-way in this portion of the LPA would necessitate a detour route for one direction of travel during some of the construction period. A more detailed description is provided in Section Arterial Roads, Construction Impacts. TBG SEA MARCH 2016 ENVIRONMENTAL ASSESSMENT PAGE 3-18
57 3.0 ALTERNATIVES Three schedule-phasing concepts for construction of the Center City Connecter are under consideration. They are described below and shown on Figure Concept A (12 months): This concept includes active work areas of six to eight consecutive blocks. Work in Segments 2 and 4 (Center City and Westlake) would likely have work performed during winter holidays. Work in Segments 1 and 3 (Pioneer Square and Pike Place Market) would be targeted to be completed during the winter/spring season to avoid the summer/fall peak tourism season. Concept B (18 months): This concept includes active work areas of four to five consecutive blocks. Work in Segment 2 (Center City) would be planned to be performed through the holiday periods. Work in Segment 4 (Westlake) would be conducted primarily on weekends. Work in Segments 1 and 3 (Pioneer Square and Pike Place Market) would be completed during the winter/spring season to avoid summer/fall peak tourism seasons. Concept C (24 months): This concept includes active work areas of two to three consecutive blocks. Work in Segment 4 (Westlake) would be conducted primarily on weekends. Work in Segments 1 and 3 (Pioneer Square and Pike Place Market) would continue during the holidays. In Concepts B and C, work performed in Segment 1 (Pioneer Square) could occur in the beginning of the construction schedule, overlapping with Segment 3 (Pike Place Market), or it could be delayed to overlap with Segment 4 (Westlake) construction. This flexibility may be necessary to coordinate with other construction projects in the area. The contractor would develop a detailed construction implementation plan before construction, including a specific construction schedule, traffic management plan, business and community coordination plan, and details on meeting permit requirements. TBG SEA MARCH 2016 ENVIRONMENTAL ASSESSMENT PAGE 3-19
58 3.0 ALTERNATIVES Figure 3-13 Construction Segments for the Center City Connector Trackway TBG SEA MARCH 2016 ENVIRONMENTAL ASSESSMENT PAGE 3-20


59 3.0 ALTERNATIVES Figure 3-14 Construction Phasing TBG SEA MARCH 2016 ENVIRONMENTAL ASSESSMENT PAGE 3-21
60
61 4 AFFECTED ENVIRONMENT, CONSEQUENCES, AND MITIGATION MEASURES This chapter evaluates potential environmental impacts related to the No Build Alternative and the LPA on elements of the natural environment (air quality, greenhouse gas, geology and soils, water quality), the built environment (transportation, land uses, noise and vibration, visual resources, utilities, energy, public services, park resources, and historic and archaeological resources), and the social and economic conditions in the study area. Each subsection of this chapter describes the study area, lists the applicable regulations followed, and provides the context of the affected environment. The analysis continues with anticipated operational impacts followed by construction impacts. Finally, as necessary, mitigation measures are listed to address impacts that could not be avoided or minimized by preliminary project design efforts, by following regulatory procedures, and/or by implementing best management practices (BMPs). In support of the analysis in the following subsections, Appendix H contains the Center City Connector Transportation Technical Report, the Noise and Vibration Technical Report, the Visual and Aesthetic Resources Technical Report, and the Cultural, Historic, and Archaeological Technical Report (SDOT, 2015a, b, c, d). TBG SEA MARCH 2016 ENVIRONMENTAL ASSESSMENT PAGE 4.0-1
62
63 TRANSPORTATION 4.1 Transportation The Seattle transportation network is an interdependent system of local and regional roadways that serve motor vehicles, transit systems, and non-motorized travelers. It consists of the following elements: Regional facilities and travel Transit systems Arterials and local streets, including operations (delays, volumes and travel time) and safety Freight Non-motorized facilities Parking Study Area The study area includes up to 65 intersections within an area bounded by Stewart Street to the north, Fifth Avenue to the east, S Jackson Street to the south, and Alaskan Way to the west. Elements of the transportation system work together to keep the movement of people and goods flowing through the City. A change in this system has the potential to affect the network functionality, most importantly during peak travel periods, such as the morning or evening commute between work and home. The evening commute is shown to have higher volumes, and therefore effects on the evening peak hour are analyzed in this section. The transportation section of this Environmental Assessment summarizes the detailed analysis provided in Appendix H1, Center City Connector Transportation Technical Report. Each of these elements are introduced with a description of the existing conditions, followed by analysis of the future operation and construction conditions for the No Build Alternative and the LPA. If there are impacts, mitigation measures are provided. The transportation study area is shown in Figure and presents the extent of the Seattle transportation network that would be affected. The regional facilities that pass through the study area include I-5 and State Route (SR) 99. Intersections adjacent to the proposed OMFs expansion sites were not included in the traffic operations analysis because streetcars would only make trips to and from this facility during early and late off-peak hours of the day. Therefore, traffic operations are assumed to not be affected by OMF operations. The methodology and assumptions used to analyze the transportation impacts of the Center City Connector project are described in detail in Appendix H1, Center City Connector Transportation Technical Report. The Center City Connector operations plan and future projects assumed in the No Build Alternative is presented in Section of Chapter 3 of this Environmental Assessment. A summary of the methods and assumptions include the following: Applicable agency guidelines and regulations that govern or influence the analysis of local and project-wide impacts associated with the project were incorporated into the analysis. The PM peak hour was measured for 2014 and modeled for two future study years: the year of opening (2018) and the design year (2035) for the No Build Alternative and the LPA. Future year auto demand volumes for 2018 and 2035 were based on the latest available travel demand forecast model from the Puget Sound Regional Council (PSRC). TBG SEA MARCH 2016 ENVIRONMENTAL ASSESSMENT PAGE 4.1-1

64 TRANSPORTATION Figure Study Area for Transportation Analysis TBG SEA MARCH 2016 ENVIRONMENTAL ASSESSMENT PAGE 4.1-2
65 TRANSPORTATION The City of Seattle, King County Metro, Washington Department of Transportation, and Sound Transit provided recent ( ) information regarding traffic volumes, intersection channelization and traffic control, parking supply and utilization, pedestrian and bicycle facilities, accident data, and transit service characteristics. Supplemental traffic counts were performed in fall 2014 at intersections where data was not available. The most recent release (spring 2014) of the PSRC model and associated land uses was used for the travel demand forecasts. The Simplified Trips-on-Project Software (STOPS) model developed by the Federal Transit Administration (FTA) was used to develop transit ridership forecasts. Regional travel measures included vehicle miles traveled (VMT), vehicle hours traveled (VHT), and volume-to-capacity (V/C) on regional facilities shown on Figure Intersections within the study area were analyzed using Synchro software, and streetcar operations were assessed using VISSIM software. Sidewalk and bicycle facilities within the walk and bike shed areas were assessed Regional Facilities and Travel Within the study area, regional travel interacts with local travel patterns; therefore, this transportation analysis begins with the forecasted changes to regional facilities for the year the proposed project would begin operations (2018) and the design year (2035). Travel demand modeling is not sensitive to short-term changes that would occur during construction. The construction impacts of the project would only affect the local roads near the construction area; therefore, construction impacts on regional facilities would be negligible. Definitions VMT: Vehicle Miles Traveled is the measurement of the total miles traveled by all vehicles in a specified area during a specified time. VHT: Vehicle Hours Traveled is the total vehicle hours expended traveling on the roadway network in a specified area during a specified time period. V/C: Volume of traffic demand over capacity of the roadway. Walk and bike shed: The shed is the total area that can be traveled by either walking or biking a comfortable distance from a transit station. Typically, a 5 to 10 minute walk or bicycle ride is a comfortable distance for pedestrians and bicyclists. There are two regional north-south roadways that travel through the Seattle area: I-5 and SR 99. I-5 provides interstate travel, while both roadways provide regional travel. I-5 is a major urban interstate freeway that runs the length of the west coast, between the Mexican and Canadian borders. The corridor serves commuters, freight transport, and bus service. I-5 varies between two and six mainline travel lanes in both directions within the study area, with additional lanes from the collector-distributor for the I-5/I-90 interchange and reversible express lanes that provide additional capacity. No modifications to I-5 in the Seattle area are assumed to occur by year 2018 or SR 99 (also known as the Alaskan Way Viaduct) is a state highway and a Highway of Statewide Significance (HSS) that connects major communities within the state. SR 99 travels through three counties: King, Pierce, and Snohomish. SR 99 also provides freight access between the TBG SEA MARCH 2016 ENVIRONMENTAL ASSESSMENT PAGE 4.1-3
66 TRANSPORTATION Port of Seattle and industrial land in the SoDo (South of Downtown) neighborhood to the south and other industrial areas to the north. SR 99 within the study area is currently a north-south grade-separated viaduct with two to four lanes in each direction and no shoulders. Access between SR 99 and the surface street system in downtown within the study area is currently provided at Seneca Street (northbound off-ramp) and Columbia Street (southbound on-ramp). The Alaskan Way Viaduct Replacement Program is planned for completion by 2018, the opening year for the Center City Connector. SR 99 will be replaced by a bored tunnel between S Royal Brougham Way and Roy Street. The tunnel will include two lanes in each direction and would be a tolled facility. The existing Alaskan Way Viaduct portion of SR 99 through Seattle will be removed. Full northbound and southbound access to and from SR 99 will be provided between S Royal Brougham Way and S King Street Impacts No Build Alternative Based on forecasts from the PSRC travel demand forecast model, the number of trips in the study area would be expected to grow at an approximate annual rate of 2.3 percent by the year 2018 and 1.3 percent by the year 2035, compared to the existing 2014 condition. As a result, under the No Build Alternative, I-5 and SR 99 would be more congested. Table shows the expected increase along these roadways due to projected growth. The volume of traffic as measured along a screen line (see screenline 2 south of Seneca Street on Figure 4.1-1) for the No Build condition was projected at 6,320 vehicles in In 2035, volume was predicted to increase to 7,250. The volume of traffic along I-5 would increase as well, but by a smaller percentage. V/C ratios indicate the capacity of a roadway to accommodate vehicle travel on that roadway. Both SR 99 and I-5 would be near capacity in 2035 in the No Build condition. As a result, general purpose traffic would experience longer trip durations on these facilities. Locally Preferred Alternative Operational Impacts Screenlines: Screenlines are imaginary lines drawn across roads to compare traffic volumes crossing into and out of a study area. Travel Demand Forecasts The overall forecasted growth for regional travel in the study area is the same for the No Build Alternative and LPA, as can be seen in Table The LPA would have a minimal effect on the number of auto trips within the Puget Sound region. Along SR 99, the volume of vehicles in the 2018 No Build condition would be approximately 6,320 while with the LPA it would be 6,370. Similarly in 2035, the volume of vehicles in the No Build condition would be 18,191 and with the LPA it would be 18,300. The reduction in the number of lanes on First Avenue in the LPA would have a negligible effect on regional facilities in the study area. The V/C ratios (shown in Table 4.1-1), which measure TBG SEA MARCH 2016 ENVIRONMENTAL ASSESSMENT PAGE 4.1-4
67 TRANSPORTATION the ability of the roadway to carry a projected traffic volume, 1 would be nearly the same for the No Build Alternative and LPA on both I-5 and SR 99. This holds for both the year of opening in 2018, and design year of Table and 2035 PM Peak Hour Regional Facility Comparison Screenline #2 Roads No Build LPA No Build LPA Volume V/C Volume V/C Volume V/C Volume V/C SR 99 6, , , , I-5 17, , , , Note: Volumes are for both northbound and southbound directions combined for PM peak, one hour peak. Vehicle Miles Traveled and Vehicle Hours Traveled VMT is the measurement of the total miles traveled by all vehicles in a specified area during a specified time. VHT is the total vehicle hours expended traveling on the roadway network in a specified area during a specified time period. Changes in regional VMT could indicate that people would travel either shorter distances or experience longer durations to get to their destinations. Changes in regional VHT generally reflect a change in congestion; for example, less congestion could correlate to fewer hours of travel. Table compares the VMT and VHT in the study area for the 2018 and 2035 No Build Alternative and LPA. The results show that the VMT and VHT between the No Build Alternative and LPA would be similar (less than 1 percent difference in VMT and no difference in VHT). The project is not be expected to cause a noticeable change in the regional VMT and VHT. It is expected that the project would have minimal effect on the amount of auto trips occurring in the Puget Sound region. This is because some trips would be more convenient using transit and, therefore, may reduce some vehicles on the regional roadway system. Table and 2035 Travel Impact Comparison Summary Measure No Build LPA % Diff. No Build LPA % Diff. Daily VMT 517, , , , Daily VHT 19,900 19, ,800 27, Source: PSRC (2014). Construction Impacts The project would only affect local traffic circulation near the project construction area. The effects of construction on regional facilities and regional travel would be negligible, as the proposed detours would only use local roads. 1 A V/C ratio of 1 means the roadway is at capacity. TBG SEA MARCH 2016 ENVIRONMENTAL ASSESSMENT PAGE 4.1-5
68 TRANSPORTATION Transit Systems This section provides projections for streetcar ridership and assesses the impact of the Center City Connector on bus transit service and bus passengers. Transit service in the study area includes services operated by King County Metro and other regional operators, particularly Sound Transit and Community Transit. This section includes assessments of the following potential impacts: Bus operations and ridership forecasts Passenger boarding patterns Travel times Bus travel time delay Electric trolley bus routing Transit service to and within downtown Seattle serves many key destinations in addition to the central business district. Adjacent to the project route, there are key tourist destinations such as Pioneer Square, Pike Place Public Market, Seattle Museum of Art, and several concentrated shopping centers. In addition to the South Lake Union and First Hill Streetcar services, there are several intermodal transportation hubs and transit corridors in downtown Seattle, shown on Figure 4.1-2, which include the following: Westlake Intermodal Hub: Southern terminus of the Seattle Center Monorail and an underground station for Central Link light rail service and local and regional bus service. King Street Station Intermodal Hub: King Street Station is served by Amtrak trains and intercity buses and Sound Transit Sounder commuter rail. The International District- Chinatown Station, located across Fourth Avenue, provides connections to the Downtown Seattle Transit Tunnel. Colman Dock Intermodal Hub: Ferry terminal used by Washington State Ferries and the King County Water Taxi for service across Puget Sound to West Seattle, Vashon and Bainbridge Islands, and Bremerton. Downtown Seattle Transit Tunnel (DSTT): Underground transit tunnel serving the existing terminus of Sound Transit Central Link light rail service, King County Metro bus service, and regional express bus service operated by King County Metro and Sound Transit. Seattle Center Monorail: Elevated monorail connecting the Westlake Hub to Seattle Center along Fifth Avenue. Third Avenue: A north-south, bi-directional corridor primarily serving King County Metro local bus and RapidRide services. Second and Fourth Avenues: A north-south couplet serving King County Metro express services and regional commuter services (Sound Transit and Community Transit). Regional services also use Fifth Avenue. Stewart Street/Olive Way: An east-west corridor connecting many express routes from downtown Seattle to I-5 as well as local services. Pike and Pine Streets: An east-west couplet serving many King County Metro local services; directly connects to the Westlake Hub and major downtown visitor locations. Other Transit Corridors: Pike Street/Union Street (express routes), Seneca Street/Spring Street, Madison Street/Marion Street, Yesler Way, James Street/Jefferson Street, Jackson Street. TBG SEA MARCH 2016 ENVIRONMENTAL ASSESSMENT PAGE 4.1-6


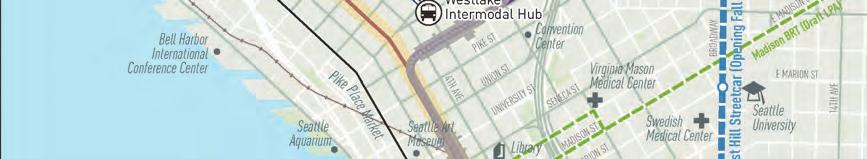


69 TRANSPORTATION Figure Major Existing and Planned Transit Service along Proposed Alignment TBG SEA MARCH 2016 ENVIRONMENTAL ASSESSMENT PAGE 4.1-7
70 TRANSPORTATION Table details transit routes that currently operate along First Avenue and Stewart Street. King County Metro routes 12, 16, 66, 113, 121, 122, 123, and 125 operate along segments of First Avenue. In particular: King County Metro Route 99 currently operates between Belltown and Chinatown- International Street District along First Avenue and S Jackson Street. The service operates during weekday peak periods year-round, approximately every 20 to 30 minutes, and during the midday and on weekends during the summer. King County Metro Route 12 uses First Avenue as a turnaround between Madison and Spring Streets. King County Metro Routes 16 and 66 operate on nine northbound and three southbound blocks of First Avenue. King County Metro Routes 113, 121, 122, 123, and 125 operate on six blocks of First Avenue in the northbound direction. King County Metro Routes 4, 7, 10, 11, 43, 47, and 49. Deadheading is the movement of transit vehicles without passengers aboard. In addition, several electric trolley bus (ETB) routes use First Avenue for deadheading, which means the buses use First Avenue to turn around and sometimes have layover time before continuing in the opposite direction on their route. Existing transit services also operate along parallel and intersecting transit streets near the LPA. Many north-south bus routes either cross Stewart Street on Third Avenue (about 40 routes) or use portions of Stewart Street in the westbound direction along the LPA. This includes about 50 routes that operate southbound on Second Avenue and about 45 routes that operate on Fourth Avenue. The routes that operate along westbound Stewart Street and overlap with the LPA are detailed in Table and summarized below: King County Metro Routes 25, 66, 70, 304, and 355 overlap with the LPA between Westlake and Third Avenues, and turn onto southbound Third Avenue. King County Metro Routes 177, 178, and 308 overlap with the LPA between Westlake and Second Avenues, serve a stop west of Fourth Avenue, and turn onto southbound Second Avenue. Community Transit Routes 402, 405, 410, 412, 413, 415, 416, 417, 421, 422, 424, 425, and 435 overlap with the LPA between Westlake and Second Avenues, serve a stop west of Fourth Avenue, and turn onto southbound Second Avenue. Sound Transit Routes 510, 511, 512, 513, and 545 overlap with the LPA between Westlake and Fifth Avenues, and turn onto southbound Fifth Avenue. Sound Transit Routes 590, 592, 594, and 595 overlap with the LPA between Third and Second Avenues and turn from southbound Third Avenue onto westbound Stewart Street and then onto southbound Second Avenue. TBG SEA MARCH 2016 ENVIRONMENTAL ASSESSMENT PAGE 4.1-8
71 TRANSPORTATION Table Existing Bus Routes and Stops (along Proposed First Avenue and Stewart Street Alignment) Operator / Route Segment Travelled 1st Avenue Northbound Stops Daily Trips Segment Traveled Stops Daily Trips 1st Avenue Southbound KCM 12 Madison to Marion (1 block) KCM 16 Jackson to Seneca (9 blocks) Marion 52 Madison to Cherry (3 blocks) KCM 66 Jackson to Seneca (9 blocks) Marion 37 Madison to Cherry (3 blocks) KCM 99 Jackson to Broad (25 blocks) Cherry, Marion, University, Lenora, Cedar KCM 113 Seneca to Virginia (6 blocks) University 4 KCM 121 Seneca to Virginia (6 blocks) University 17 KCM 122 Seneca to Virginia (6 blocks) University 6 KCM 123 Seneca to Virginia (6 blocks) University 4 KCM 125 Seneca to Virginia (6 blocks) University 39 Stewart Street Westbound KCM 25 Westlake-Third 12 KCM 66 Westlake-Third 38 KCM 70 Westlake-Third 60 KCM 177 Westlake-Second Fourth 9 KCM 178 Westlake-Second Fourth 7 KCM 304 Westlake-Third 4 KCM 308 Westlake-Second Fourth 4 KCM 355 Westlake-Third 9 CT 402 Westlake-Second Fourth 14 CT 405 Westlake-Second Fourth 4 CT 410 Westlake-Second Fourth 8 CT 412 Westlake-Second Fourth 10 CT 413 Westlake-Second Fourth 13 CT 415 Westlake-Second Fourth 10 CT 416 Westlake-Second Fourth 5 CT 417 Westlake-Second Fourth 5 CT 421 Westlake-Second Fourth 8 CT 422 Westlake-Second Fourth 2 CT 424 Westlake-Second Fourth 2 CT 425 Westlake-Second Fourth 4 18 Wall to Jackson (21 blocks) NA 74 Marion 53 Marion 38 Wall, Lenora, Union, Marion, Yesler 18 TBG SEA MARCH 2016 ENVIRONMENTAL ASSESSMENT PAGE 4.1-9
72 TRANSPORTATION Operator / Route Segment Travelled Stops Daily Trips Segment Traveled Stops Daily Trips CT 435 Westlake-Second Fourth 6 ST 510 Westlake-Fifth 21 ST 511 Westlake-Fifth 18 ST 512 Westlake-Fifth 53 ST 513 Westlake-Fifth 11 ST 545 Westlake-Fifth 84 ST 590 Third-Second 36 ST 592 Third-Second 16 ST 594 Third-Second 33 ST 595 Third-Second 5 Notes: KCM = King County Metro. ST = Sound Transit. CT = Community Transit. Electric Trolley Bus Routes 4, 7, 10, 11, 43, 47, and 49 may use First Avenue for deadheading (non-revenue service). Some routes that normally use the DSTT operate trips on Stewart Street when the tunnel is closed late at night or at other times, including Routes 71, 72, 73, 74, 101, 102, 106, and 150. Routes 71, 72, 73, 106, and 150 serve a bus stop west of Fourth Avenue when they operate on Stewart Street. Source: King County Metro Schedules; fall 2014 after September service cuts. Community Transit and Sound Transit Schedules. NA = Not applicable Impacts No Build Alternative Several projects, including streetcar, light rail, and bus rapid transit (BRT), are planned that will change transit service in downtown Seattle under the No Build Alternative. A 0.5-mile extension of the First Hill line from Denny Way to Roy Street along Broadway is in the design and environmental permitting stage. This extension is expected to open in late Both the First Hill and South Lake Union Streetcar lines would operate at approximately 10 minute headways by the year In addition, related to bus service using First Avenue, when the Alaskan Way Viaduct and the Columbia and Seneca Street ramps to and from the Alaskan Way Viaduct are removed, Columbia Street will be the permanent southend transit pathway between Alaskan Way and Third Avenue. 2 The No Build Alternative also includes some changes to the bus service for both 2018 and 2035 conditions. They are listed in Table Currently, buses traveling on the Alaskan Way Viaduct use the Columbia and Seneca Street ramps for access to/from downtown Seattle. The Southend Pathway is a planned east-west transit corridor connecting buses to the Third Avenue transit spine. See TBG SEA MARCH 2016 ENVIRONMENTAL ASSESSMENT PAGE
73 TRANSPORTATION Table No Build Alternative Assumed Transit Service Changes Service Direction * Bus Service Changes Related to Link Light Rail Extensions DSTT - Link Light Rail University Extension (2016); Routes 71, 72, 73 Northgate Link (2021) Routes 41, 74, 76, 77, 312, 316, 355, 522 East Link (2023): Routes 111, 114, 212, 214, 216, 218, 219, 550, 554 Lynnwood Link (2023): Metro Routes 301, 303, 304, 308; Community Transit Routes 402, 405, 410, 412, 413, 415, 416, 421, 422, 424, 425, 435, 510, 511, 512, 513 NB/SB NB/SB NB/SB NB/SB Joint Bus/Rail Operations King County Metro expects bus operations may be discontinued no later than 2019 and possibly sooner a DSTT, 6-minute peak and 10- minute off-peak headways New U-Link network implemented i No change No change No change Changes along Center City Connector Alignment 12 SB 16, 66 i, j NB/SB 99 NB/SB Other Bus Service Changes Proposition 1 Transit Measure f Southend Pathway Routes 113, 121, 122, 123, 125 Existing routing using Madison and Spring is assumed; potential rerouting is under consideration e New U-Link network implemented No change (depends on completion of seawall and Alaskan Way Viaduct replacement projects) Exclusive Rail Operations DSTT, 6-minute peak and 10- minute off-peak headways New U-Link network implemented i No changes to Link headways New Northgate Link network implemented b New East Link network implemented c New Lynnwood Link network implemented d Existing routing using Madison and Spring is assumed; potential rerouting is under consideration e Same as 2018 Likely shifted to new Alaskan Way surface street or replaced by new service tied to Waterfront Seattle project - Existing Service f Existing Service f NB Rerouted off 1st Ave to 3rd Ave via Columbia g Rerouted off 1st Ave to 3rd Ave via Columbia g * NB = northbound; SB = southbound a Due to decreased Link headways with opening of University extension and Convention Place expansion construction needs. b Sound Transit Northgate Link Light Rail Extension Project. Bus routes assumed to terminate at Northgate Transit Center by TBG SEA MARCH 2016 ENVIRONMENTAL ASSESSMENT PAGE
74 TRANSPORTATION c Sound Transit East Link Light Rail Extension Project. Bus routes assumed to terminate at Mercer Island. (Routes 111 and 114 are planned to extend to downtown Bellevue; Routes 210 and 215 were eliminated in fall 2014.) d Sound Transit Lynnwood Link Light Rail Extension Project. Bus routes assumed to terminate at Lynnwood Transit Center by year e Potential route modifications are being considered in SDOT s Madison Bus Rapid Transit Project. Project is currently in conceptual design stage and implementation year is unknown. Route 12 will need to use First Avenue southbound between Madison and Marion Streets until the Madison BRT project is implemented. f Proposition 1 is a City of Seattle ballot measure approved in November 2014 to fund transit service enhancements. Specific changes had not been finalized as of December Assumptions were developed based on preliminary materials. Service after September 2014 service cuts was assumed, plus additional peak-hour bus service. Changes subsequently announced include split of RapidRide Line C and D and extension of Line C to terminus in South Lake Union (effective March 2016), and other service improvements. g Permanent Southend Pathway alignment post-alaskan Way Viaduct based on Downtown Southend Transit Study (King County Metro, August 2012). Implementation time frames of interim and permanent southend pathways are dependent on the schedules of the Alaskan Way Viaduct and Waterfront Seattle projects. Interim pathway required for about 18 months; would use new Alaskan Way when completed. i Based on information from King County Metro, routes 16, 66, 71, 72, and 73 are likely to be revised in March 2016 with opening of the University Link. j Routes 16 and 66 are now on 1st Ave because the SDOT seawall project eliminated their layover on Alaskan Way and Metro wanted to serve the Marion Street causeway. In March 2016, there may be other service at the causeway and routes 16 and 66 may be deleted or revised for reasons unrelated to the Center City Connector project. Source: Agency plans and schedules, including information provided by King County Metro schedules on October 23, Overall, under the No Build Alternative travel times for bus service would degrade slightly in the corridor due to increases in overall auto demand volumes at intersections in the study area. The greatest increase in peak-hour bus travel time would be seen along Second Avenue southbound between Virginia and Pike Streets, increasing from 1.7 minutes in 2018 to 3.4 minutes in Along Stewart Street in the westbound direction between Westlake and Second Avenue, bus travel time would increase by 0.5 minute from 2.4 minutes in 2018 to 2.9 minutes in Along First Avenue, bus travel times (average of northbound and southbound directions) between S Jackson and Stewart Streets would increase slightly from 7.5 minutes in 2018 to 8.0 minutes in Total bus volumes for routes crossing the LPA are projected to decrease slightly from the 2018 No Build to the 2035 No Build conditions, due to the elimination or truncation of bus routes caused by the bus service changes described above, most notably Link light rail extensions and resulting changes to the bus network (see Table 4.1-4). There are only slight changes in bus travel time for routes crossing the LPA on Third Avenue (northbound: approximately 3 seconds faster per bus between 2018 and 2035; southbound: approximately 5 seconds longer per bus between 2018 and 2035). However, there is an approximately 100-second (1.6-minute) increase on Second Avenue between 2018 and See Table and Table The No Build Alternative would not provide direct connectivity between the two streetcar systems and the other transit modes because the First Hill and South Lake Union Streetcar lines would continue to operate as separate lines. Therefore, it would not increase efficiency and reliability in the streetcar system. While ridership on both the First Hill and South Lake Union streetcars would increase with projected growth over time in population and employment, the ridership potential from point to point travel would not be realized. Please see Tables and for additional information and analysis. TBG SEA MARCH 2016 ENVIRONMENTAL ASSESSMENT PAGE
75 TRANSPORTATION Locally Preferred Alternative Operational Impacts The LPA would affect bus transit service within the study area along First Avenue and Stewart Street. It would also enhance the operation of the existing First Hill and South Lake Union streetcar lines. Bus Operations and Ridership In addition to the planned transit projects included in the No Build Alternative, bus transit service changes would be expected in conjunction with the LPA. Bus changes expected with the LPA are described in Table These service adjustments would reduce duplication with proposed streetcar service and minimize conflicts. Impacts on electric trolley bus operations are discussed in the electric trolley bus section below. Table Potential Bus Service Changes with the LPA Service Direction a SB 16, 66 NB/SB Potential rerouting of turn-around from 1st Ave (Madison to Marion) a Reroute off 1st Ave onto 3rd Ave to southend turnaround b Potential rerouting of turn-around from 1st Ave (Madison to Marion) a Reroute off 1st Ave onto 3rd Ave to southend turnaround b 99 NB/SB Route eliminated or rerouted c Route eliminated or rerouted c a The proposed Madison BRT project is evaluating a variety of end-of-line turnaround options at the west end of the Madison corridor. Route 12 will need to use First Avenue until the Madison BRT project is implemented. b Turnaround is yet to be determined but would be within the vicinity of S Jackson Street. c The return of Route 99 to Alaskan Way would depend on completion of the seawall replacement project and the new Alaskan Way surface street. Bus Travel Time Delay To assess the impact of the LPA on bus service operating along and crossing the streetcar alignment, changes to bus travel times were evaluated for the LPA for the PM peak hour (5 to 6 p.m.) for 2018 and 2035 conditions. Aggregate travel times were calculated by multiplying PM peak-hour bus volumes for blocks along the alignment and intersecting transit streets by estimated transit delays based on the traffic modeling described in Section The analysis assumes planned service changes listed for the No Build Alternative (see Table 4.1-4) and those associated with the LPA (see Table 4.1-5). 3 Buses traveling along the LPA alignment primarily use Stewart Street and Olive Way. Overall westbound delay along Stewart Street (between Westlake and Second Avenues) would decrease by an aggregate of about 11 percent in the 2018 year of opening 4 and increase by approximately 8 percent in the 2035 design year, compared to the No Build Alternative. This represents a 3 This analysis assumed that transit signal priority [TSP] would be implemented at many intersections along the alignment; however, SDOT is currently planning to coordinate signals instead of implementing TSP, which would likely result in lower delay to cross streets and reduced impacts. 4 This analysis assumes the Downtown Seattle Transit Tunnel is still open to some bus transit, but all buses are surface running in TBG SEA MARCH 2016 ENVIRONMENTAL ASSESSMENT PAGE
76 TRANSPORTATION reduction of approximately 5 seconds per vehicle in 2018 and an increase of about 20 seconds per vehicle in In particular, as shown in Table 4-1.8, westbound bus delay would increase between Third and Second Avenues by about 17 seconds per vehicle in both 2018 and In 2035, westbound delay along Stewart would also increase slightly between Westlake and Fifth Avenues (approximately 1 second per vehicle) and between Fifth and Fourth Avenues (approximately 4 seconds per vehicle). Along First Avenue, King County Metro Route 12 is a significant bus service that would continue to use First Avenue as a turnaround (currently in the southbound direction, between Madison and Marion Streets). Travel times would remain similar; the projected change in travel time with the LPA is a 2-second increase per vehicle in 2018 and a 1 second per vehicle decrease in For buses crossing the LPA in the north end (Stewart Street), there would be an overall increase in bus delay with the project in both the 2018 Year of Opening and 2035 Design Year of approximately 5 percent and 7 percent, respectively (not including a small reduction at Columbia Street). 5 The greatest impact would be at Second Avenue an approximate increase of 40 and 52 seconds per vehicle in 2018 and 2035, respectively. Minimal impacts would be expected for streets intersecting the southern end of the alignment (S Jackson Street) because the LPA would not change traffic cycle lengths or signal priority along S Jackson Street. Table (2018) and Table (2035) summarize the analysis results. Additional details are provided in Appendix H1, Center City Connector Transportation Technical Report (Section ). Bus travel time measures were also calculated, weighted by passenger volumes, yielding changes in aggregate hours of bus passenger travel time. For the key impacts cited above, the estimated 17-second increase in travel time per bus along Stewart Street between Second and Third Avenues equates to an aggregate increase of approximately three daily hours of bus passenger delay. Crossing Stewart Street at Second Avenue, the 40-second increase in travel time per bus would equate to an aggregate of 400 hours of passenger delay. 6 However, decreases in bus travel time in other portions of the LPA would help balance these increases. Appendix H1 (Section ) provides details on these results. 5 In 2035, it is assumed that Link extensions would reduce regional bus volumes in downtown Seattle due to routes that are truncated outside of downtown, including some bus routes that currently travel in the DSTT. However, bus volumes are still assumed to increase due to buses displaced from the DSTT onto surface streets when the Link extensions open. 6 This analysis assumed that TSP would be implemented at many intersections along the alignment; however, SDOT is currently planning to coordinate signals instead of implementing TSP, which would likely result in lower delay to cross streets and reduced impacts. TBG SEA MARCH 2016 ENVIRONMENTAL ASSESSMENT PAGE
77 TRANSPORTATION Table Peak-Hour Bus Travel Time Comparison for LPA (No Build vs. Build), 2018, 5 6 p.m. 2018, PM Peak Hour Along Alignment d Bus Volumes a Bus Travel Time per Vehicle b Aggregate Bus Travel Time c Vehicles per Hour Seconds Hours No Build No Build LPA Change % Change No Build LPA Change % Change Southbound/Westbound % WB Stewart - Westlake to 2nd (varies by block) % % SB 1st - Madison to Marion % % Northbound/Eastbound % EB Stewart/Olive 3rd to 5th 4 46 (varies by block) % % NB 1st - Stewart to Pine % % Crossing Alignment e 2nd & Stewart - SB % % 3rd & Stewart - SB % % 3rd & Stewart - NB % % 4th & Stewart - NB % % 5th & Stewart - SB % % Columbia & 1st - WB % % Totals % Table Peak-Hour Bus Travel Time Comparison for LPA (No Build vs. Build), 2035, 5 6 p.m. 2035, PM Peak Hour Along Alignment d Bus Volumes a Bus Travel Time per Vehicle b Aggregate Bus Travel Time c Vehicles per Hour Seconds Hours No Build No Build LPA Change % Change No Build LPA Change % Change Southbound/Westbound % WB Stewart - Westlake to 2nd (varies by block) % % SB 1st - Madison to Marion % % Northbound/Eastbound % EB Stewart/Olive 3rd to 5th 4-39 (varies by block) % % NB 1st - Stewart to Pine % % Crossing Alignment e 2nd & Stewart - SB % % 3rd & Stewart - SB % % 3rd & Stewart - NB % % 4th & Stewart - NB % % 5th & Stewart - SB % % Columbia & 1st - WB % % Totals % TBG SEA MARCH 2016 ENVIRONMENTAL ASSESSMENT PAGE
78 TRANSPORTATION Notes for Tables and 4-1.7: NB = Northbound; EB = Eastbound; SB = Southbound; WB = Westbound a Fall 2014 bus volumes for King County Metro, Sound Transit, and Community Transit, after September 2014 service cuts, with preliminary assumptions for additional peak-hour service due to Proposition 1 (as of December 2014). b Travel times from VISSIM analysis. c On First Avenue, routes assumed to be eliminated or rerouted from First Avenue in the Build alternative (16, 66, 99, 113, 121, 123, and 125) are also excluded from the aggregate travel time calculations for the No Build Alternative. In 2035, buses currently using the transit tunnel that are not assumed to be truncated or eliminated (see Tables and 4-1.6) are assumed to use the surface streets these routes currently use when the transit tunnel is closed. These remaining routes are assumed to be 101,102,106,150, and 255. Routes 41, 71, 72, 73, 74, 76, 77, 216, 218, 219, 316, and 550 are assumed to be truncated or eliminated. d Along alignment includes Jackson from First Avenue to Occidental Avenue, First Avenue from Jackson Street to Stewart Street, and Stewart Street from First Avenue to Westlake Avenue, e Across alignment includes Stewart Street/Olive Way along Second, Third, Fourth, and Fifth Avenues, between approximately Pike Street - Virginia Street and Columbia Street between Second Avenue and Western Avenue. Volumes represent the maximum number of buses per hour along each cross-street segment. Electric Trolley Bus Electric Trolley Bus (ETBs) route 12 uses First Avenue as a turnaround between Madison and Marion Streets. In addition, First Avenue serves as a deadheading 7 corridor for King County Metro routes 4, 7, 10, 11, 43, 47, and 49. The LPA would affect ETB infrastructure, routing and service. The LPA would conflict with ETB or legacy trolley wires at 11 intersections along the alignment. These locations would require special crossing hardware and/or shifting of the ETB wires to allow movement of both the streetcar and ETB systems through the intersection. In addition, there are locations along the alignment where shifting the ETB wires would be required to maintain clearance with streetcar OCS, and existing ETB crossing would require shifting or replacement to accommodate new streetcar crossing hardware (see Table 4.1.8). If the LPA were fully wired throughout the alignment, it would result in 14 northbound and 13 southbound conflicts. By optimizing the wireless portions of the LPA, the number of conflicts would be reduced. Less hardware or wire shifting would be required, and capital costs for the LPA and maintenance costs for both ETB and Center City Connector would be reduced. Additional wireless operation segments may be evaluated in future project design phases, which could reduce the requirements for wire shifts and crossings. In any event, the LPA would not affect the ability for ETB routes (including 4, 7, 10, 11, 43, 47, and 49) to deadhead on First Avenue. The Center City Connector Transportation Technical Report (Appendix H1), Section , provides additional detail on ETB wire and deadhead routes and includes a technical memorandum, developed in coordination with King County Metro, that documents which wire and turns will be preserved to maintain King County Metro s ability to use First Avenue for ETB operations. 7 Deadheading means bus travel between the end of service on one route to the beginning of another without picking up passengers. TBG SEA MARCH 2016 ENVIRONMENTAL ASSESSMENT PAGE
79 TRANSPORTATION Table Streetcar and ETB OCS Conflicts by Intersection No. Intersection NB Crossings SB Crossings ETB Shift Required Existing ETB/ETB Crossings Complexity Rating 1 Westlake and Stewart 1 0 Yes No 2 2 3rd and Stewart 3 3 Yes Yes 8 3 2nd and Stewart 1 0 Yes No 2 4 1st and Stewart 2 3 Yes Yes 7 5 1st and Pine 1 1 Yes Yes 4 6 1st and Pike 1 1 Yes Yes 4 7 1st and Union a 1 1 Yes Yes 4 8 1st and Madison 1 1 Yes Yes 4 9 1st and Marion 1 1 Yes Yes st and Cherry b 1 1 Yes Yes st and Main 1 1 Yes No 3 Total 27 a ETB OCS maintained for emergency use. b ETB OCS not in use. Source: SDOT (2015a). Streetcar Operation and Ridership The LPA would provide a high level of transit service along exclusive, transit-only lanes; it would provide local circulation and would connect the South Lake Union and First Hill Streetcar lines together as one interconnected streetcar system, as described in Section Table details the streetcar planned operations with the LPA. The LPA is planned to operate with the South Lake Union and First Hill Streetcar lines, overlapping in a shared segment between the northern turnaround on Republican Street (or optionally at Westlake Station at Westlake and Sixth Avenue N) and a southern turnaround east of the station at Jackson Street and Seventh Avenue S (or optionally on Eighth Avenue south of Jackson Street). The individual lines would operate with approximately 10-minute peak and 15-minute off-peak headways, which would result in headways as short as 5 minutes in the area where these lines overlap. Based upon the transit service changes and using the latest land use information available from PSRC, streetcar ridership forecasts were projected for the 2018 and 2035 No Build Alternative and LPA. The ridership forecast was developed using the FTA-approved STOPS ridership model. A peer-based model was used to project additional visitor special market trips that are not fully captured in the STOPS model. Results of the streetcar ridership forecasts are shown in Table TBG SEA MARCH 2016 ENVIRONMENTAL ASSESSMENT PAGE
80 TRANSPORTATION Table Center City Connector Streetcar Operations Service Span Weekday Saturday Sunday/Holiday Service Span 5 a.m. 1 a.m. 5 a.m. 1 a.m. 6 a.m. 11 p.m. Daily Hours Headway (Individual Lines a ) Early Morning Day/Early Evening Later Evening 15 min (5 a.m. 6 a.m.) 10 min (6 a.m. 8 p.m.) 15 min (8 p.m. 1 a.m.) 15 min (5 a.m. 8 a.m.) 10 min (8 a.m. 8 p.m.) 15 min (8 p.m. 1 a.m.) 15 min (6 a.m. 8 a.m.) 10 min (8 a.m. 8 p.m.) 15 min (8 p.m. 11 p.m.) a First Hill to Republican Street in South Lake Union and South Lake Union to Eighth Avenue south of Jackson Street. Table Streetcar System Weekday Ridership Scenario No Build Streetcar System South Lake Union, First Hill a 6,700 8,400 11,200 Build Streetcar System not including Special Markets South Lake Union, First Hill, Center City Connector a 16,600 21,100 29,500 Build Streetcar System including Special Markets Visitors b 2,800 3,200 5,000 Total with Special Markets 19,400 24,300 34,500 a Source: FTA, 2015, Simplified Trips-on-Project Software. Version b Source: Seattle Center City Connector Transit Study, Detailed Evaluation Report, Appendix B: Other Rider Markets. Ridership is expected to be very strong in the LPA because the project would connect two previous streetcar projects: the South Lake Union Streetcar, which opened in 2007, and the First Hill Streetcar, which is projected to open in early With the LPA, the systemwide streetcar ridership would increase from approximately 8,400 daily boardings in the 2018 No Build condition to approximately 21,100 daily boardings by year Systemwide streetcar ridership would increase approximately from 11,200 in the 2035 No Build condition to 29,500 daily boardings by year Including the visitor special market, there would be approximately 24,300 daily boardings by year 2018 and about 34,500 boardings by There would be up to approximately 14,000 of these daily trips occurring by year 2018 and approximately 20,100 daily trips occurring by year 2035 within or through the Center City Connector Streetcar segment, not including the visitor special market. TBG SEA MARCH 2016 ENVIRONMENTAL ASSESSMENT PAGE
81 TRANSPORTATION The Center City Connector would be expected to generate high ridership at the project stations and increase ridership at existing South Lake Union Streetcar stations and the southern First Hill Streetcar stations. Figures and illustrate future daily streetcar passenger boardings and project trips (within or through the Center City Connector segment) by streetcar station under 2018 and 2035 conditions. In 2018, in addition to the Westlake Hub/McGraw Square station, three stops with the highest ridership in the streetcar network are new Center City Connector stops (First Avenue/Madison Street stop, Third/Fourth Avenue/Stewart Street stop, and Pioneer Square stop). Ridership would also be strong at the Westlake and Seventh and the Westlake/Terry and Thomas stations. In the 2035 LPA, the same general pattern would be observed but with substantial increases in ridership at several First Hill Streetcar line stations along Broadway, particularly at E Denny Way (future Link Light Rail stop) and at Marion Street. The majority of trips on the project are projected to be from riders currently using another transit option. This includes trips on the existing South Lake Union or First Hill Streetcar lines that use the new segment to travel into downtown, even though the trip would have been on a streetcar before the project. Riders may also come from other routes that provide service to/through downtown Seattle where the Center City Connector segment would improve the trip. For example, in the No Build Alternative, a transit trip from the south end of the downtown area to the South Lake Union area would have been possible on Link light rail with a transfer to the South Lake Union Streetcar or with a long walk from the Link Westlake Station. The LPA would allow this trip to be completed without a transfer or a long walk. Passenger Boarding Patterns The ridership model provides estimates of passenger boarding activity based on the access mode, including walking, transferring from other transit services, and park-and-ride/kiss-and-ride. About 60 percent of trips using an LPA station (between Fifth Avenue and S Jackson Street and Westlake Hub) would be projected to access the streetcar by walking; about 40 percent would be projected to transfer from other transit services. Due to the densely urbanized nature of the Center City Connector corridor, the project would not include additional parking facilities. Construction Impacts During construction, transit impacts along the corridor would include periodic detours of bus routes, relocation of bus stops when weekday and weekend intersection closures would affect bus stop locations, and relocation of ETB deadheading along First Avenue. Along First Avenue, construction would affect King County Metro buses 12, 16, 66, 99, 113, 121, 122, 123, and 125; with the exception of Route 12, all these routes have stops along First Avenue (see Table 4.1-3). Construction would also affect ETB routes 4, 7, 10, 11, 43, 47, and 49, which use First Avenue for deadheading. Buses crossing First Avenue (at Seneca and Columbia Streets) would also be affected by intersection closures. As described in Table 4.1-4, changes to routes 16 and 66 may occur in March 2016 related to opening of the University Link light rail extension. Other routes may also change depending on the timing of other projects. Along Stewart Street, construction would affect King County Metro Routes 25, 66, 70 (ETB route), 177, and 178, which operate along the LPA, along with Sound Transit and Community Transit routes (see Table 4.1-3, which identifies routes that serve the bus stop located west of Fourth Avenue). Construction along Stewart Street is expected to occur primarily on weekends, TBG SEA MARCH 2016 ENVIRONMENTAL ASSESSMENT PAGE


82 TRANSPORTATION Figure Future Daily Streetcar Boardings by Station, 2018 Figure Future Daily Streetcar Boardings by Station, 2035 Source: STOPS Ridership Model for Center City Connector Project, Rounded to nearest 10. Source: STOPS Ridership Model for Center City Connector Project, Rounded to nearest 10. TBG SEA MARCH 2016 ENVIRONMENTAL ASSESSMENT PAGE
83 TRANSPORTATION when bus volumes are lower and some commuter-oriented routes (including all Community Transit routes) do not operate. Routes that operate along Stewart Street when the DSTT is closed would also be affected during night construction times. Routes that cross Stewart Street (at First, Second, Third, Fourth, and/or Fifth Avenue) would also be affected by intersection closures. Short-term (evening hours) and/or weekend detours could be required for all routes operating in the corridor (see Table 4.1-3) and for routes that use portions of the corridor for deadheading. Detours could cause delays to buses and bus passengers. Temporarily closing or relocating stop locations would require signage and advance notification to assist bus riders with accessing a nearby stop and would minimize confusion and inconvenience to riders. Coordination with King County Metro, Sound Transit, and Community Transit will continue as the project advances to minimize bus service disruptions. In addition, construction activities around McGraw Square, including the proposed turnback track north of the station, could also affect the existing South Lake Union Streetcar service Arterials and Local Streets The primary roads in the study area are Westlake Avenue between Stewart and Mercer Street, Stewart Street/Olive Way between Westlake Avenue and First Avenue, First Avenue between S Jackson Street and Stewart Street, and S Jackson Street between First Avenue S and 8th Avenue S. Other roads parallel to First Avenue that were analyzed include Alaskan Way, Second Avenue, Fourth Avenue, and Fifth Avenue. Intersections operating at LOS E are considered to be at capacity; LOS F is over capacity and undesirable. For a more detailed description of all roads within the study area, see Appendix H1, Center City Connector Transportation Technical Report. In the future, local streets within the downtown central business district would have posted speed limits of 25 miles per hour (mph) (reduced from 30 mph in existing conditions) as part of SDOT s Vision Zero plan (City of Seattle, 2015). The PSRC travel demand forecast model estimates where traffic increases are expected to occur in 2018 and 2035, allowing modeling of the effects of potential traffic diversions on volumes and intersection performance. In 2014, only one intersection along the proposed streetcar alignment (First Avenue and Columbia Street) is operating at LOS F, while the rest operate at LOS D or better. All intersections along adjacent streets within the study area are operating at LOS D or better, with the exception of Second Avenue and Pike Street, which is operating at LOS E. Level of Service (LOS) Level of service is a qualitative measurement of intersection operation based on control delay. LOS is reported as letter grades A (low delay per vehicle) through F (very high delay per vehicle; could involve long queues). Demand volume Demand volume is the amount of vehicles in a given time period that is expected to occur on a roadway when not constrained by the capacity of the roadway. When demand exceeds the capacity of the road, some queueing will occur and the actual measured volume will be less than the demand. Demand volumes are typically an output from travel demand forecast models. TBG SEA MARCH 2016 ENVIRONMENTAL ASSESSMENT PAGE
84 TRANSPORTATION Impacts No Build Alternative Roadway Operations Figures and show intersection LOS results during the peak PM hour for the No Build Alternative and LPA for 2018 and 2035, respectively. Overall, auto demand volumes at intersections in the study area would increase by approximately 2.3 percent annually from the 2014 existing condition to the 2018 No Build Alternative and 1.3 percent annually by the year In the 2018, under the No Build Alternative, all study intersections along the LPA alignment of First Avenue and Stewart Street would operate at LOS C or better. The Alaskan Way Viaduct Replacement Project will increase the number of travel lanes on Alaskan Way and also remove the Alaskan Way Viaduct and the ramps that connect to First Avenue (including the southbound on-ramp at the intersection of First Avenue and Columbia Street and the northbound off-ramp at First Avenue and Seneca Street). This would reduce demand volume at nearby intersections on First Avenue at the 2018 year of opening. As a result, the intersection of First Avenue and Columbia Street would improve from LOS F in 2014 existing condition to LOS A in the 2018 No Build Alternative. All study intersections along other streets in the study area would operate at LOS D or better in the 2018 No Build Alternative. In the 2035 No Build Alternative, intersections along the streetcar alignment would operate at LOS D or better, with the exception of Westlake Avenue N and Republican Street. This intersection would operate at LOS F due to increased traffic volume. Study intersections on adjacent streets would operate at LOS C or better, with the exception of Alaskan Way and King Street, which would operate at LOS F. During sports events, an additional 13,000 to 15,000 vehicles can enter downtown Seattle, often during the PM peak period. 8 Event organizers for both Century Link Field and Safeco Field implement Transportation Management Plans (TMPs) that encourage the use of transit for game attendance. During these peak events, SDOT works with special event representatives to promote use of the streetcar, other transit, and remote parking facilities to access special event venues. No change is expected under the No Build Alternative. Vehicle and Person Throughput Vehicle and person throughput were measured at three east-west screenlines across First Avenue to compare the No Build Alternative and the LPA during the evening peak hour. A screenline is an area along an imaginary line where traffic data is counted or modeled and indicates the volume of traffic entering or leaving a particular area. Each screenline in the study area reflects varying number of lanes on north-south roads (including First Avenue), 8 Adapted from the 2012, Seattle Arena, Multimodal Transportation Access and Parking Study. Typical weekday game start times are between 7 and 7:30 pm. and can reach attendance of up to 50,000 fans. Of those 50,000, approximately 80 percent travel by automobile. Assuming 300 vehicles per 1,000 attendees, an additional 13,000 to 15,000 vehicles can enter the City. In addition, most attendees come downtown 2 hours before game time many during the PM peak period. TBG SEA MARCH 2016 ENVIRONMENTAL ASSESSMENT PAGE

85 TRANSPORTATION Figure No Build Alternative and LPA Intersection LOS, PM Peak TBG SEA MARCH 2016 ENVIRONMENTAL ASSESSMENT PAGE
86 TRANSPORTATION Figure No Build Alternative and LPA Intersection LOS, PM Peak TBG SEA MARCH 2016 ENVIRONMENTAL ASSESSMENT PAGE
87 TRANSPORTATION destinations, and different traffic movements. The screenlines were created to measure the total traffic volume moving both north and southbound across sections of the study area. As can be seen, the screenline areas are not the same, and therefore the volumes at these screenlines do not equal each other. All vehicles that would travel along First Avenue (autos, trucks, buses, and streetcars) for one PM peak hour period were considered. Table lists vehicle and person throughput comparisons for 2018 and In 2014, vehicles per hour range between approximately 1,000 and 1,420 and people per hour between 1,620 and 2,000. By 2018, approximate vehicle throughput would increase by between 60 and 350 vehicles, and by 2035, throughput would increase by between approximately 210 and 600 vehicles in the No Build Alternative compared to 2014 Existing Conditions, depending which portion of First Avenue is measured. Similarly, for person throughput, the increase would be up to approximately 520 persons by 2018 and up to 950 people by Travel Time Compared to 2014 existing conditions for the PM peak hour period, auto travel times in 2018 No Build Alternative would be about 3 minutes longer northbound and 1 minute shorter southbound. The anomaly in southbound travel time reported in the existing condition was due to short-term construction work along First Avenue at the Spring Street intersection (which included a temporary southbound lane closure) while collecting data. The existing travel time is therefore longer than typical conditions. In addition, southbound traffic volumes would be lower on First Avenue for the 2018 No Build Alternative with the removal of the Alaskan Way Viaduct southbound on-ramp at Columbia Street. In 2035, the northbound No Build Alternative auto travel times would be similar to 2014 Existing and 2018 No Build Alternatives, but by 2035, due to congestion, the southbound No Build Alternative would increase from approximately 6.3 minutes to 7.6 minutes. Figures and present travel time comparisons for 2018 and Traffic Safety Collision data for the 5-year period between November 2009 and October 2014 show that none of the signalized intersections along the alignment has more than 10 crashes per year, and the one unsignalized intersection at 10th Avenue S and S Jackson Street does not exceed 5 crashes per year. Therefore, none of the intersections along the alignment are designated as a high accident location (HAL) by the City of Seattle. Throughput The number of people or vehicles that cross a location in the PM peak hour. High accident location HAL is defined by the City of Seattle as having 10 or more crashes per year at a signalized intersection and 5 or more crashes per year at an unsignalized intersection. There would be no change in the intersections, access points (driveways), or operations, other than slightly higher volumes of vehicles moving slower under the No Build Alternative. Therefore, no changes in collision rates or types of accidents are expected. TBG SEA MARCH 2016 ENVIRONMENTAL ASSESSMENT PAGE
88 TRANSPORTATION Table and 2035 PM Peak Hour Vehicle and Person Throughput First Avenue Screenline Mode No Build Alternative LPA No Build Alternative LPA Vehicles Persons Vehicles Persons % Diff Persons Vehicles Persons Vehicles Persons % Diff Persons Screenline #1 (Between Pine and Pike Streets) Auto/ Truck 1,470 1, ,190-39% 1,750 2, ,270-45% Bus N/A N/A Streetcar ,260 N/A ,100 N/A Total 1,470 2, , % 1,750 2, , % Screenline #2 (Between Seneca and Spring Streets) Auto/ Truck 1,630 2, ,010-53% 1,890 2, ,140-54% Bus N/A n/a Streetcar ,370 N/A ,170 n/a Total 1,640 2, ,380-5% 1,900 2, , % Screenline #3 (Between Main and Jackson Streets) Auto/ Truck 1,130 1,500 1,080 1,430-5% 1,190 1,580 1,170 1,540-2% Bus N/A N/A Streetcar N/A ,150 N/A Total 1,140 1,890 1,100 2, % 1,200 2,090 1,190 2, % Average of All Screenlines Total 1,420 2, ,320 +9% 1,620 2,480 1,020 3, % Notes: Screenline locations are shown previously in Figure Throughput volumes at screenlines include the total of both directions on First Avenue. Auto includes passenger cars and trucks. Total volume is rounded to the nearest 10 vehicles. No bus routes are assumed to provide revenue service along First Avenue with the LPA. N/A = Comparison for this mode is not applicable for the No Build Alternative and the LPA. TBG SEA MARCH 2016 ENVIRONMENTAL ASSESSMENT PAGE
89 TRANSPORTATION Locally Preferred Alternative Operational Impacts Roadway Operations Conceptual design drawings of the LPA are presented in Appendix G of this Environmental Assessment. With the Center City Connector project, the streetcar would operate in exclusive transit lanes for nearly the full length of the project and assumed to use TSP treatments at most signalized intersections. This represents the best travel time for vehicles along the LPA corridor, but potentially the worst delays for cross-traffic movements. As the project advances further into design, TSP strategies will continue to be evaluated, including its application at specific intersection locations. 9 TSP was assumed at most intersections along the streetcar route to evaluate associated impacts on connecting roadways. Roadway and traffic signal modifications with the project along First Avenue, Stewart Street, and S Jackson Street are described previously in Chapter 3. First Avenue would contain two southbound and two northbound general purpose lanes between Stewart Street and Yesler Way under the No Build Alternative (with a third northbound lane available during the PM peak period when parking is restricted). By comparison, under the LPA, First Avenue would be reduced to one general purpose lane in each direction in this segment. Between Yesler Way and S Jackson Street, First Avenue contains only one general purpose lane in each direction at all time periods except the AM peak period in the No Build Alternative (as parking is allowed in the curb lane during all hours except the AM peak period). This is the same number of travel lanes the LPA would have. In the No Build Alternative, left-turn movements on First Avenue generally occur from a shared lane with through movements (except for left-turn pockets provided northbound at Columbia Street and southbound at Cherry and Jackson Streets). The LPA would only restrict northbound left turns at Columbia and Pine Streets, but all other northbound left turns would remain open. The LPA would provide two northbound and three southbound left-turn pockets (northbound at Pike and Madison Streets and southbound at University, Spring and Jackson Streets). Vehicle traffic (demand volumes) across three east-west screenlines (as shown on Figure 4.1-1) was compared between the No Build Alternative and LPA to analyze the effect of reducing the number of lanes on First Avenue and the potential diversion of traffic to other streets that would result. For example, if the forecast model predicts that demand volumes on First Avenue would decrease from the No Build Alternative to the LPA because of fewer lanes and that demand volumes on adjacent north-south streets would increase, this would indicate that trips are diverting away from First Avenue. Table presents demand volumes along the three 9 SDOT is currently planning to coordinate signals instead of implementing TSP, which would result in less delay to cross streets and reduced impacts while still maintaining reliable travel time for streetcars. The Next Generation ITS Center City Center Connector (CCC) Streetcar VISSIM Analysis Draft Report (DKS Associates, 2015), which is included as Appendix F of the Transportation Technical Report (see Appendix H1), evaluates streetcar and auto travel times along the LPA, examining coordinated signal timing progression and a reduced number of TSP sites at select locations required to support exclusive transit turning phases. TBG SEA MARCH 2016 ENVIRONMENTAL ASSESSMENT PAGE
90 TRANSPORTATION Table No Build Alternative vs. LPA (2018 and 2035) Screenline Traffic Volume Forecast Comparison, PM Peak Hour Screen Line Roads Arterials west of 1st Ave No Build LPA % Diff No Build LPA % Diff 3,360 3, ,890 4, SR 99 Tunnel 6,320 6, ,250 7, #1 South of Pine Street 1st Ave 1, ,070 1, Arterials east of 1st Ave 4,470 4, ,220 9, I-5 18,600 18, ,180 19, All Roads Combined Arterials west of 1st Ave 34,160 33, ,340 36, ,210 3, ,710 3, SR 99 Tunnel 6,320 6, ,250 7, #2 South of Seneca Street 1st Ave 1, ,070 1, Arterials east of 1st Ave 4,960 5, ,280 9, I-5 17,620 17, ,190 18, All Roads Combined Arterials west of 1st Ave 33,900 33, ,790 36, ,790 3, ,530 4, SR 99 Tunnel 6,320 6, ,250 7, #3 South of S Main Street 1st Ave 1,160 1, ,260 1, Arterials east of 1st Ave 4,920 4, ,840 10, I-5 21,650 21, ,510 22, All Roads Combined 37,840 37, ,860 41, Notes: Volumes are for both northbound and southbound directions combined and are for 1 hour in the PM Peak. Arterials west of First Avenue include Alaskan Way and Western Avenue. Arterials east of First Avenue include Second Avenue, Fourth Avenue, Fifth Avenue, and Sixth Avenues. TBG SEA MARCH 2016 ENVIRONMENTAL ASSESSMENT PAGE
91 TRANSPORTATION screenlines in the years 2018 and 2035 for both the No Build Alternative and LPA. The amount of traffic diversion from First Avenue would vary depending on the street block location and how many lanes would be reduced in the LPA compared to the No Build Alternative. Demand volumes on First Avenue are predicted to drop up to approximately 50 percent at screenlines #1 (south of Pine Street) and #2 (south of Seneca Street) with the LPA compared with the No Build Alternative in both 2018 and 2035 because the reduction in the number of lanes on First Avenue would cause those trips to divert to other north-south streets. Demand volumes on other streets west and east of First Avenue across screenlines #1 and #2 would increase (up to approximately 6 percent) because some trips that used to use First Avenue would divert to other north-south streets. Demand volumes along screenline #3 (south of Main Street) would result in only an approximately 4 percent drop in traffic volume with the project as compared to the other two screenlines because the number of lanes on First Avenue during the PM peak period is the same as the No Build Alternative. Compared to the No Build Alternative, the reduction in lanes on First Avenue and traffic diversions associated with the LPA in 2018 and 2035 would increase the average delay at study area intersections (including both those along the LPA alignment and adjacent streets) by approximately 17 percent and 25 percent (about an additional 2 and 5 seconds per vehicle at each intersection), respectively. The increase in average delay would be longer at intersections along the LPA alignment compared to intersections on adjacent streets, because average intersection delay in the 2018 year of opening would increase by approximately 26 percent (from about 13 to 17 seconds per vehicle) in the LPA compared to the No Build Alternative. Despite the increase in delay caused by the LPA, intersection LOS for intersections along the LPA alignment would be no worse than LOS C for both the No Build Alternative and LPA. Adjacent streets (Alaskan Way and Second, Fourth, and Fifth Avenues) would experience a slight increase in volume and intersection delay (from approximately 16 to 18 seconds per vehicle on average), but no intersection is expected to operate at worse than LOS D in both the No Build Alternative and LPA. No study intersections would operate at LOS E or F in the 2018 year of opening. In 2035, with the LPA, all intersections along the alignment would operate at LOS D or better with the exception of First Avenue and S Jackson Street (LOS E) and Westlake Avenue N and Republican Street (LOS F). First Avenue and S Jackson Street would degrade from LOS B in the No Build Alternative to LOS E with the LPA due to the addition of a protected southbound leftturn phase and an exclusive streetcar signal phase. Westlake Avenue N and Republican Street would operate at LOS F in the No Build Alternative but would see an increase in delay with the LPA due to the addition of an exclusive streetcar phase. Average delay at intersections along the alignment in 2035 would increase by approximately 40 percent (from about 18 to 26 seconds per vehicle) in the LPA compared to the No Build Alternative. All intersections on streets adjacent to the streetcar would operate at LOS D or better in the 2035 LPA with the exception of Second Avenue and Spring Street (LOS E), and Alaskan Way and King Street (LOS F). Second Avenue and Spring Street, which would operate at LOS C in the No Build Alternative, would drop to LOS E with the LPA because of an increase in traffic volume due to the restriction of southbound left turns at First Avenue and Cherry Street with the LPA. The Alaskan Way and King Street intersection would operate at LOS F in both the 2035 No Build and 2035 LPA, although delay decreases by a few seconds in the LPA due to traffic shifting to movements that TBG SEA MARCH 2016 ENVIRONMENTAL ASSESSMENT PAGE
92 TRANSPORTATION have smaller delays. Average delay at intersections on adjacent streets would increase by approximately 13 percent (from about 19 to 21 seconds per vehicle). The Center City Connector Streetcar would provide another alternative to driving to large events in the stadium area of south Seattle. The streetcar would provide additional person-carrying capacity on First Avenue, even though the roadway would have two fewer general purpose travel lanes. Operation of the Center City Connector would potentially reduce game traffic by providing another transit option to fans traveling through the downtown corridor. SDOT works with special event representatives to promote use of the streetcar, other transit, and remote parking facilities to access special event venues. During events, operations of the streetcar may be adapted through the use of turnback tracks to provide more service and avoid congested areas and to prevent delays on service to other areas of Seattle. Vehicle and Person Throughput In 2018, vehicle throughput in First Avenue would decrease between approximately 4 percent and 52 percent with the project, as shown previously in Table , because the project eliminates two auto lanes on First Avenue. However, the person throughput with the LPA would increase at two of the three screenlines between 13 percent and 23 percent, with the average of all three screenlines increasing by approximately 9 percent. This is because the forecast streetcar ridership would exceed person throughput in the auto travel lane under the No Build Alternative. This also means that there would be fewer vehicle trips in downtown Seattle with the LPA. Moving more people in fewer vehicles indicates that the project would move people more efficiently along First Avenue. The screenline between Seneca and Spring Streets would see a slight decrease in person throughput of approximately 5 percent because this location would experience a higher drop in auto volume compared to the other two screenlines. Vehicle throughput in the year 2035 on First Avenue would decrease between 1 percent and 53 percent with the LPA, but person throughput would be higher at all three screenlines, ranging between 12 percent and 42 percent more than the No Build Alternative. Travel Time Figures and show auto and streetcar travel time results for years 2018 and 2035, respectively. Auto travel times along First Avenue would be similar or slightly improved with the LPA than under the No Build Alternative for the 2018 opening year. This is because the signal timing on First Avenue in the LPA would provide slightly more green time for northbound-southbound streetcar movements, which would also benefit autos traveling in the same direction. Travel time for the 2035 LPA along First Avenue would be similar but slightly longer than the 2035 No Build Alternative. Travel time for autos on Stewart Street between First Avenue and Westlake Avenue would be slightly longer (up to approximately 0.5 minute) with the LPA compared to the No Build Alternative in both 2018 and There are two areas where the LPA would overlap with current streetcar lines: Jackson Street between Occidental Avenue and Eighth Avenue S (where the First Hill Streetcar will begin service in 2015); and Westlake Avenue/Terry Avenue between Stewart Street and Republican Street. Future auto and streetcar travel times along S Jackson Street and Westlake Avenue/Terry TBG SEA MARCH 2016 ENVIRONMENTAL ASSESSMENT PAGE
93 TRANSPORTATION Figure No Build Alternative and LPA Travel Time (by mode) TBG SEA MARCH 2016 ENVIRONMENTAL ASSESSMENT PAGE
")
94 TRANSPORTATION Figure No Build Alternative and LPA Travel Time (by mode) TBG SEA MARCH 2016 ENVIRONMENTAL ASSESSMENT PAGE
95 TRANSPORTATION Avenue would generally be the same for the No Build Alternative and the LPA because there would be no changes to signal operation or roadway configuration with the project. The average (both directions) streetcar travel time in year 2018 between the intersections of First Avenue and S Jackson Street, and Fifth Avenue and Stewart Street, would be 8.1 minutes. The length of this trip is approximately 1.1 miles, which would equate to an average streetcar speed of 8 mph. This speed includes station dwell time and delays at intersections. The streetcar travel time would be the same with the 2035 LPA, at approximately 8.1 minutes. The streetcar travel time includes dwell time at four streetcar stations: Pioneer Square, Madison, Pike, and Third/Fourth Avenues on Stewart Street. Streetcar travel times described in this section are meant to provide a relative comparison between streetcar and auto travel. Traffic Safety The introduction of a new travel mode to a corridor has the potential to create another point of conflict. This safety analysis is based on historical collision records along the proposed streetcar alignment and evaluates the change in auto movements across the streetcar alignment. Because the streetcar would travel in an exclusive lane for the majority of the LPA alignment, the safety impacts of the project would be minimal. Signing and pavement treatments are proposed along the streetcar alignment to visually indicate the streetcar to the public. Leftturning movements along First Avenue would be modified to locations that have the ability to provide a dedicated left-turn pocket, and the signal phase for these movements would be protected to minimize conflicts with the streetcar. Along the alignment where the streetcar would turn, such as the intersections of First Avenue and Jackson Street, and First Avenue and Stewart Street, the streetcar would travel through the intersection in an exclusive signal phase to minimize conflicts with autos, pedestrians, and bicyclists. Along some segments of Stewart Street, the streetcar would travel in the same lane as general traffic, but it is expected to operate in a similar fashion to autos and travel at similar speeds. Of the seven driveways along First Avenue, five currently have full access (left and right turns allowed). With the project, left-turns at these driveways would be eliminated to minimize the number of vehicles crossing the streetcar alignment. Eliminating left turns at those driveways would require signage and striping to modify access to right-in/right-out movements. Table presents the location of driveways along the LPA alignment and the new turn restrictions that would occur with the LPA compared to the No Build Alternative. With the project, the First Avenue curb lanes would remain open to traffic, but driveways would only provide right-in/right-out access, minimizing vehicles crossing the streetcar tracks. Left turns would be eliminated at six of the eight driveways on First Avenue with the LPA. The two remaining driveways on First Avenue would remain unchanged with the project because a center median already restricted those driveways to right-in/right-out movements in the No Build Alternative. TBG SEA MARCH 2016 ENVIRONMENTAL ASSESSMENT PAGE
96 TRANSPORTATION Table Driveway Turn Restrictions with LPA Street Block Street Side No. of Driveways and Type Driveway Turn Restrictions with LPA (compared to No Build Alternative) Pine to Pike East 1 - Parking All lefts eliminated Pike to Union East 1 - Parking All lefts eliminated Seneca to Spring East 1 - Parking All lefts eliminated 1st Ave Marion to Columbia Columbia to Cherry East 1 - Parking All lefts eliminated West 1 - Parking All lefts eliminated East 1 - Parking All lefts eliminated Cherry to Yesler Way West 1 - Parking None a Main to Jackson West 1 - Parking None 1st to 2nd Ave North South 1 - Parking 1 - Alleyway 1 - Alleyway Outbound Lefts Restricted Inbound Lefts/Outbound Rights Restricted Stewart Street 2nd to 3rd Ave 4th to 5th Ave North 1 - Alleyway Outbound Lefts Restricted South North 1 - Parking 1 - Alleyway 1 - Parking 1 - Alleyway Parking Garage: Outbound Lefts Restricted Alleyway: None None a There would be no change because these blocks contain a median which already prevents left turns. There are eight driveways along the LPA alignment on Stewart Street. All provide access to oneway streets in the No Build Alternative, except for the parking garage on the south side of Stewart Street between Second and Third Avenues, which provides access to westbound Stewart Street and eastbound Olive Way. Some left-turn restrictions would be required with the LPA at driveways between First and Third Avenues where the eastbound contra-flow streetcar lane would create a potential mixed lane and allow for new movements that are not possible in the No Build Alternative. For example, the southside driveway between First and Second Avenues with left-in/left-out access in the No Build Alternative would need to be right-out restricted to maintain the exclusive streetcar lane. The parking garage driveway on the south side of Stewart Street between Second and Third Avenues would allow left turns in from the westbound streetcar lane, making this half-block segment a mixed lane so that full access to the parking garage can be maintained. Currently, approximately 14 left-turn movements are allowed at intersections along First Avenue, as indicated in Table There are six left-turn movements at intersections that would be allowed in the No Build Alternative that would be restricted in the LPA, with four of those locations in the northbound direction. These are provided only where ample right-of-way is TBG SEA MARCH 2016 ENVIRONMENTAL ASSESSMENT PAGE
97 TRANSPORTATION available without requiring to narrow sidewalks. Appendix G of the EA provides drawings and lane channelization for each of these intersections. Most of those locations have low forecasted demand volumes (less than approximately 50 vehicles per hour) compared to other turn movements, with the exception of First Avenue and Cherry Street. Therefore, the circulation impacts of the left turn restrictions with the project would be expected to be minimal because protected left-turn pockets are still provided at eight locations along First Avenue between Stewart and Dearborn Streets. At these locations, the left turns would have a dedicated lane and would have a protected signal phase. Appendix G provides drawings and lane channelization for each of these intersections. In addition, the downtown Seattle street grid provides drivers several alternative paths to reach their destinations. There are no proposed changes to left-turn intersection movements on Stewart Street, Olive Way, or S Jackson Street and along either of the north or south turnback tracks areas. Table Future First Avenue Intersection Left-Turn Treatments Cross Street Left Turn Allowed? Northbound Left-Turn Treatment Southbound Left-Turn Treatment No Build LPA No Build LPA Shared or Exclusive Lane? Left Turn Allowed? Shared or Exclusive Lane? Left Turn Allowed? Shared or Exclusive Lane? Left Turn Allowed? Stewart Allowed Shared Eliminated NA NA Pine Allowed Shared Eliminated NA NA Shared or Exclusive Lane? Pike Allowed Shared Allowed Exclusive Not allowed Not Allowed Union Allowed Shared Eliminated Not allowed Not Allowed University NA NA Allowed Shared Allowed Exclusive Seneca NA NA Not allowed Not allowed Spring NA NA Allowed Shared Allowed Exclusive Madison Allowed Shared Allowed Exclusive NA NA Marion NA NA Allowed Shared Eliminated Columbia Allowed Exclusive Eliminated Not allowed Not allowed Cherry NA NA Allowed Exclusive Eliminated Yesler Not allowed Not allowed Not allowed Not allowed Washington Not allowed Not allowed Not allowed Not allowed Main Not allowed Not allowed Not allowed Not allowed Jackson Allowed Exclusive Allowed Exclusive Allowed Exclusive Allowed Exclusive King Allowed Exclusive Allowed Exclusive Not allowed Not allowed Dearborn Allowed Exclusive Allowed Exclusive Not allowed Not allowed Notes: NA = not applicable; the left turn movement is not possible because of the one-way street network. Allowed = left-turn movement is possible and allowed; Not Allowed = left-turn movement is possible but restricted in the No Build Alternative and the LPA; Eliminated = left-turn movement is eliminated because of the LPA; Shared = left-turn movement is accommodated from shared left-through lane; Exclusive = left-turn movement is accommodated from exclusive left-turn lane. TBG SEA MARCH 2016 ENVIRONMENTAL ASSESSMENT PAGE
98 TRANSPORTATION Construction Impacts Construction of the Center City Connector would take place during a contiguous and defined construction period. As described in Section 3.4.1, construction would be separated into four physical work segments, Segment 1 (Pioneer Square), Segment 2 (Madison Office Core), Segment 3 (Pike Place Market), and Segment 4 (Westlake Connection). Segment 1 (Pioneer Square) Streetcar construction in Segment 1 would occur along First Avenue between S Jackson Street and Columbia Street. Two lanes of traffic would be maintained through the work area. During construction of Segment 1, southbound traffic on First Avenue would be maintained while the northbound direction would be closed and traffic detoured. The southbound traffic would run on side of the street opposite of where road construction activities are occurring where a median would separate traffic from construction. S Washington Street and S Main Street would remain open during construction. Cross streets at intersections would remain open during weekdays. The proposed detour route for northbound traffic currently on First Avenue is Alaskan Way via either Railroad Way S or S King Street returning to First Avenue at Marion Street. Northbound vehicles destined for Cherry Street eastbound and the I-5 northbound express lane on-ramp could access from Yesler Way and an eastbound left turn at First Avenue. Depending on the conditions, drivers may choose other detour routes to avoid the construction area. These routes include the Alaskan Way Viaduct (for which vehicles could use either the Seneca Street off-ramp or Western Avenue off-ramp to return onto city streets) or Fourth Avenue. An analysis of the PM peak hour traffic conditions during construction (assuming 2017 traffic volumes) was conducted to assess the impacts of drivers using the Alaskan Way detour route. The analysis assumed that the Seawall Replacement project would be complete and would restore Alaskan Way to its original four- to five-lane configuration between S Washington Street and Union Street (including a northbound ferry ingress lane at Yesler Way) by mid-2016 and the SR 99 Viaduct would still be open. (See Chapter 5, Cumulative Impacts for additional construction scenarios in combination with reasonably foreseeable future actions that may affect construction detours for this segment.) Intersections along the detour route would see increased delays, with average intersection delays expected to increase by approximately 55 percent (from about 11 to 17 seconds per vehicle) during the Segment 1 construction. This would result in mostly LOS C or better operations along Alaskan Way, although Alaskan Way and Main Street would operate at LOS D. The intersections of First Avenue and Railroad Way, and First Avenue and Marion Street, where trips are changing off of and onto First Avenue to access the detour would also see a slight increase in delay but would operate no worse than LOS C during the detour. Coordination with nearby construction projects such as the Seawall Replacement project, Washington State Ferries Seattle Terminal at Colman Dock project, Alaskan Way Viaduct Replacement project, and Seattle Central Waterfront Program will be required during the construction of the Center City Connector. Congestion along First Avenue and other local streets during construction of the Center City Connector would make it more difficult to accommodate peak demands caused by large events at Century Link Field and Safeco Field. This may be particularly true during construction in the Pioneer Square segment. SDOT continues to emphasize alternatives to automobile access to TBG SEA MARCH 2016 ENVIRONMENTAL ASSESSMENT PAGE
99 TRANSPORTATION events; however, before Center City Connector is operational, increased congestion during events is expected. Segment 2 (Madison Office Core) and Segment 3 (Pike Place Market) Streetcar construction along Segment 2 would occur on First Avenue between Columbia Street and Union Street; for Segment 3, it would occur between Union Street and Stewart Street. The longest section of continuous closure in either segment would be four blocks at a time, when two work zones have simultaneous active construction. One lane would remain open in each direction during construction; therefore, no detour is proposed in Segments 2 or 3. Cross streets at intersections would remain open during weekdays. Construction impacts along Segments 2 or 3 would generally be similar to the 2018 LPA, which also assumes a two-lane cross section of First Avenue. Construction in Segment 2 is anticipated to take approximately 6 months; Segment 3 is anticipated to take between 5 and 6 months. Segment 4 (Westlake Connection) Streetcar construction in Segment 4 would occur along Stewart Street, between Second Avenue and Westlake Avenue. Construction in Segment 4 would only occur during nights and weekends, so there would not be any impact on weekday peak hour traffic conditions. It is anticipated that multiple weekends would be required to complete work in Segment 4. Construction in Segment 4 could take place at various times over the 12 to 24 months of construction for the other three segments Freight Existing and future roadways in the study area identified by SDOT as Major Truck Routes include I-5, SR 99, and Alaskan Way S. SR 99 and Alaskan Way S provide access to the Port of Seattle, which is a major regional freight operation Impacts No Build Alternative As reviewed in Section 4.1.1, Regional Facilities and Travel, regional traffic is expected to grow approximately 1.3 percent annually between 2014 Existing and 2035 design year. A small portion of this traffic would be an increase in freight traffic. Aside from the Alaskan Way Viaduct Replacement project and the Central Waterfront project s reconstruction of Alaskan Way, which are assumed to be complete by the year of opening of the CCC project, no change in the regional systems, beyond projected growth, are expected that would affect freight movements in the study area. Locally Preferred Alternative Operational Impacts The LPA is not expected to change the truck route designations on the street network. Some of the streets parallel to First Avenue (including Alaskan Way/SR 519) would experience slight TBG SEA MARCH 2016 ENVIRONMENTAL ASSESSMENT PAGE
100 TRANSPORTATION increases in traffic volumes with the diversion expected from First Avenue with the LPA, compared to the No Build Alternative. Traffic volumes on Alaskan Way would be expected to increase up to approximately 6 percent with the LPA at screenlines south of Seneca Street and south of Pine Street but would not be expected to change in the screenline south of S Main Street, because First Avenue would not see any change in capacity in this area. However, intersection operations are expected to operate similar for the No Build Alternative and LPA. Construction Impacts Construction in Segment 1(Pioneer Square) would cause an increase in average intersection delay along the detour route of Alaskan Way, but most intersections would operate at LOS C or better, with the exception of Alaskan Way and Main Street that would operate at LOS D. All other construction segments on First Avenue would maintain at least one lane of traffic in each direction and would have impacts similar to the 2018 LPA. (See Chapter 5, Cumulative Impacts for additional construction scenarios in combination with reasonably foreseeable future actions that may affect construction detours for this segment.) Non-motorized Facilities Pedestrian Scramble Phased Crossings These crossings permit pedestrians to cross in all directions simultaneously. This signal phasing strategy helps effectively manage high pedestrian volume locations. Along First Avenue, scramble crossing are located at Pike Street, Cherry Street, and University Street. In general, the more densely developed an area is, the more convenient it is for pedestrians and bicycles to be a viable alternative to driving. The City of Seattle has implemented many measures to encourage non-motorized travel. Most recently, protected bicycle lanes were installed on portions of Second Avenue and along Pine Street. Sidewalk is provided on all streets in the study area, with a typical sidewalk width of approximately 12 to 20 feet along First Avenue. This adequately accommodates the greater pedestrian volumes that are characteristic of downtown. Sidewalk conditions were evaluated based on a City of Seattle sidewalk survey that assigned a rating of good, fair, or poor to individual block faces, based on the condition of the surface, surface material, and sidewalk width. Figure highlights the sidewalk condition for the streets providing immediate pedestrian access to the streetcar, and it identifies street segments with challenging grades of approximately 9 percent or more. Sidewalk cracks exist adjacent to the proposed streetcar line on Stewart Street between First Avenue and Second Avenue and Olive Way between Fourth Avenue and Fifth Avenue, otherwise sidewalk conditions are rated good or fair. Signalized intersections use standard pedestrian walking man signal heads that operate on a fixed signal timing schedule. Pedestrian scramble phase crossings that allow pedestrians to cross in all directions simultaneously are located on First Avenue at Pike Street, Cherry Street, and University Street. This phasing strategy would help effectively manage high volumes of pedestrian activity. Marked crosswalks at all signalized intersections use high-visibility continental-style markings. There are no mid-block crossings along the proposed streetcar alignment. First Avenue is not signed as a bike route, but the existing bikeway network has been expanding in downtown Seattle with the recently constructed Second Avenue protected bike lane between TBG SEA MARCH 2016 ENVIRONMENTAL ASSESSMENT PAGE


101 TRANSPORTATION Figure Existing Pedestrian Facility Condition along LPA TBG SEA MARCH 2016 ENVIRONMENTAL ASSESSMENT PAGE


102 TRANSPORTATION Figure Existing and Proposed Bicycle Facilities TBG SEA MARCH 2016 ENVIRONMENTAL ASSESSMENT PAGE
103 TRANSPORTATION Pike Street and Yesler Way. This bike lane provides bicyclists of all ages and abilities a more convenient, safe, and comfortable facility to ride to downtown destinations. Otherwise, the majority of on-street bikeways in the study area are shared lanes with markings (i.e., sharrows) that do not provide separation from motor vehicle traffic. Figure provides a map of existing and proposed bicycle facilities, as specified in the City of Seattle Bicycle Master Plan and subsequent Implementation Plan (SDOT, 2014a,b). An onboard survey of riders on the existing South Lake Union Streetcar and King County Metro Route 99 in June 2013 showed that a very limited number of riders (.002 percent) access the streetcar by bike; 2 percent of Bus Route 99 riders access the bus by bike Impacts No Build Alternative The pedestrian conditions under the future No Build Alternative would be similar if not slightly improved compared to the existing pedestrian environment. The on-street bikeways planned (see Figure ) for future implementation in downtown Seattle would improve bicycle travel and safety of bicyclists. Locally Preferred Alternative Operational Impacts Sharrows A travel lane that is shared by motor vehicles and bicycles. Although bicyclists typically share travel lanes, a sharrow is usually signed to remind drivers to share the roadway. Pedestrian Under the LPA, pedestrian conditions would be similar or improved to accommodate the increased pedestrian volumes at and near the stations. The LPA station designs would implement universal design practices at the station to provide accessible pedestrian access compliant with the Americans with Disabilities Act (ADA).The Center City Connector project will upgrade sidewalks along the alignment to meet ADA standards and upgrade sidewalks near the station entrances to meet or exceed existing Seattle Right-of-Way Improvement Manual (SDOT, 2012) standards. This would enhance the existing pedestrian environment and improve the overall appearance of the street for all roadway users. The project would also be compliant with the ADA, which may require modifications at some intersections to include access ramps and visual tactile strips. SDOT s Sidewalk Accessibility Program funds the installation of 200 to 300 curb ramps each year, based on citizen requests and priority locations. The City published a Curb Ramp Installation Policies and Transition Plan in 2005 (SDOT, 2005) and revisited the transition plan as part of the Seattle Pedestrian Master Plan in 2009 (SDOT, 2009). SDOT is working to upgrade curb ramps to comply with the latest ADA standards. In June 2015, SDOT began an assessment of the 21,000 existing curb ramps to help determine priorities for improvement and to update the Seattle Curb Ramp Implementation Plan over the next year (SDOT, 2015). TBG SEA MARCH 2016 ENVIRONMENTAL ASSESSMENT PAGE
104 TRANSPORTATION The LPA aligns with the City of Seattle Complete Streets (Ordinance ; SDOT, 2007) policy by effectively accommodating multimodal travel along the corridor. Bicycle and pedestrian facilities will be integrated with the streetcar to accommodate the expected increase in people walking and bicycling through the corridor and accessing the stations. Pedestrian travel patterns may adjust in response to streetcar station locations. The intersections identified in Table would have a higher number of pedestrians under the LPA than under the No Build Alternative. The current pedestrian network has enough capacity to meet the current demand (based on, for example, sidewalk widths and conditions and pedestrian scramble signals at three intersections). Under the LPA for the years 2018 and 2035, several high-volume intersections would experience approximately 11 percent to 15 percent increases in pedestrian volume compared to the No Build Alternative, most notably at Third/Fourth Avenues and Stewart Street, First Avenue and Madison/Spring Streets, Sixth Avenue S and S Jackson Streets, and Occidental Avenue S and S Jackson Street intersections. The increases are based upon the proposed station locations and forecast transit ridership. Even with increases in pedestrian activity, given generally adequate sidewalk widths, the frequency of streetcar passing, and the station platform design separate from the sidewalks, pedestrian queueing at intersections/crosswalks is not expected to result in pedestrian overflow. Section provides approaches to increase crosswalk and intersection capacity to better accommodate higher pedestrian volumes. Bicycle The LPA would not affect bicycle access along First Avenue; there is no existing bicycle facility along First Avenue and the alignment would not conflict with existing and proposed on-street bikeways on streets parallel to or intersecting First Avenue. The only existing on-street bikeways along the LPA alignment are shared lane markings on Stewart Street between Sixth and First Avenue. Shared lane markings do not provide separation from motor vehicle traffic. The elimination of this route as designated bikeway would not have a major impact on bicyclist access because there is a comparable parallel route one block north of Stewart Street, on Virginia Street. Bicyclists traveling in the east-west direction can use Virginia Street to access north/south bikeways such as Western Avenue, Second Avenue, and Fourth Avenue. In addition, the proposed Pike Street protected bikeway east of Second Avenue would provide an additional eastwest bicycle connection. Bicycle crossings would be required to be perpendicular to the trackway to avoid conflicts. The well-connected future bikeway network is the most likely means by which bicyclists would access destinations in downtown Seattle. The short length of the streetcar system, and the lack of long-term bike parking in downtown Seattle are likely to limit demand for transfers between bicycles and the streetcar at the new stations. However, short-term bicycle parking would be provided at or near planned streetcar stations to facilitate transfers to the streetcar. The streetcar is expected to generate demand for bike share at the stations along the LPA; therefore, future bike share stations should be located within a block or less of streetcar stations along perpendicular or adjacent bicycle routes. No additional impacts would result from station design options or turnaround tracks. TBG SEA MARCH 2016 ENVIRONMENTAL ASSESSMENT PAGE
105 TRANSPORTATION Table Existing and Future Pedestrian Volumes N/S Street E/W Street Existing Volume (PM Peak Hour) 2018 No Build 2018 LPA 2035 No Build 2035 LPA # Change from Existing Change from No Build Change from Existing Change from 2035 No Build Westlake Ave Stewart St 750 8% 4% 29% 4% 5th Ave Stewart St 1,480 7% 3% 29% 3% 5th Ave Olive Way 1,880 8% 5% 29% 6% 4th Ave Stewart St 1,390 8% 15% 29% 13% 3rd Ave Stewart St 1,380 8% 13% 29% 13% 2nd Ave Stewart St 1,320 8% 0% 30% 0% 1st Ave Pine St 2,080 8% 5% 29% 5% 1st Ave Pike St 2,330 8% 4% 29% 5% 1st Ave Spring St 1,390 8% 11% 29% 11% 1st Ave Madison St 1,210 8% 11% 30% 11% 1st Ave Marion St 1,960 8% 0% 29% 0% 1st Ave Columbia St % 4% 29% 6% 1st Ave Cherry St 900 8% 6% 30% 5% 1st Ave Yesler Way 1,190 8% 0% 29% 0% 1st Ave S Jackson St 540 9% 8% 30% 11% 5th Ave S S Jackson St 1,030 8% 5% 29% 5% 6th Ave S S Jackson St 350 9% 16% 31% 11% Occidental Ave S S Jackson St 90 11% 20% 22% 45% Note: No Build Alternative and LPA-projected increases are relative to existing PM peak hour volumes. Source: Intersection turn movement counts, rounded to nearest 10, September Counts were conducted for two hours between 4:00 and 6:00 p.m., with the highest single hour chosen as the system peak. Construction Impacts Pedestrian access would be maintained during construction. Where feasible, the project would provide a continuous path that may need to include a temporary, barrier-protected path. The project would maintain a protected sidewalk at all times on either side of the street; where that is not possible, crosswalks at each intersection would be available before reaching the construction site that would connect pedestrians to the sidewalk on the opposite side. When pedestrian access is restricted to one side of the roadway, advance notice of sidewalk or crosswalk closures with applicable warning signage would be provided. Bicycles would likely be restricted in the active construction zones; however, along First Avenue, bicyclists would likely be unaffected because there are no bike facilities on this street. TBG SEA MARCH 2016 ENVIRONMENTAL ASSESSMENT PAGE
106 TRANSPORTATION Northbound and southbound bicyclists would use the on-street bikeway on Western Avenue. Construction on Stewart Street and Olive Way would affect bicycle access. Westbound bicyclists would be detoured at Eighth Avenue where they could connect to the bikeway on Bell Street (four blocks north) to continue west. Eastbound bicyclists would use the bikeway on Virginia Street and reconnect with Stewart Street at Seventh Avenue Parking The supply of parking spaces and loading in the study area includes on-street stalls and off-street garages and surface lots. Figure shows the existing on-street and off-street parking areas along the LPA alignment and identifies blocks where there is existing on-street parking, offstreet parking locations (surface lots and garages), and alley. Table provides an inventory of existing on-street parking along the alignment First Avenue, Olive Way, and Stewart Street including the proposed northern turnaround on Republican Street between Terry Avenue and Westlake Avenue. Overall, there are 228 on-street parking stalls along these streets, with an average occupancy of about 95 percent during the three highest-occupancy hours between 8 a.m. and 7 p.m. 10 This inventory includes the following four categories: All-day parking. Parking stalls available for all-day use, including during peak periods. 11 Peak-restricted parking. Parking stalls available only outside of peak periods, which are generally 6 to 9 a.m. and 3 to 6 p.m. along First Avenue. During peak periods this curb space is used for general purpose vehicle travel resulting in short sections with two lanes in either direction. Commercial vehicle load zone. Curb space designated for use by commercial vehicles. 12 Passenger load zone. Curb space designated for use by passenger vehicles or taxis; often signed as a 3-minute passenger loading zone. At the northern turnaround on Republican Street between Westlake and Terry Avenues, there are 15 total parking spaces (one is for commercial loading only; four allow food trucks during lunchtime). The station design option for the southern end of the alignment on Eighth Avenue, between Jackson Street and King Street, includes one existing parking space and a bus zone (for Route 99) on the west side of the street. 10 Along First Avenue between Jackson and Stewart Streets and an approximately one-block distance east and west of First Avenue, including the western block faces of Second Avenue and the eastern block faces of Western Avenue and east-west blocks between Second and Western Avenues or Alaskan Way and Occidental Avenue. 11 Short-term paid parking on First Avenue is limited to sessions of 2 hours or less. 12 The commercial vehicle load zone category includes general loading zones. TBG SEA MARCH 2016 ENVIRONMENTAL ASSESSMENT PAGE


107 TRANSPORTATION Figure Existing Parking Facilities TBG SEA MARCH 2016 ENVIRONMENTAL ASSESSMENT PAGE
108 TRANSPORTATION Average off-street parking lots and garages along the streetcar route 13 are about 50 to 75 percent occupied and have a capacity of over 3,900 stalls. Of the approximately 3,900 off-street parking stalls in these lots and garages, an average of over 1,600 stalls are available in the morning and over 1,300 are available in the afternoon. 14 Because off-street parking along the alignment is not fully used (50 to 75 percent of capacity, as noted above; refer to the Appendix H1, Transportation Technical Report, for details), off-street garages and surface parking lots are expected to help make up for the loss of on-street parking stalls. The City is currently working on a Center City parking strategy to manage parking throughout the downtown area (see Center City Parking Program 15 ) Impacts No Build Alternative There would be no change from current conditions (Table ) in parking or loading zones with the No Build Alternative. Locally Preferred Alternative Operational Impacts The displacement of on-street parking and loading is necessary to maintain at least one general purpose lane in each direction along First Avenue and to accommodate station platforms, protected left-turn lanes, or turnaround tracks. Some existing parking on First Avenue is available all day and would likely remain. Some additional all-day spaces would be created along First Avenue in blocks that would not have station platforms or protected left-turn lanes. Table summarizes the on-street parking impacts associated with the LPA. The LPA, including the Republican turnaround, would use approximately 194 of the 230 existing on-street parking stalls along the alignment; about 36 stalls would remain. The largest change (representing 154 of the 194 stalls reduced) would be the elimination of peak-restricted parking along First Avenue as well as portions of Stewart Street. Commercial and passenger vehicle loading areas would be reduced to about 12 locations along the alignment with the project. The Republican northern turnaround would eliminate parking on the north side of the block between Terry Avenue and Westlake Avenue, resulting in the loss of eight all-day spaces, including two food truck spaces and one commercial loading space. 13 Along First Avenue between Jackson Street and Stewart Street and an approximately one-block distance east and west of First Avenue (between Second Avenue and Western Avenues or Alaskan Way and Occidental Avenue). 14 PSRC (2013). 15 See TBG SEA MARCH 2016 ENVIRONMENTAL ASSESSMENT PAGE
109 TRANSPORTATION Table No Build Alternative and LPA On-Street Parking after Project Construction On Street Parking Parking Stalls (1st, Stewart, and Republican) All-Day Parking No Build LPA Peak-Restricted Parking No Build LPA Commercial Vehicle Loading No Build LPA No Build Passenger Loading LPA No Build Total LPA Construction Impacts Construction of the project would effect on-street parking and loading zones along the alignment within each active construction segment. Parking would be maintained on cross-streets. A parking analysis showed that there is adequate off-street parking to offset the temporary loss of parking due to construction along First Avenue and Stewart Street. Temporary loading zone designations could be used on a case-by-case basis to maintain commercial vehicle and passenger loading zones in reasonable proximity to businesses along the corridor. The loading zone strategies described for operation of the LPA would also be applied to optimize loading zone availability during the construction period Mitigation Measures No mitigation will be required for regional travel and for freight because the impacts of the project would be negligible compared to the No Build Alternative with these elements. Additionally, no mitigation will be required for property access and circulation. Access will be maintained, albeit many access points would be restricted to right-in and right-out. Transit, local and arterial street operations, non-motorized facilities, and parking are described in the following subsections Transit Systems Advanced planning with affected transit agencies on changes to bus service and stop locations during the construction and operation phases of the project will help alleviate passenger confusion. Planning will include advanced notices to passengers, signs at bus stops, and signs along sidewalks that redirect passengers to the correct stops. The services and facilities that will be affected specifically involve the following: To mitigate conflicts with bus operations: - Continue coordinating plan review with King County Metro, Sound Transit, and Community Transit through final design through circulation of plans at the 60 percent and 90 percent design milestones and comment resolution. Plan bus service changes and stop locations to help alleviate passenger confusion. - Design streetcar/etb interface electrical systems consistent with the existing South Lake Union and First Hill Streetcar segments. TBG SEA MARCH 2016 ENVIRONMENTAL ASSESSMENT PAGE
110 TRANSPORTATION - Consult and coordinate with King County Metro to facilitate rerouting Routes 16 and 66 to Third Avenue. - Develop a joint use stop on First Avenue between Madison and Spring Streets to serve Route 12. This would be completed as part of the Madison Street BRT project. Prior to implementation of the BRT project, Route 12 would be accommodated through design of the Center City Connector project. Alternatively, SDOT is examining the option of early implementation of the joint use stop. - Use coordinated signal timing developed as part of SDOT s The Next Generation Intelligent Transportation System project to provide reliable north-south travel times along First Avenue and limit special streetcar signal phases to those that are required for a streetcar-only movement. - Coordinate in advance with King County Metro, Sound Transit, and Community Transit to plan bus service changes and stop locations to help alleviate passenger confusion. - Eliminate the inefficiencies of permissive left-turn movements along the First Avenue alignment and provide protected left-turn signal phases in locations where left turns are not restricted To mitigate conflicts with ETB s OCS systems and the Center City Connector: - Maximizing use of battery drive to operate the streetcars through the Stewart and First Avenue segments. - Amend the existing interlocal agreement with King County that provides funding for the inspection and maintenance of joint use streetcar/etb OCS system crossing hardware to incorporate the Center City Connector. - Provide special crossing hardware and/or shift the ETB wires to allow movement of both the streetcar and ETB systems through the intersection. - Shift or replace existing ETB crossings, as required, to accommodate new streetcar crossing hardware. To avoid conflicts between streetcar construction and bus operations: - Coordinate in advance with King County Metro, Sound Transit, and Community Transit to plan bus service changes and stop locations during the construction of the project to help alleviate passenger confusion. - Provide advanced notice to passengers, signs at bus stops, and signs along sidewalks that redirect passengers to the correct stops to help alleviate passenger confusion. To minimize construction impacts to ETBs: - Install infrastructure at strategic locations (to be developed with King County Metro) that will allow King County Metro to use battery power when deadheading buses are following a detour route around the construction zone. - Along Stewart/Olive Way, limit construction primarily to weekends to limit the need for de-energization outside standard KCM de-energization windows. SDOT will consult with the King County Metro Construction Coordination Office to determine the best times for de-energizing wires. - Apply the best practices for temporary de-energizations, bus reroutes and temporary bus stop closures/relocations that the City and King County Metro s Construction TBG SEA MARCH 2016 ENVIRONMENTAL ASSESSMENT PAGE
111 TRANSPORTATION Coordination office have applied and refined through construction of the City s downtown paving program and First Hill Streetcar project Arterials and Local Streets Roadway Operations. All intersections within the study area would operate at LOS E or better with the project in both future years 2018 and 2035, with the exception of Westlake Avenue N and Republican Street, and Alaskan Way and S King Street. The Alaskan Way and S King Street intersection would operate at LOS F with both No Build Alterative and LPA and delay would be slightly smaller with the LPA, so no mitigation will be required. The Westlake Avenue N and Republican Street intersection would operate at LOS F with both No Build Alternative and LPA, but the project would increase average delay for intersections with the exclusive signal phase for the westbound streetcars. The City is developing potential improvements to this intersection that would change traffic patterns, which will improve intersection operations. While vehicle throughput along First Avenue would decrease, person throughput would increase with the LPA. Moving more people in fewer vehicles indicates that people would be able to move more efficiently along First Avenue with the project. Auto travel time along the LPA alignment would not be worse with the project compared to the No Build Alternative in both 2018 and 2035 during peak hours. Therefore, no mitigation will be required beyond the project design to improve intersection operations and general traffic operations with the LPA. Under typical traffic days, no mitigation during construction is necessary beyond BMPs and an SDOT approved/ coordinated Traffic Control Plan; however, during large events, SDOT will implement the following measures during construction, especially during construction in Pioneer Square: Coordinate with the City s Special Events Committee and Seattle Police Department traffic control to provide enhanced public awareness of congestion and alternative modes for accessing events, in addition to posting travelers advisories on the SDOT Blog and Website ( On the Move ), and include special events on the City Traveler s Map. Provide signing and wayfinding to help travelers access key destinations Provide flaggers and/or uniformed police officers at key intersections when needed to facilitate the movements of freight and general purpose traffic and to expedite emergency vehicles. Coordinate traffic management through the SDOT HUB program. Traffic Safety. The LPA would generally be separated from general traffic. Only at intersections would there be vehicles crossing the streetcar tracks, creating conflicts, but the traffic signals would have protected signal phases for the streetcar or auto to separate and protect these movements. The LPA would be designed to meet City of Seattle standards. The LPA would restrict left-turn access at five parking garage driveways and five left-turn movements at intersections along First Avenue. Several driveways would be modified to maintain safe access to the property, as follows: The first driveway south of Pike Street on the east side of First Avenue will be modified to right-in/right-out access with the proposed streetcar station located in the median at Pike Street. TBG SEA MARCH 2016 ENVIRONMENTAL ASSESSMENT PAGE
112 TRANSPORTATION Access to the four remaining driveways will require signage and striping to modify access to right-in/right-out movements to avoid left turns across the exclusive streetcar lane Non-motorized Facilities With the LPA, pedestrian activity would increase in the area. It would improve intersections that would have increased pedestrian volume (see Table ) with wider sidewalks, meeting the requirements of the Seattle Right-of-Way Improvements Manual, Section 4.11 (SDOT, 2012). To ensure pedestrian safety at crosswalks near stations, SDOT will: Locate crosswalks accessing the streetcar station median platforms at signalized intersections with signal phases provided for pedestrians. Add curb extensions and pedestrian signal improvements, such as leading pedestrian interval. To avoid conflicts between streetcars and bicycles, SDOT will: Ensure that existing and future bicycle lane facilities cross the streetcar tracks at a 90 degree angle (i.e., at Fifth, Fourth, and Second Avenues on Stewart Street). Direct bicyclists from Stewart Street and Olive Way via the existing bikeway at Seventh Avenue to the proposed Pike Street protected bike lane between Broadway and First Avenue, via the existing bikeway at Seventh Avenue. Update bike wayfinding signage.to avoid conflicts during construction, the following mitigation measures will be implemented: Divert bicyclists from Stewart Street and Olive Way bikeways one block north to Eighth Avenue and connect with the Bell Street bikeway and place detour signage in advance of the existing bikeway and along all decision points on the detour route. Place warning and detour signage in advance of the existing bikeway and along all decision points on the detour route. No change is needed for eastbound travel, because bicyclists would have multiple access points to eastbound Virginia Street, including Second Avenue, Fourth Avenue, and Western Avenue Parking Streetcar impacts on on-street parking will be mitigated with the following measure: Expand e-park participation and implement additional e-park wayfinding signage in the study area to help drivers navigate to off-street parking garages, including to garages participating in the parking programs sponsored by Commute Seattle (where garages offer low or flat-rate parking options). SDOT will mitigate for the reduced availability of commercial vehicle and passenger loadings zones with the following measures: Maintain existing all-day loading zones where possible. Provide new all-day, on-street load zones in reasonable proximity to the business and services along the corridor. TBG SEA MARCH 2016 ENVIRONMENTAL ASSESSMENT PAGE
113 TRANSPORTATION Provide loading zones on side streets. Use alleys for deliveries or loading zone access. Allow on-street loading access during early morning and late evening hours. During construction, parking would be mitigated with the measures noted above. In addition, temporary loading zone designations could be used on a case-by-case basis to maintain commercial vehicle and passenger loading zones in reasonable proximity to businesses along the alignment, although this would lead to a reduction in paid parking spaces. TBG SEA MARCH 2016 ENVIRONMENTAL ASSESSMENT PAGE
114
115 AIR QUALITY AND GREENHOUSE GAS 4.2 Air Quality and Greenhouse Gas Federal agencies are required under the Clean Air Act (CAA) to ensure that projects they fund (such as the Center City Connector) are in compliance with existing federal air quality standards and the state s and metropolitan transportation improvement programs. This section evaluates potential project impacts on air quality Air Quality Standards and Conformity Major transportation projects must meet both the U.S. Environmental Protection Agency s (EPA s) National Ambient Air Quality Standards (NAAQS), which set limits on concentration levels of the criteria pollutants in the air, and federal and state conformity requirements. The major airborne pollutants, also known as criteria pollutants, for transportation projects are carbon monoxide (CO), particulate matter (PM), ozone and the ozone precursors, volatile organic compounds (VOCs), and oxides of nitrogen (NO X). In addition, mobile source air toxic (MSAT) air pollutants in vehicle exhaust, particularly from diesel-fueled vehicles, have been addressed in both local and national studies. These are important because toxic air pollutants are known or suspected to cause cancer or other serious health effects. The NAAQS consists of two sets of standards: primary standards that are intended to protect public health, and secondary standards that are intended to protect the natural environment. The Washington Department of Ecology (Ecology) and Puget Sound Clean Air Agency (PSCAA) monitor air quality in the Puget Sound region by measuring the levels of criteria pollutants found in the atmosphere and comparing them with the NAAQS; therefore, the study area for the air quality analysis is measured at regional level. Applicable Regulations Conformity Requirements of federal Clean Air Act (CAA; 40 CFR 51 and 93) and Washington CAA: In nonattainment and maintenance areas, the federal and Washington CAA require transportation projects to conform to the State Implementation Plan (SIP), the state s plan for meeting and maintaining compliance with the NAAQS. To conform with the SIP, transportation activities must not produce new air quality violations, worsen existing violations, or delay timely attainment of the NAAQS. The Center City Connector is subject to these conformity requirements because it is located in a maintenance area for CO. In addition to these standards, Ecology and PSCAA have adopted state and local ambient air quality standards. The Puget Sound region is currently in attainment or unclassified for all criteria pollutants except CO and PM. EPA designated the Puget Sound region as maintenance status for CO in Figure shows the air quality maintenance area for CO and the nonattainment areas for PM in the Puget Sound region. The Center City Connector is located in a maintenance area for CO, which requires each transportation project to be in conformity with the regional air quality model for maintenance of CO levels. The proposed project is included in the Regional Transportation Plan (PSRC, 2014), and the Transportation Improvement Plan, both of which conform to the State Implementation TBG SEA MARCH 2016 ENVIRONMENTAL ASSESSMENT PAGE 4.2-1
.")
116 AIR QUALITY AND GREENHOUSE GAS Figure Air Quality Maintenance Areas Source: PSRC (2014). TBG SEA MARCH 2016 ENVIRONMENTAL ASSESSMENT PAGE 4.2-2
117 AIR QUALITY AND GREENHOUSE GAS Plan. The Transportation Improvement Plan is used to develop the regional air quality model, which confirms that maintenance for CO can be met for the region. In addition to affecting air quality, a change in energy or fuel use can change the amount of greenhouse gas (GHG) emissions. This analysis provides a qualitative review of potential changes in GHG emissions from a change in transportation use Air Quality Conditions Ecology operates ambient air quality monitoring stations to assess the levels of regulated pollutants and to verify continued compliance with the NAAQS. The most recent 3-year data available were gathered from two monitoring stations close to the downtown Seattle. In addition, data were gathered from the NW AIRQUEST database, which is based on a centralized coordinate within the study area. NW AIRQUEST compiles design ambient background values for Washington State based on monitoring values from 2009 through 2011 for all criteria pollutants. Ambient air concentrations of the most recently monitored pollutants are summarized in Table Table Ambient Criteria Pollutant Concentration Levels Monitoring Location Parameter EPA/Ecology Station Maximum Concentration PM Seattle- Beacon Hill b 24-Hour Average (µg/m 3 ) PM Seattle-Queen Anne Hill c Annual Arithmetic Mean (µg/m 3 ) 24-Hour Average (µg/m 3 ) CO Seattle- Beacon Hill b 8-Hour Average (ppm) 1-Hour Average (ppm) Ozone Seattle- Beacon Hill b Nitrogen Dioxide NW AIRQUEST a Max 8-Hour Average (ppm) Annual Arithmetic Average (ppm) 1-Hour Average (ppm) NW AIRQUEST a Design Concentrations NAAQS TBG SEA MARCH 2016 ENVIRONMENTAL ASSESSMENT PAGE 4.2-3
118 AIR QUALITY AND GREENHOUSE GAS Monitoring Location Parameter EPA/Ecology Station Maximum Concentration NW AIRQUEST a Design Concentrations NAAQS Sulfur Dioxide Seattle- Beacon Hill b Annual Arithmetic Average (ppm) 24-Hour Average (ppm) 3-Hour Average (ppm) 1-Hour Average (ppm) a NW AIRQUEST, (latitude: , longitude : ) b EPA, c Ecology, µg/m 3 = micrograms per cubic meter PM2.5 = particulate matter 2.5 microns in diameter or less PM10 = particulate matter 10 microns in diameter or less ppm = parts per million Emission projections and ongoing monitoring throughout the Puget Sound region over the past decade indicate that the ambient air pollution concentrations for CO have decreased. Measured ozone concentrations, in contrast, have remained fairly static. The decline of CO is due primarily to improvements to emission controls on motor vehicles and the retirement of older, higher polluting vehicles Impacts Air quality impacts for the Center City Connector are based on the existing attainment status with established air quality standards in the project vicinity for each regulated pollutant, and it presents existing air quality monitoring data that support the trend of how existing air pollution control measures improve air quality in the region No Build Alternative The No Build Alternative represents future conditions without the Center City Connector. Population growth, economic growth, and land development would continue, which could increase emissions. However, increasingly stringent federal and state emission control requirements and the replacement of older, higher polluting vehicles with newer, less-polluting ones would reduce basin-wide emissions under the No Build Alternative. Therefore, air quality is expected to improve in the basin under the No Build Alternative compared to existing conditions. TBG SEA MARCH 2016 ENVIRONMENTAL ASSESSMENT PAGE 4.2-4
119 AIR QUALITY AND GREENHOUSE GAS Locally Preferred Alternative Operational Impacts Microscale Carbon Monoxide Analysis. Because the proposed Center City Connector project is in a maintenance area for CO, a project-level analysis is necessary to verify that no localized impacts would cause or contribute to a violation of the NAAQS. The analysis evaluates whether the project meets the project-level conformity requirements for CO and analyze whether CO concentrations near intersections with high levels of traffic and delay would cause a violation of the air quality standards. The results of this analysis are discussed in the following sections. Site Selection. Existing intersections along the alignment were analyzed using data generated for the project traffic analysis. Based on changes in intersection volume, delay, and level of service (LOS) between the existing conditions and LPA, three intersections that might be adversely affected by the Center City Connector were identified. (Appendix D4.2-A summarizes affected intersection data, and Appendix D4.2-B provides more detailed data [output files from the Synchro8 model].) The affected intersections are listed below: Westlake Avenue/ Republican Street Alaskan Way/ S King Street First Avenue/ S Jackson Street Carbon Monoxide Hot Spot analysis is the modeling of CO emissions from vehicles at the anticipated mostcongested traffic intersections as a result of a project. CO Hot Spot analyses are used as a basis to determine whether a project may result in localized concentrations of carbon monoxide that would exceed ambient air quality standards CO levels were then estimated using the MOVES2014 and CAL3QHC air quality dispersion models for the existing condition (2014), the opening year (2018), and the horizon year (2040) levels at locations listed above. The CAL3QHC analysis is contained in Appendix D4.2-C. EPA s Guideline for Modeling Carbon Monoxide from Roadway Intersections (1992) and Using MOVES in Project-Level Carbon Monoxide Analyses (2014) were used as guidance in evaluation of CO hot spots in the study area. Emission factors were obtained for posted speeds without congestion and periods of idle for the existing year (2014), opening year (2018), and horizon year (2040). A speed of 25 mph 1 was used to represent free-flow speeds for the intersections. A speed of 0 mph was used to calculate an idle emission factor. The CAL3QHC model was used to estimate peak 1-hour CO concentrations near the affected intersections. Peak 8-hour CO concentrations were obtained by multiplying the highest peak-hour CO estimates by a persistence factor of 0.7 (EPA, 1992). The background CO concentrations were added to the respective modeled 1-hour and 8-hour CO impacts to establish the design values for each of the project intersections. The predicted 1-hour and 8-hour CO design value concentrations at the three intersections evaluated for CO hot spots are presented in Tables and 4.2-3, respectively. As shown, CO concentrations from traffic 1 Currently, the speed limit on First Avenue is 30 mph, but the Center City Connector would reduce the roadway speed to 25 mph, which is the speed used for project projections. TBG SEA MARCH 2016 ENVIRONMENTAL ASSESSMENT PAGE 4.2-5
120 AIR QUALITY AND GREENHOUSE GAS at the worst-case intersections would not cause or contribute to an exceedance of the 1-hour or 8- hour CO NAAQS of 35 ppm and 9 ppm, respectively. Table Modeled 1-Hour Carbon Monoxide Design Values Intersection Maximum 1-Hour Carbon Monoxide Design Values (ppm) Existing 2014 No Build 2018 LPA 2018 No Build 2040 LPA 2040 Westlake Ave/Republican St a 5.1 a Alaskan Way/S King St First Ave/ S Jackson St a 5.1 a NAAQS 35 Results include a background of 5 ppm. a CAL3QHC impact less than 0.1 ppm. Table Modeled 8-Hour Carbon Monoxide Design Values Intersection Maximum 8-Hour Carbon Monoxide Design Values (ppm) Existing 2014 No Build 2018 LPA 2018 No Build 2040 LPA 2040 Westlake Ave/Republican St Alaskan Way/S King St First Ave/ S Jackson St NAAQS 9 Results include a background of 3.5 ppm. Mobile Source Air Toxics (MSAT). MSAT assessments are required for most federal transportation projects. Based on the example projects defined in Interim Guidance Update on Mobile Source Air Toxic Analysis in NEPA (FHWA, 2012), the Center City Connector would be classified as a project with Low Potential MSAT Effects. Most air toxics originate from manmade sources, including on-road mobile sources (e.g., vehicles), non-road mobile sources (e.g., airplanes), area sources (e.g., dry cleaners), and stationary sources (e.g., factories or refineries). This project only reviews MSATs (as opposed to non-mobile sources) due to the project that may change existing air toxics. Based on an FHWA analysis using EPA's MOVES2010b model, even if vehicle miles traveled (VMT) increased by 102 percent, as assumed from 2010 to 2050, a combined reduction of 83 percent in the total annual emissions for the priority MSATs is projected for the same time period, as shown on Figure The LPA is expected to lower VMT in the study area compared to the No Build Alternative. The LPA may result in slightly higher short-term MSAT emissions at interchanges than the No Build TBG SEA MARCH 2016 ENVIRONMENTAL ASSESSMENT PAGE 4.2-6
121 AIR QUALITY AND GREENHOUSE GAS Alternative because of vehicle delay along the project route; however, the reduction in overall VMT would reduce MSAT emissions along the entire corridor. Climate Change and Greenhouse Gas. Anthropogenic (human-caused) GHG emissions are believed to contribute to a rapid change in climate that accelerates as more GHG accumulates. Carbon dioxide makes up the largest component of these GHG emissions. Other prominent transportation GHGs include methane and nitrous oxide. GHGs are different from other air pollutants evaluated in environmental reviews because their impacts are not localized or regional, but rather the affected environment for carbon dioxide and other GHG emissions is the entire earth. Therefore, it is difficult to isolate and understand the GHG emissions impacts for a particular transportation project. The Center City Connector is intended to reduce traffic volume and VMT in the study area. Because the LPA would be electricpowered and would reduce vehicle trips in the study area compared to the No Build Alternative, direct emissions of GHGs from Source: FHWA (2012). the proposed project would be not be Mt/yr = megatons per year expected. However, indirect emissions of GHG would be generated to support the electric trains. The Pacific Northwest electricity grid is mostly composed of clean hydroelectric power sources compared to fossil-fueled power sources. Therefore, the reduction of GHGs from the reduced VMT in the study area would be expected to offset the GHGs indirectly emitted from the electric trains. Construction Impacts Figure MSAT Trends During construction, soil-disturbing activities, operations of heavy-duty equipment, commuting workers, and paving could generate emissions that would temporarily affect air quality. The total emissions and the timing of the emissions from these sources would vary depending on the phasing of the project and options chosen for the project. Typical sources of emissions during construction of transportation projects include the following: Fugitive dust generated during vehicle movement on paved and unpaved roads, excavation, grading, and loading and unloading activities Dust generated during demolition of structures and pavement TBG SEA MARCH 2016 ENVIRONMENTAL ASSESSMENT PAGE 4.2-7
122 AIR QUALITY AND GREENHOUSE GAS Engine exhaust emissions from construction vehicles, worker vehicles, and diesel fuelfired construction equipment Increased motor vehicle emissions associated with increased traffic congestion during construction VOC and odorous compounds emitted during asphalt paving The regulated pollutants of concern for the first two source types (dust) are PM2.5 and PM10. Engine and motor vehicle exhaust would result in emissions of VOCs, NOx, PM2.5, PM10, sulfur dioxide (SO2), air toxics, and GHGs. The scale and duration of construction would not result in substantial pollutants, but best management practices would be required by PSCAA to control PM10, PM2.5, and emissions of CO and NOx during construction. GHG would result from the emissions of fossil-fueled construction equipment, and these emissions would be directly proportional to the quantity of fuel used. Because this is a relatively short project (the duration of construction is under a 2-year program) and the number and type of construction equipment to be used have not been developed, GHG was not calculated. The scale and duration of the project will have a minimal GHG emissions impact because the project construction would only affect local circulation. The impacts of construction on regional facilities and regional travel would be negligible, as the proposed detours would only use local roads and short term Mitigation Measures Seattle Climate Action Plan As of 2008, approximately 40 percent of Seattle s GHG emissions came from roadrelated transportation sources. Seattle is updating its Climate Action Plan with a goal of achieving zero net GHG emission by The City of Seattle also signed on to the 2005 U.S. Mayor s Climate Protection Agreement, which adopted the goal of the Kyoto Protocol to reduce citywide GHG emissions by 7 percent below 1990 levels. No mitigation is required for the operational phase of the Center City Connector because there would be no impacts on carbon monoxide, MSATs or GHG impacts. During construction, impacts on air quality will be reduced and controlled in accordance with the City s Standard Specifications for Road, Bridge, and Municipal Construction [Section (3)] and dust control BMPs described in the City s Construction Stormwater Control Technical Requirements Manual Volume 2. Reducing air quality impacts during construction would involve BMPs such as the following: Spray exposed soil with water or other suppressants to reduce emissions of PM10 and deposition of particulate matter during dry periods. Use phased development to minimize disturbed areas. Use wind fencing to reduce disturbance to soils. Minimize dust emissions during transport of fill material or soil by wetting down or by providing adequate freeboard (space from the top of the material to the top of the truck bed) on trucks. Promptly clean up spills of transported material on public roads. TBG SEA MARCH 2016 ENVIRONMENTAL ASSESSMENT PAGE 4.2-8
123 AIR QUALITY AND GREENHOUSE GAS Schedule work tasks to minimize disruption of the existing vehicle traffic on streets. Restrict traffic on the site to reduce soil upheaval and the transport of material to roadways. Locate construction equipment and truck staging areas away from sensitive receptors as practical and in consideration of potential impacts on other resources. Provide wheel washers to remove particulate matter that would otherwise be carried off the site by vehicles to decrease deposition of particulate matter on area roadways. Cover dirt, gravel, and debris piles as needed to reduce dust and wind-blown debris. Minimize odors on the site by covering loads of hot asphalt. Emissions of PM2.5, PM10, VOCs, NO X, SO2, and CO would be minimized whenever reasonable and possible. Because these emissions primarily result from construction equipment, machinery engines would be kept in good mechanical condition to minimize exhaust emissions. Additionally, contractors would be encouraged to reduce idling time of equipment and vehicles and to use newer construction equipment or equipment with add-on emission controls. TBG SEA MARCH 2016 ENVIRONMENTAL ASSESSMENT PAGE 4.2-9
124
125 NOISE AND VIBRATION 4.3 Noise and Vibration N oise and vibration are common in an u rbanized area. Increases in noise can cau se sleepd istu rbances and generalannoyance oru neasiness.increases in vibration can sometimes be feltand have the potentialto affect bu ild ings.p otentialimpacts of noise and vibration from transportation projects mu stbe measu red and evalu ated in ord erto protectareas where people sleep,where there are fu nctions thatd epend on qu iet,orwhere there is a potentialto affectad jacentstru ctu res.this section d escribes potentialnoise and vibration impacts of the C enterc ity C onnector.the projectstu d y area,consists of sensitive receptors within 125 feetof the alignment centerline fornoise and u pto 20 0 feetforvibration, d epend ingon bu ild ingmaterial. Applicable Regulations N oiseand Vibrationim pactsare based onft A guidancem anual Transit Noise and Vibration Impact Assessment (FT A,2006)and S eattlen oisecontrolcode (S eattlem unicipalcode[s M C] Chapter25.08)w hichspecifies perm issiblesound levelsw ithin thecity Noise N oise is d efined as u nwanted sou nd,whichis asu bjective experience of exposu re to d ifferent sou nd levels.the hu man earprocesses smalflu ctu ations in airpressu re d ifferently,d epend ing on the amplitu d e (lou d ness and softness),pitch(highorlow frequ ency),and variability(how noise changes overtime).sou nd pressu re is measu red in terms of sou nd pressu re level, expressed in d ecibels (d B ).The overald B leveld oes notad d ress the varyinghu man sensitivity to sou nd atd ifferentfrequ encies oroverallou d ness thatmightbe ex perienced Measuring Noise The hu man earis optimized forspeechfrequ encies and is less sensitive atlow frequ encies and very high frequ encies.to provid e ameasu rementmeaningfu lto hu mans,aweightingsystem was d eveloped thatred u ces contribu tions of these higher-and lower-frequ ency sou nd s.this filteringsystem is u sed fornearly alnoise ord inances.m easu rements taken withthis A -weighted filterare referred to as d B A read ings Evaluating Noise Impacts Human Response to Sound T hehum anearhasaunique responsetosound pressure.itis lesssensitivetosoundsfaling outsidethespeechfrequency range.s ound-levelm etersand m onitorsuseafilteringsystem to approxim atehum anperceptionof sound.m easurem entsm ade usingthisfilteringsystem are referredtoasa-w eighted. Sou nd pressu re levels varyin magnitu d e overtime,often significantly.h u man sensitivity to noise also varies overtime,withnighttime sensitivity typicaly beinghigherthan d aytime.in ord erto accou ntforthis,d escriptors have been d eveloped foru se in d eterminingnoise impacts by simplifyingthe d escription of acomplex time and varyingsou nd pressu re levelinto single-d igitnu mbers.the three mostcommon d escriptors u sed forassessingenvironmentalimpacts are the equ ivalentsou nd level(l eq),the d ay-nightsou nd level(l d n),and the maximu m sou nd level(l max),d efined as fo lows: TBG SEA MARCH 2016 ENVIRONMENTAL ASSESSMENT PAGE 4.3-1
126 NOISE AND VIBRATION L eq stead ysou nd levelthatrepresents the same sou nd energyas the varyingsou nd levels overaspecified time period (typicaly 1 hou ror24 hou rs). L d n 24-hou rl eq witha10-d B penaltyto sou nd levels at night,accou ntingforincreased sensitivity when people typicaly sleep.this is typicaly applied to resid ential receptors. L max the lou d esteventwithagiven time period,most commonly1 hou r. N oise impacts forthe projectare based on the criteriad efined in the FTA gu id ance manu altransit Noise and Vibration Impact Assessment (FTA,20 0 6). FTA s noise impactcriteriaare grou ped into the fo lowingnoisesensitive receptorcategories,based on land u se: 1,2 Category 1:B u ild ings orparks where qu ietis an essentialelementof theirpu rpose. Category 2:Resid ences and bu ild ings where people normaly sleep,inclu d ing resid ences,hospitals,and hotels where nighttime sensitivity is assu med to be important. Category 3:Institu tionalland u ses withprimarily d aytime and eveningu se,inclu d ing schools,libraries,chu rches,and active parks. There are two levels of impactinclu d ed in the FTA criteria: Severe impact: P roject-generated noise in the severe impactrange wou ld cau se a su bstantialpercentage of people to be highly annoyed by the new noise and represents the mostcompe lingneed formitigation. Moderate impact: In this range of noise impact,the change in the cu mu lative noise level is noticeable to mostpeople bu tmightnotbe su fficientto cau se strong,ad verse reactions from the commu nity.o therproject-specific factors mu stbe consid ered to d etermine the magnitu d e of the impactand the need formitigation. Figu re d epicts the noise impactcriteria,as we las the existingnoise exposu re and the ad d itionalnoise ex posu re from atransitprojectthatwou ld cau se eithermod erate orsevere impacts.the fu tu re noise exposu re is d etermined bycombiningthe existingnoise exposu re and the ad d itionalnoise ex posu re thatatransitprojectwou ld cau se Seattle Noise Ordinance Sensitive Receptors S ensitivereceptorsare locationsw here occupants usem ay be altered by excessivenoise. S ensitivereceptors com m only include residences,healthcare facilities,publiclibraries, schools,and parks. The Seattle N oise C ontrolc od e (Seattle M u nicipalc od e [SM C ] C hapter25.08 )specifies permissible sou nd levels within the city.sm C d efines limits forex teriorsou nd levels between properties based on zoningd istricts.table lists permissible sou nd levels transmitted between u nrelated properties. 1 Ldn is used to characterize noise exposure for residential areas (Category 2). For other noise-sensitive land uses, such as outdoor amphitheaters and school buildings (Categories 1 and 3), the highest 1-hour Leq during the facility s operating period is used. 2 Parks are considered a special case under the FTA criteria. Only parks that are primarily used for passive activities, such as reading, conversation, and meditation, in contrast, could be considered noise-sensitive, and the parks must have low existing noise levels. In addition, outdoor areas where interpretation takes place, such as historic landmarks or tours, could be considered under the FTA criteria. TBG SEA MARCH 2016 ENVIRONMENTAL ASSESSMENT PAGE 4.3-2

127 NOISE AND VIBRATION M od ifications to the exteriorsou nd levellimits are su bjectto mod ifications d elineated in SM C , d epend ingon the time of d ay, classification of receivingproperties, and the type of sou nd generated.these mod ifications are ad d itive and ind epend entof one another.therefore, the ex teriornighttime sou nd levellimit in aresid entiald istrictforaperiod ic, tonalsou rce wou ld be 20 d B less than the ex teriorsou nd levellimits listed in Table W hile the SM C d oes notregu late noise emissions from streetcars operatingon theirpu blic alignments,these regu lations d o applyto botho M F ex pansion sites,as shown in Table Figure FTA Project Noise Impact Criteria Source: FTA (2006) Table City of Seattle Exterior Sound-Level Limits District of Receiving Property (Hourly Leq / Lmax) District of Sound Source Residential Commercial Industrial Residential 55 / / / 75 Commercial 57 / / / 80 Industrial 60 / / / 85 Source: SMC , Exterior Sound Level Limits. Table OMF Sound-Level Limits Facility District of Sound Source District of Receiving Property Code Limit (Hourly Leq / Lmax) South Lake Union Commercial Commercial 60 / 75 Chinatown- International District Source: SMC Chapter Commercial Commercial 60 / 75 Industrial 65 / 80 TBG SEA MARCH 2016 ENVIRONMENTAL ASSESSMENT PAGE 4.3-3
128 NOISE AND VIBRATION Noise in the Study Area The projectnoise stu d y areais d efined as alnoise-sensitive receptors within 125 feetof the centerline of the streetcaralignmentand properties nearthe O M F ex pansion sites.w ithin the overalstu d y area,inclu d ingthe L P A (d iscu ssed in d etailin the A ppend ix H 3,Center City Connector Noise and Vibration Technical Report [SD O T,20 15] ),there are atotalof 67 noisesensitive receptors thatwere investigated,94 percentof whichwere resid entialu se.e x isting sou nd levels within this stu d yarearange between 66 and 7 6 d B A d u ringthe d ayand 64 and 67 d B A atnight Vibration Vibration Overview Streetcaroperations on tracks and crossovers can resu ltin vibration thatmightbe felton ad jacent properties.forvibration,there are atotalof 128 sensitive receptors within the vibration stu d y area(i.e.,20 0 feetfrom streetcaralignmentcenterline),49 percentof whichare resid entialu se. V ibration above certain levels can d amage bu ild ings,d isru ptsensitive operations,and annoy hu mans in bu ild ings.the response of hu mans,bu ild ings,and equ ipmentto vibration is most commonly d escribed u singvelocity.v ibration velocity levelorv d B is u sed to evalu ate the effects of vibration on hu mans and equ ipment.d amage to bu ild ings is assessed u singthe peak particle valu e (P P V ). Figu re ilu strates typicalgrou nd borne vibration velocity levels forcommon sou rces,as we las threshold s forhu man and stru ctu ralresponse to grou nd borne vibration.the threshold of hu man perception to vibration is approximately65v d B ;annoyance d oes notu su alyoccu r u nless the vibration exceed s 7 0 V d B Vibration Criteria FTA s grou nd borne vibration impactcriteriaare based on existingland u se and the nu mberof train pass-bys perhou r.the FTA vibration criteriaare applied primarily to resid ential(inclu d ing hotels and otherplaces where people sleep)and institu tionalland u ses.table shows the criteriaforageneralvibration assessment.c ommercialland u ses are only consid ered when they contain vibration-sensitive u ses,su chas med icaloffices orsensitive manu factu ringequ ipment. O therbu ild ings,su chas concerthals,record ingstu d ios,and theaters,can be very sensitive to vibration and have criteriarangingbetween 65 and 7 2 V d B forfrequ entevents,d efined as more than 7 0 vibration events perd ay. FTA categorizes mostreceptors in the stu d y areaas vibration-sensitive receptors.these receptor categories are d ifferentthan the noise-sensitive receptorcategories,withthe ex ception of C ategory 2 beingresid entialu se.a single C ategory 1 receptorwas id entified (P arcelid #17 8, Institu te forsystem B iology,401 TerryA venu e N )becau se itinclu d es biomed icalresearch activities.a lthou ghthis areawas previou sly stu d ied forthe Sou thl ake Union Streetcar(P arsons B rinckerhoff,20 0 5),itis notclearif this property was u sed as amed icalresearchfacility atthat time. TBG SEA MARCH 2016 ENVIRONMENTAL ASSESSMENT PAGE 4.3-4
129 NOISE AND VIBRATION Figure Examples of Groundborne Vibration Levels and Human/Structural Response Source: FTA (2006) Table Groundborne Vibration and Noise Impact Criteria for Light Rail Transit Service Frequency Land Use Category Category 1: Buildings where low ambient vibration is essential for interior operations Category 2: Residences and buildings where people normally sleep Category 3: Institutional land uses with primarily daytime use Groundborne Vibration Impact Levels (VdB re 1 micro inch/second): Frequent Events Groundborne Noise Impact Levels (db re 20 micro Pascals): Frequent Events 65 VdB a N/A b 72 VdB 35 dba 75 VdB 40 dba a This criterion limit is based on levels that are acceptable for most moderately sensitive equipment, such as optical microscopes. Vibration-sensitive manufacturing or research would require detailed evaluation to define the acceptable vibration levels. Verifying lower vibration levels in a building often requires special design of the heating, ventilation, and air conditioning systems and stiffened floors. b Vibration-sensitive equipment is generally not sensitive to groundborne noise. TBG SEA MARCH 2016 ENVIRONMENTAL ASSESSMENT PAGE 4.3-5
130 NOISE AND VIBRATION Impacts No Build Alternative The N o B u ild A lternative wou ld notresu ltin project-related noise orvibration impacts.the u rban environmentwou ld continu e to have noise from d evelopmentconstru ction and from traffic,whichare projected to increase based u pon forecasted increases in popu lation and employmentin Seattle (see Section 4.6,Socialand C ommu nity E ffects) Locally Preferred Alternative Operational Impacts Noise D etailed noise and vibration pred iction mod els were d eveloped u singthe method s given in the FTA s Transit Noise and Vibration Guidance Manual (revised M ay )(FTA,20 0 6b).The pred iction mod els involve gatheringambientnoise by takingmeasu rements overa24-hou r period to d etermine ex istingnoise cond itions.then prescribed FTA inpu ts forstreetcarnoise su chas the sou nd levelat50 feetfrom the streetcar,nu mberof trains perhou r,travelspeed,and ex istingbackgrou nd noise are combined in the mod elto pred ict projectsou nd levels.if the pred icted sou nd levelatthe ex teriorof asensitive receptorex ceed s the criteriasetby FTA,a preliminary impactis noted.table provid es the noise inpu td escriptions u sed to pred ict noise from the project. Table Streetcar General Noise Assessment Input Parameters Description Reference SEL at 50 feet for street car a Value 82 dba Average number of cars per streetcar set 2 Travel speed Average hourly volume of traffic Average daytime hourly volume of traffic Peak daytime hourly volume of traffic Average nighttime hourly volume of traffic 25 mph 18 trains per hour 23 trains per hour 24 trains per hour 10 trains per hour Rail vehicles adjustment (embedded on grade) b 3 Source: FTA Manual, Table 5-1. a SEL = sound exposure level b Track can be embedded in asphalt, concrete, ballast material, or in groomed ground. The LPA is planned to be in concrete. C onservative inpu td ataof 25 mphwas u sed forthe entire C enterc ity C onnectoralignment, generatingaworst-case noise scenario.d u ringoperations,the streetcarwou ld notreachthis speed throu ghou tthe alignmentbecau se streetcars mu stslow atstation stops and signalized intersections;in ad d ition,on otherportions of the rou te,streetcars wou ld travelin mix ed flow TBG SEA MARCH 2016 ENVIRONMENTAL ASSESSMENT PAGE 4.3-6

131 NOISE AND VIBRATION withmotorized vehicles and ad ju stto lowerspeed s.forthe C enterc ity C onnector,25 mphis conservative becau se the average speed wou ld be closerto 15 mphoverthe lengthof the project. M easu rements were cond u cted to d ocu mentex istingnoise cond itions atrepresentative locations alongthe alignment.m onitoringstations,shown on Figu re 4.3-3,were located nearproposed station locations in prox imity to resid entialu se (C ategory 2)receptors,where feasible. Table lists the specific locations and d u rations fornoise monitoring. Table Ambient Noise Monitoring Locations Location Address Duration N th Ave, surface parking lot near Westin Hotel, Parcel ID #162 10/1/14 10/2/14 N nd Ave, The Josephinum, Parcel ID #154 10/28/14 10/29/14 N First Avenue, Providence Vincent House, Parcel ID #136 N st Ave, Hotel 1000/Madison Tower Condos, Parcel ID #114 10/20/14 10/21/14 10/10/14 10/11/14 N Maynard Ave S., International Apartments, Parcel ID #46 10/27/14 10/28/14 N-7 (OMF) 312 Fairview N, South Lake Union Streetcar OMF 11/20/ /2014 Sou nd travels ou tward from the pointwhere itis generated. A s the d istance increases,sou nd levels are red u ced.n oise impacts were d etermined by calcu latingthe d istance from the trackcenterline to the location where the pred icted sou nd levels wou ld have an impact(based on impactlevels shown on Figu re 4.3-1).Itis assu med thatthere wou ld be an impact on any property within this noise bu ffer.these noise bu ffer d istances vary foreachnoise sou rce (ro lingnoise on track, crossovers,and be ls)and ad jacentland u se. A ccord ingto the noise mod el,operation alongthe alignment (withou tstations and stops)at25 mphwou ld resu ltin two mod erate impacts.these wou ld occu ralongthe alignmentat the Jackson Squ are C ond os and the FisherB u ild ing.this is shown in Table in the Streetcar colu mn. Impactbu ffers were calcu lated separately forstations,tracks between stations,crossovers,and forbe ls sou nd ed on approachand d epartu re from eachstation.a ccord ingto the mod el,the crossovers cou ld resu ltin eightmod erate and fou rsevere impacts atthe crossovers (see Table C rossover colu mn).in ad d ition,two mod erate impacts were pred icted from the be ls atthe stations. Noise at Crossover/Turnback Tracks W henastreetcarpassesover thecrossover(see photograph)itcanm akea clankingsound atadifferent frequency thanastreetcar travelingonanunbroken track.t herefore,crossover soundsarem odeled separately.crossovertracks m ay beused forturnbacks. TBG SEA MARCH 2016 ENVIRONMENTAL ASSESSMENT PAGE 4.3-7
132 NOISE AND VIBRATION Figure Noise Monitoring Locations and Impacts at 25 MPH TBG SEA MARCH 2016 ENVIRONMENTAL ASSESSMENT PAGE 4.3-8
133 NOISE AND VIBRATION Table Streetcar Noise Impact Summary Parcel ID Description (all Category 2 Receptors) Impact Locations Streetcar Wheels on Rail Bells Crossover Total Impact Modeled at 25 mph a Resulting Impact at Operating Speed of 15 mph or less 9 Don Hee Apts. - - Moderate Moderate None 44 Bush Hotel - - Moderate Moderate None 46 Far East Building - - Moderate Moderate None 49 Buty Building - - Moderate Moderate None 50 Governor Apts. - - Severe Severe None 63 Cadillac Hotel - - Moderate Moderate None 66 Jackson Square Condos Moderate Moderate Severe Severe None b 67 Fisher Building Moderate Moderate Moderate Severe None b 135 Hahn Building - - Moderate Moderate None Union Condos - - Severe Severe None 168 Westin Hotel - - Severe Severe None 170 Metropolitan Tower - - Moderate Moderate None a Lower speeds were modeled that indicated noise impacts are eliminated at these lower speeds. b Seattle streetcar bells at stations are measured to be lower than FTA model inputs and therefore moderate impacts from bells are avoided. Streetcar Noise Impacts. A loperationalimpacts pred icted forthe C enterc ity C onnectorat loweraverage travelspeed s of 15 mphwou ld be eliminated (P arcelid #s 66 and 67 )nearthe station stops. M od erate and severe noise impacts pred icted atthe crossovers wou ld be eliminated becau se (1) the speed of the trains nearstations and mix ed -flow traffic cond itions wou ld be mu chlowerthan the 25 mphu sed in the mod eland (2)the factthatactu alnoise measu rements of crossovers atthe existingsou thl ake Union alignmentare lowerthan the FTA M anu alinpu ts u sed in the mod el. Streetcarbe ls atstations wou ld have mod erate impacts on two properties (parcelid #66 and 67 ). H owever,the Seattle Streetcarbe ls are qu ieterthan the FTA stand ard levelforbe ls (based on measu rements mad e of streetcars on the ex istingsou thl ake Union line)d u ringnormal operations and are fu rtherd ecreased d u ringeveninghou rs,red u cingthe 24-hou rl d n u sed to pred ictimpacts reported in Table 4.3-6,whichis the measu rementu sed to assess impacts at C ategory 2 (resid ential)receptors. Operations and Maintenance Facilities Noise Impacts. N oise-generatingactivities (su chas u se of powertools and compressors)occu rinsid e maintenance bu ild ings atthe ex istingsou th L ake Union O M F withthe ro l-u pd oors closed ;the only activities thatoccu rou tsid e are hand - washingand cleaningof the streetcars.a s streetcars enterand ex itthe Sou thl ake Union O M F, typicaly at5 mphorless,warningbe ls sou nd.n oise monitoringof the ex istingfacility TBG SEA MARCH 2016 ENVIRONMENTAL ASSESSMENT PAGE 4.3-9
134 NOISE AND VIBRATION (locations shown on Figu re 4.3-3)revealed sou nd levels of L d n 7 3,whichinclu d es sou nd emissions from the O M F and otherambientnoise sou rces su chas traffic and localconstru ction. This existingcond ition wou ld resu ltin an impactthreshold of L d n 65,even thou ghthe existing ambientlevelis L d n 7 3,the u ppercriterialimitforfta is L d n 65.Streetcartraffic alongthe O M F access tracks were mod eled foreachoperatingscenario (6 more streetcars orconsolid ation al 16 streetcars).these operations,in ad d ition to crossoverand be lnoise emissions,are anticipated to resu ltin no noise impacts alongthese access tracks ateithero M F location. Vibration To d etermine ex istinggrou nd borne vibration levels alongthe L P A alignment,measu rements were mad e attwo representative locations to characterize the transfermobility(ameasu re of how efficiently vibration travels throu ghthe grou nd ).A third location is referenced from d atafrom anotherpu blic projectin the vicinity(see Figu re 4.3-4).V ibration propagation testingwas cond u cted on O ctober21,2014,at8 01 Second A venu e,the N orton B u ild ing,(p arcelid #109 [C ategory3] ),and 117 FirstA venu e S (P arcelid #94 [C ategory2] ).Testinglocations are shown on Figu re M easu red propagation losses (how qu ickly vibration attenu ates in the soilwith an increase in d istance from the sou rce)were consistentwithfta gu id elines forgeneral vibration analysis.testresu lts also d emonstrated thatan areaway (whichare like awalkable basementlocated u nd erthe sid ewalks)presented ared u ced levelof vibration in the soilabove and on the opposite sid e of the areaforthe same inpu tforce nearthe alignment.itis likely that the areaway red u ces the amou ntof grou nd borne vibration,becau se of the d iscontinu itybetween the soiland areaway.a reaways are onlyaconcern forvibratoryd amage.a n arreaway 3 wou ld notex perience vibration atlevels thatcou ld resu ltin d amage. V ibration emissions from streetcaroperations u nd ertypicaltrackcond itions (withou tcrossovers) were calcu lated in accord ance withfta Manual, Chapter 10, General Vibration Assessment (FTA,20 0 6).Usingcompu tation method ologies in the FTA M anu al,and the L P A operation inpu tof 25miles perhou r,vibration levels were calcu lated at50 feet(as requ ired bythe FTA M anu al)foratypical2-story masonry bu ild ingfortypicaloperations and forareas where crossovers may affectvibration levels.resu lts are listed in Table Table Predicted Streetcar Groundborne Vibration and Noise Levels at 50 feet for a Two-Story Masonry Building Receptor Description VdB dba Streetcar Operations Crossover V ibration impacts were d etermined by calcu latingthe d istance between the trackcenterline to equ althe impactthreshold (as shown in Table 4.3-3).A ny receptorwithin these bu fferd istances (whichvary by vibration sou rce trackworkversu s crossover and by receptorcategory)that equ als the threshold wou ld be associated withapred icted grou nd borne noise orvibration level thatex ceed s the criteriaand is thereby id entified as apotentialimpact.receptors beyond that 3 Areaway are typically under the sidewalk attached to the building as an extended basement. The Center City Connector is proposed in the center lanes of the roadway; therefore, the streetcar would be at least one travel lane, or approximately 11 to 12 feet, away from the areaways. The exception is along Stewart Street, but no vibratory impacts are anticipated at levels that would induce damage. TBG SEA MARCH 2016 ENVIRONMENTAL ASSESSMENT PAGE
135 NOISE AND VIBRATION Figure Vibration Monitoring and Vibration Impacts TBG SEA MARCH 2016 ENVIRONMENTAL ASSESSMENT PAGE
136 NOISE AND VIBRATION impactbu fferd istance wou ld ex perience vibration levels below the FTA impactcriteriaand wou ld notresu ltin avibration impact. A receptoris consid ered affected if the impactbu fferex tend s into the property bou nd ary,which is conservative in the case of abu ild ingthatis setbackfrom the parcelbou nd ary.table lists the locations and sou rces of potentialvibration impacts (where the impactbu fferex tend s into the propertybou nd ary),and Figu re above shows the locations withrespectto the L P A. Table Streetcar Operational Vibration Impacts for the LPA Parcel ID Address Description Category Streetcar or Crossover S Jackson St Washington Federal 3 Crossover S Jackson St Governor Apartments 2 Crossover S Jackson St Washington Shoe Co. 3 Crossover Occidental Ave S Occidental Mall 3 Crossover S Jackson St Jackson Square Condos 2 Crossover th Ave Westin Hotel 2 Crossover Terry Ave N Institute for Systems Biology 1 Streetcar and Crossover The fo lowingsections presentabrief analysis of the receptors where vibration impacts were pred icted.the analysis to d etermine the impacts d escribed in Table above assu med atwostory masonry bu ild inglocated on the lotline,whichpresented aconservative analysis case.for althe id entified impacts,refinements to the analysis were mad e on aproperty-by-property basis to investigate vibration impacts based on actu albu ild ingsize,d istance from the alignment,and lowestfloorof vibration-sensitive u se. 601 S Jackson Street, Washington Federal (Parcel ID #45). This propertyinclu d es atwostory office bu ild ing38 feetfrom the alignment,withminimalsetback.the 2-d B floor-to-floor attenu ation wou ld red u ce the second floorto below the impactcriteriaof 7 5V d B.A ccou nting foraslowertravelspeed alongthis portion of the alignment(15 mph,bu tlikely slower),there wou ld be no affected receptors. 526 S Jackson Street, Governor Apartments (Parcel ID #50). This propertyinclu d es atwostory bu ild ing57 feetfrom the alignment,withminimalsetback.the firstflooris retailu se, whichis notvibration-sensitive.the 2-d B floor-to-floorattenu ation wou ld red u ce the second floorto below the impactcriteriaof 7 2 V d B.A s aresu lt,there wou ld be no affected receptors. 157 S Jackson Street, Washington Shoe Co. (Parcel ID #62). This propertyinclu d es asixstory bu ild ing27 feetfrom the alignment,withminimalsetback.the firstflooris retailu se, whichis notvibration-sensitive;alremainingfloors are commercial.the ex tra3-d B cou pling loss and 2-d B floor-to-floorattenu ation wou ld red u ce the second floorto below the impact criteriaof 7 5V d B.A s aresu lt,there wou ld be no affected receptors. 308 Occidental Avenue S, Occidental Mall (Parcel ID #64). This property inclu d es asix-story bu ild ing27 feetfrom the alignment,withminimalsetback.the firstflooris retailu se,whichis notvibration-sensitive;alremainingfloors are commercial.the ex tra3-d B cou plingloss and 2- TBG SEA MARCH 2016 ENVIRONMENTAL ASSESSMENT PAGE
137 NOISE AND VIBRATION d B floor-to-floorattenu ation wou ld red u ce the second floorto below the impactcriteriaof 7 5 V d B.A s aresu lt,there wou ld be no affected receptors. 123 S Jackson Street, Jackson Square Condos (Parcel ID #66). This propertyinclu d es atwostory bu ild ing31 feetfrom the alignment,withminimalsetback.the firstflooris retailu se, whichis notvibration-sensitive,and the second flooris resid entialu se.the 2-d B floor-to-floor attenu ation wou ld notred u ce the second floorto below the impactcriteriaof 7 2 V d B. A ccou ntingforaslowertravelspeed alongthis portion of the alignment(15 mph,bu tlikely slower),there wou ld be no affected receptors Fifth Avenue, Westin Hotel (Parcel ID #168). This propertyinclu d es a37 -storybu ild ing 43 feetfrom the alignment,withminimalsetback.the firstflooris retailu se,whichis not vibration-sensitive;alotherfloors are resid entialu se.the ex tra6-d B cou plingloss d u e to the size of the bu ild ingand 2-d B floor-to-floorattenu ation wou ld red u ce the second floorto below the impactcriteriaof 7 2 V d B.A s aresu lt,there wou ld be no affected receptors. 401 Terry Avenue, Institute for Systems Biology (Parcel ID #178). This propertyinclu d es a fou r-storybu ild ing30 feetfrom the alignment.the entire bu ild ingappears to be u sed for biomed icalresearch,whichcan be vibration-sensitive.the ex tra3-d B cou plingloss and 2-d B floor-to-floorattenu ation is notex pected to red u ce any floors to below the impactcriteriaof 65 V d B.H owever,itis importantto note thatthis crossoveris an ex istingelementof the Sou th L ake Union Streetcarline.A lthou ghthis crossovermaybe u sed byc enterc ityc onnector streetcars enteringand d epartingrevenu e service viathe Sou thl ake Union O M F,the C enter C ity C onnectoris notex pected to increase ex istingvibration impacts becau se the proposed projectstreetcars are ex pected to prod u ce the same vibratory effects as ex istingstreetcars and becau se longerormore frequ entvibration events d o notchange the impactlevel.therefore, there wou ld be no affected receptors d u e to the ad d ition of asecond crossoverand higher streetcartraffic on the ex istingcrossover.forimpacts d u e to streetcaroperations,the Sou thl ake Union Streetcaralignmentcu rrently ex ists eastof the bu ild ing.the C enterc ity C onnector projectwou ld only be ad d ingad d itionaltracknorthof the bu ild ing,whichis notex pected to increase ex istingvibration levels in the bu ild ing First Avenue, Market House Condos (Parcel ID# 140). This propertyinclu d es athreestory bu ild ing52 feetfrom the alignment,withminimalsetback.the firstflooris retailu se, whichis notvibration-sensitive;alotherfloors are resid entialu se.the ex tra3-d B cou plingloss d u e to the size of the bu ild ingand 2-d B floor-to-floorattenu ation wou ld red u ce the second floor to below the impactcriteriaof 7 2 V d B.A s aresu lt,there wou ld be no affected receptors. Construction Impacts Noise The FTA M anu ald oes notprovid e stand ard ized criteria ford eterminingnoise impacts from constru ction and typicaly d efers to cod ified noise levels setby localju risd ictions (see Section 3.4.2,O perations and M aintenance Facilities).H owever,the FTA M anu ald oes provid e reasonable criteriaforassessment to ind icate apossible ad verse commu nity reaction. These criteriaare shown in Table TBG SEA MARCH 2016 ENVIRONMENTAL ASSESSMENT PAGE
138 NOISE AND VIBRATION Table FTA Construction Noise Impact Criteria Hourly L eq (dba) Land Use Daytime Nighttime Residential Commercial Industrial Source: FTA Manual, Chapter 12. A d d itionalalowances are provid ed in the SM C (Seattle N oise C ontrolc od e SM C C hapter )forconstru ction activities,raisingthe permissible levels forconstru ction equ ipment,and alowingd aytime limits between 7 a.m.and 10 p.m.on weekd ays and 9 a.m.and 10 p.m.on weekend s and legalholid ays.o u tsid e these constru ction hou rs,lowersou nd levellimits d iscu ssed in Section wou ld apply.these lowerlimits also apply insid e commercial bu ild ings when alwind ows and d oors are closed d u ringthese constru ction hou rs.sou nd emissions thatexceed the SM C wou ld requ ire anoise variance from the C ity of Seattle. FTA method ologies forageneralassessment(fta M anu al,c hapter12,n oise and V ibration d u ringc onstru ction)inclu d e id entifyingthe two lou d estpieces of equ ipmentforeach constru ction stage,operatingthem simu ltaneou sly for1 hou r,and comparingthe mod eled sou nd levels to the FTA criteria.this conservative approachwillikely overestimate sou nd emissions from constru ction,whichwou ld vary from hou rto hou r.h owever,withlimited information related to equ ipment,means and method s,and constru ction sequ encingatthis early stage of d esign,the FTA M anu alencou rages this conservative approach. C onstru ction inclu d es d emolition of asphalts and potentialyof abu ild ingon the proposed Sou th L ake Union O M F expansion area.h owever,the two lou d estend u ringconstru ction activities for the C enterc ity C onnectorare anticipated to be removalof ex istingpavementand instalation of trackwork.removalof ex istingpavementwou ld requ ire jackhammeringand hau lingof materials.trackworkwou ld requ ire u singarailsaw and bringingin and removingconcrete by tru ck.sou nd emission pred ictions at50 feetfrom associated activities are shown in Tables and Table Construction Noise General Assessment for Removal of Existing Pavement Equipment Emission Level at 50 feet (dba) Usage Factor SPL at 50 feet (dba) Jackhammer Haul Truck Total 91 TBG SEA MARCH 2016 ENVIRONMENTAL ASSESSMENT PAGE
139 NOISE AND VIBRATION Table Construction Noise General Assessment for Installation of Trackwork Equipment Emission Level at 50 feet (dba) Usage Factor SPL at 50 feet (dba) Rail Saw Concrete Truck Total 91 Sou nd levels of 91 d B A (hou rly L eq)were pred icted forbothpavementremovaland trackwork. This is below the FTA noise criteriaforcommercialu se properties (100 d B A )bu twou ld exceed boththe d aytime (90 d B A )and nighttime (8 0 d B A )criteriaforresid entialu se properties.the pred icted sou nd levelexceed s the 8 5d B A sou nd -levellimitestablished by the C ityof Seattle. W hen constru ction activities occu r50 ormore feetfrom bu ild ings,sou nd -levellimits insid e bu ild ings located on commercialzoned properties are typicaly satisfied.h owever,when work occu rs closer,noise controlmeasu res may be requ ired to satisfy interiorsou nd -levellimits. C ontractors wou ld be requ ired to meetthe criteriaof the noise ord inance forthe city within whichthey are working.c onstru ction ou tsid e normalweekd ay hou rs (i.e.,7 a.m.to 10 p.m.) wou ld requ ire anoise variance. Vibration C onstru ction vibrations potentialy cau se avariety of effects,rangingfrom influ ence on vibration-sensitive equ ipmentand potentialslightd amage to bu ild ings atthe highestvibration levels.in mostcases,the main concern forconstru ction vibration is potentiald amage to stru ctu res.m ostconstru ction processes d o notgenerate vibration levels thatapproachd amage criteria.the threshold s forbu ild ingd amage are one to two ord ers of magnitu d e higher (approx imately 20 to 40 d B )than criteriaforannoyance.a ssessmentcriteriaforbu ild ing d amage d epend on the type of bu ild ingconstru ction;assessmentcriteriaforannoyance d epend on receptorland u se,withthe same receptorclassifications and criteriaas streetcaroperational vibration.fta criteriaforassessingbu ild ingare shown in Table ,L ightweighttimber bu ild ings are associated withlowerbu ild ingd amage threshold s than those bu iltwithheavier steeland concrete.w hile the V d B metric and land u se are u sed forannoyance assessment,the P P V metric and bu ild ingconstru ction type are u sed to assess potentialbu ild ingd amage. Table Construction Vibration Criteria Building Damage Building Category PPV (in/sec) a I. Reinforced concrete, steel or timber (no plaster) 0.5 II. Engineered concrete and masonry (no plaster) 0.3 III. Non engineered timber and masonry 0.2 IV. Buildings extremely susceptible to vibration damage 0.12 Source: FTA Manual, Table a in/sec = inch per second TBG SEA MARCH 2016 ENVIRONMENTAL ASSESSMENT PAGE
140 NOISE AND VIBRATION A s abasis forcalcu latingvibration levels from constru ction activities,the FTA M anu alinclu d es vibration levels forconstru ction equ ipmentcommonly associated withhigherlevels of vibration. Table lists project-specific vibration sou rces forthe constru ction activities anticipated for the L P A. Table Construction Vibration Sources Equipment PPV (in/sec) Levels at 25 feet VdB Vibratory Roller Hoe Ram (hydraulic breaker) Large Bulldozer Loaded Trucks Jackhammer Source: FTA Manual, Table The su sceptibilityford amage is based on the bu ild ingstru ctu re,d istance from the activity,and the amou ntof vibration generated bythe activityitself.b ased on and evalu ation of the bu ild ings presentalongthe L P A,bu ild ingd amage d u e to constru ction vibration is notanticipated. A reaways (portions of bu ild ings thatare located u nd erthe sid ewalk)located nearthe track alignmentwere also reviewed forpotentialcosmetic d amage from constru ction vibration.the closestareaways were investigated throu ghphoto d ocu mentation provid ed by SD O T.B ased on this review,these areaways are mostlikely associated withb u ild ingc ategory III.There is a possibility of cosmetic d amage if the constru ction equ ipmentlisted in Table are closerto the areaways than the recommend ed bu fferlimits. A significantnu mberof receptors alongthe L P A alignmentare within the vibration impact bu fferd istances,whichind icates the potentialforannoyance d u ringconstru ction.a nnoyance impacts are estimated atmore than 50 percentof alreceptors d u ringvibratory ro leru se and at approx imately 25 percentof alreceptors d u ringjackhammeru se.this type of constru ction is consistentwithroad way improvementand u tility projects thathave been common in the vicinity. Table Construction Vibration Building Damage Impact Buffers Equipment Building Category I II III IV Vibratory roller 14 feet 20 feet 26 feet 36 feet Hoe ram (hydraulic breaker) 8 feet 11 feet 15 feet 20 feet Large bulldozer 8 feet 11 feet 15 feet 20 feet Loaded trucks 7 feet 10 feet 13 feet 18 feet Jackhammer 4 feet 6 feet 8 feet 11 feet TBG SEA MARCH 2016 ENVIRONMENTAL ASSESSMENT PAGE
141 NOISE AND VIBRATION Mitigation Measures Operation Noise Mitigation. N oise impacts are notanticipated from streetcaroperations (steel wheels on rails,crossovers and be ls)alongthe entire C enterc ity C onnectoralignment. H owever,noise from streetcarbe ls atstations wilbe verified withfinaloperatingparameters, and if noise impacts resu lt,sd O T wilred u ce the be lsou nd levels,orrelocate the be ls,to red u ce noise to below FTA impactlevels. Operational Vibration Mitigation. V ibration impacts are notanticipated from streetcar operations alongthe entire C enterc ity C onnectoralignment;therefore,mitigation is not proposed.the one ex ception is 40 1 Terry A venu e,whichhas ex istingtrackworkand crossover ad jacentto the bu ild ingas partof the Sou thl ake Union Streetcaralignment.The C enterc ity C onnectoris notex pected to increase this ex istingcond ition.if d etermined necessary,sd O T wilcond u ctamore d etailed vibration assessmentd u ringfinald esign to confirm the resu lts of the initialmod eling.if itconfirms an ex istingimpact,sd O T wilred u ce the vibration to acceptable levels by relocatingthe crossover,u singspring-load ed frogs to red u ce the gapsize between rails,oru singresilienttrackfasteners. Construction Noise Mitigation. To satisfy SM C forany constru ction activity,anoise control plan wilbe d eveloped and implemented to red u ce commu nity annoyance.the noise controlplan wilinclu d e,bu tnotbe limited to,the fo lowing: M aintain a1-foot-thicklayerof mu ckord irtin the bottom of hau ltru ckbed s. Use only ambient-sensingbroad band backu palarms and minimize backingu p. L imitengine id lingto 5minu tes orless. Use rad ios forlong-range commu nication;onlyu se raised voices and pu blic ad d ress systems in an emergency. Use u pgrad ed engine exhau stmu fflers,engine shrou d s,orsou nd enclosu res on noisier equ ipment. Instalportable sou nd barrierarou nd noisierequ ipment. Use electric and hyd rau lic equ ipmentinstead of d ieselorpneu matic equ ipment. Requ ire the contractorto d evelopanoise controlplan to id entify and mitigate noise impacts based on specific means and method s. D evelopnoise limits,ad d ress complaints,and monitornoise levels d u ringconstru ction. O btain anoise variance forworkperformed atnight. Construction Vibration Mitigation. To minimize annoyance from constru ction-related vibration,sd O T wild evelopand implementavibration controlplan.the plan requ ires thatthe contractor: Selecthau lrou tes to avoid areas withhigherresid entiald ensity,as feasible. P hase vibration-prod u cingactivities so they d o notoccu rsimu ltaneou sly,as feasible. Sched u le vibration-prod u cingactivities ou tsid e time period s where nearby bu ild ings are mostsensitive to vibration,as feasible.forex ample,ex ecu te vibration-prod u cingwork nearresid entialbu ild ings d u ringd aytime hou rs and commercialbu ild ings d u ring nighttime hou rs. TBG SEA MARCH 2016 ENVIRONMENTAL ASSESSMENT PAGE
142 NOISE AND VIBRATION M inimize the u se of impacttools,su chas hoe rams and jackhammers;u se lowervibration equ ipment,su chas concrete saws,ford emolishingex istingpavement. Use lowerpowersettings on vibratory ro lers orlarge static ro lers,as feasible. Requ ire the contractorto d evelopavibration controlplan to id entify and mitigate vibration impacts based on specific means and method s. Construction Vibration Mitigation in Areaways. To completely avoid riskof cosmetic d amage to areaways,heavy/strongvibratory constru ction equ ipmentwilmaintain abu fferfrom the areaways of 8 feetto 26 feet,su chthatvibration nearareaways d o notexceed to 0.2 P P V (inches/second ). TBG SEA MARCH 2016 ENVIRONMENTAL ASSESSMENT PAGE
143 LAND USE 4.4 Land Use C hanges in transportation systems can influ ence changes in nearby land u ses.a projectcan d irectly affectland u se throu ghproperty acqu isition orind irectly by influ encingd evelopmentor red evelopmentin the area.this section evalu ates potentialimpacts on ex istingand fu tu re land u ses and zoningfrom the C enterc ityc onnector. The stu d y areaforthe land u se analysis is approximately1,000 feetarou nd the proposed streetcartrackway,tu rnbacktracks,o M Fs and access track,and TP SS locations.italso inclu d es the areawithin a0.25 mile of the proposed stations.given the d istance between proposed station locations,the stu d y areaalongthe L P A forms a0.25 mile zone orswathalongthe proposed projectcorrid or(see Figu re 4.4-1). The stu d y areainclu d es the aread esignated in the C ityof Seattle C omprehensive P lan as the D owntown Urban C enter (C ity of Seattle,20 0 5).This is aheavily d eveloped,high-d ensity area,withamix of commercial,office,resid ential,and retailu ses.e x istingu ses within the D owntown Urban C enterinclu d e office bu ild ings,parkinglots,retailstores/services, hotels/motels,governmentservices,mu ltifamily resid ential(inclu d ingafford able hou sing), warehou ses,vacantland,parks,artgaleries,au d itoriu ms,religiou s services,and sports facilities. The Seattle C omprehensive P lan (C ityof Seattle,2005)has d esignated u rban vilages that comprise the D owntown Urban C enter,as shown on Figu re and brieflyd escribed : South Lake Union is transitioningfrom low to mod erate resid ential,office and light ind u strialto higherd ensity hou sing,withresearch and d evelopmentoffice bu ild ings.the C ity s goal forthis vilage is of alivable,walkable commu nity thatis we lserved by transitand easy to getarou nd by foot,bike,ortransit. The Denny Triangle is amix ed -u se neighborhood thatcombines commercialoffice space,retailsales and services,socialand pu blic services,and aresid entialpopu lation.the C ity s goalforthe D ennytriangle is to red u ce the impacts from throu ghtransportation while improvinginternalaccess and circu lation. Belltown is amix ed -u se neighborhood withan emphasis on aresid entialpopu lation and smal bu siness activity.the C ity s goalforb e ltown V ilage is to provid e an areawhere people can live,work,shop,and play in bothb e ltown and alof the d owntown areawithou tacar. The Commercial Core is amajoremployment Key S eattlel andu se Definitions M ixed U se:a blendingof developm entincludingresidential, office,retail,and som etim eslight industrialuses. U rbancenter:areasofhigherdensity developm ents. U rbanvilage:n eighborhoods w ithuniqueidentitiesofparticular land uses(w hilealincludem ixed uses,som eem phasizeresidential orofficeuses). M anufacturing/industrial Centers:Areasofindustrial businesses. center,tou ristand convention attraction,shoppingmagnet,resid entialneighborhood,and regionalhu b of cu ltu raland entertainmentactivities.a C ity s primary goalforthe C ommercialc ore is to workwithtransitprovid ers to promote convenienttransitand pu blic access to and throu ghthe C ommercialc ore. TBG SEA MARCH 2016 ENVIRONMENTAL ASSESSMENT PAGE 4.4-1
144 LAND USE Pioneer Square is ad iverse commu nity withasignificantresid entialpopu lation and an eclectic mix of bu sinesses and majorcommu nity facilities.the C ity s goalforp ioneer Squ are is to promote acommu nity withan efficienttransportation system thatprovid es efficientaccess to sites insid e and ou tsid e neighborhood bou nd aries. The Chinatown-International District inclu d es thrivingbu sinesses,organizations,and cu ltu ralinstitu tions.the C ity s goalis to create an accessible neighborhood,withaccess within and to the neighborhood,foraltransportation mod es,while encou ragingless d epend ence on cars and greateru se of transit,bikes,and walking. The Duwamish Manufacturing Industrial Center is located sou thof P ioneersqu are and the C hinatown-internationald istrictand,while itconsists mainly of ind u strialrelated u ses,itd oes inclu d e the head qu arters forstarbu cks,the P ortof Seattle,and Safeco Field.The C ity s goalforthe areato retain and ex pand manu factu ringand ind u strialactivity. Seattle s C omprehensive P lan (C ityof Seattle,2005)forthe D owntown Urban C enter encou rages d evelopmentactivities to maintain d owntown Seattle as the mostimportantof the region s u rban centers.fu tu re planned mixed -u se land u ses inclu d e mu ltiple zoningcategories, atd ensities cateringto eachu rban vilage s u niqu e characteristics. Zoningforthe stu d y area,shown on Figu re 4.4-2,primarily consists of mixed u ses.o f the zoningcategories in the stu d yareabou nd aries,abou t8 9 percentis related to some type of mixed u se withthe remaining10 percentd ivid ed between ind u strial(abou t9 percent)and resid ential (abou t2 percent).in the areas ad jacentto the alignment,higherd ensities are alowed,consistent withthe Seattle D owntown C ore zoning.m ostof the areas eastof the alignmentare zoned fora higherd ensityof office and commercialu ses,and theyinclu d e D owntown O ffice C ore and D owntown RetailC ore.the areas to the westof the alignmenthave amixtu re of zoning categories thatalows ahigherd ensityof hou sing.this areainclu d es the P ike M arketm ixed, where the P ike M arketh istoricalc ommission has review au thorityoverland u se d ecisions in the interestof maintainingthe P ike P lace M arketcharacter.the sou thern portion of the alignmentis located in the P ioneersqu are M ixed zone,whichis similarto the P ike M arket M ixed zone in thatthe P ioneersqu are H istoricalc ommission reviews and mayd isalow u ses not aligned withthe neighborhood s historic character.fu rtherwestin the stu d y area,the D owntown H arborfrontzone alows primarily commerciald evelopmentatasmalerscale.there are also areas zoned forind u strial-related u ses in sou thernmostportion of the stu d y area. The areato the northassociated withthe proposed O M F expansion in Sou thl ake Union inclu d es zoningthatalows forarange of u ses and encou rages ad ense,mixed -u se neighborhood. The areaarou nd the C hinatown-internationald istricto M F is zoned forind u strial-related u ses to the sou thand amixtu re of u ses inclu d ingthe InternationalD istrictm ixed to the north.finaly, the areaassociated withthe single trackon Repu blican Streetis zoned to alow amix tu re of commercialand resid entialu ses Impacts No Build Alternative The N o B u ild A lternative wou ld notresu ltin changes to cu rrentorplanned land u ses.the majority of the stu d y areais lined withhigh-d ensity d evelopmentand severalmore high-d ensity TBG SEA MARCH 2016 ENVIRONMENTAL ASSESSMENT PAGE 4.4-2
145 LAND USE Figure Urban Villages in Downtown Urban Center and the Center City Connector Study Area TBG SEA MARCH 2016 ENVIRONMENTAL ASSESSMENT PAGE 4.4-3
146 LAND USE Figure Zoning in the Center City Connector Study Area TBG SEA MARCH 2016 ENVIRONMENTAL ASSESSMENT PAGE 4.4-4
147 LAND USE projects are cu rrentlyu nd erconstru ction alongand beyond the stu d y area.seattle s C enterc ity neighborhood s have asignificantconcentration of hou sehold s and employment.these neighborhood s are forecastto see employmentgrowthof 63 percentand resid entialpopu lation growthof 44 percentby 2030 (SD O T,2012).The N o B u ild A lternative is inconsistentwith Seattle s TransitM asterp lan (TM P ;SD O T,2012), 1 whichid entified the C enterc ityc onnector projectas atoppriority fortransitinvestment Locally Preferred Alternatives Operational Impacts Consistent with the City s comprehensive plan, the C enterc ity C onnectorwou ld provid e a convenient,reliable and frequ enttransitservice thatconnects the neighborhood s in the stu d y area withthe neighborhood s cu rrently served by the Sou thl ake Union and FirstH ilstreetcarlines. In the Seattle C omprehensive P lan,the C enterc ity C onnectoris intend ed to su pport d evelopmentof transitconnections between u rban vilages.this concept,referred to as the Urban V ilage TransitN etwork,encou rages concentration of high-qu ality transitservice to su pportfu tu re d evelopmentalongtravelcorrid ors. The C enterc ity C onnectorwou ld improve linkages withothertransitservices,neighborhood s, and commercialcenters in the stu d yareaand beyond,as we las improve ped estrian access, whichwou ld benefitpeople who live,work,orvisitthe stu d y areaand the neighborhood s beyond.itwou ld also assistin accommod atingtravelneed s forthe projected economic and resid entialgrowth.the C enterc ity C onnectoris consistentwiththe goals and policies id entified in the C ity s comprehensive plan,as we las otherregional,state,and localplans.m any of these plans inclu d e goals and policies to improve transitaccessibility and su pportgreaterd ensities and mixtu res of land u ses.a ppend ix D 4.4 provid es d etails abou trelevantplans,goals,and policies, as we las information abou thow the C enterc ity C onnectorwou ld consistentwiththese plans. Property Acquisitions. The proposed trackway forthe L P A wou ld be constru cted in ex isting C ity of Seattle right-of-way;therefore,no conversions of ex istingorplanned land u ses wou ld be necessary forthe trackalignment.h owever,easements orlong-term leases of less than 0.1 acre maybe requ ired foru pto two TP SS stru ctu res thatwou ld be located in existingparkinggarages (Sites 2,4,5,and /or6)(see Figu re ).A lso,tp SS #1 may requ ire aportion of W estlake Squ are,whichis owned by the Seattle P arks D epartment;however,mostof the TP SS wou ld be within pu blic right-of-way,and becau se the u se and fu nction of the squ are (ped estrian triangle) wou ld notchange,the TP SS wou ld notrequ ire aconversion from parkto transportation u se. Storage forthe ad d itionalstreetcarvehicles wou ld requ ire ex pansion atone orboththe Sou th L ake Union and C hinatown-internationald istricto M Fs on land s cu rrently owned bythe city 1 The 2012 TMP supplanted Seattle Transit Plan (2005). Multiple studies support the TMP. The Center City Circulation Study, completed in 2003, considered several independent transportation projects that affect the Center City. A central recommendation of the study was to create a fast, frequent, reliable, and legible transit network that connects the City s urban centers and urban villages to each other and to the Center City. It also recommended upgraded connections that facilitate connectivity and circulation within the Center City itself. The Center City Access Strategy, initiated in 2004, promoted the recommendations of the Center City Circulation Study. The Seattle Streetcar Network Development Report (SDOT, 2008) evaluated route options for the most promising potential streetcar corridors and routes in the Seattle Streetcar Network Concept that was approved by the City Council in February 2008 (City of Seattle, City Council Resolution Number 31042, For more information, see the Center City Connector Transit Study, Purpose and Need (SDOT, 2013). TBG SEA MARCH 2016 ENVIRONMENTAL ASSESSMENT PAGE 4.4-5
148 LAND USE and zoned appropriately (mix ed and commercial/ind u strial,respectively)forpu blic facilities (inclu d ingtransportation u ses).e x pansion on these sites wou ld notchange d evelopmentpatterns orland u ses on ad jacentproperties becau se the u se of the facilities wou ld be consistentwiththe ex istingand planned u ses. Changes to Land Use Patterns. The C enterc ity C onnectoris notex pected to change land u se patterns as aresu ltof operations.a s stated u nd erthe N o B u ild A lternative,infild evelopmentis occu rringregard less of the projectand is consistentwiththe C ity of Seattle s C omprehensive P lan (C ityof Seattle,2005).A lthou ghthe D enny Triangle has some vacantand u nd eru tilized land s zoned forhigher-d ensityand the Sou thl ake Union u rban vilage has infilopportu nities, growthin these areas are occu rringregard less of the projectand wou ld be consistentwiththe C ity of Seattle s comprehensive plan (C ity of Seattle,20 0 5).Streetcarstations have been id entified to serve the ex istingand forecasted need forenhanced accessibility to established d estinations.therefore,stations are notanticipated to be acatalystof more growthbu tratherare located to serve d ense areas where mobilityoptions are need ed. The expansion of one orbotho M Fs wou ld notaffectland u se patterns,becau se theyare alread y within zones thatpermitsu chu ses and have notaffected land u se thu s far.the ad d ed trackon Repu blican Streetbetween W estlake and Terry A venu es wou ld ad d anothertransportation fu nction on the existingroad way,whichis an alowed u se. Construction Impacts C onstru ction of the L P A wou ld have temporaryvisu aland noise impacts on ad jacentland u ses bu twou ld notresu ltin permanentchanges.c onstru ction activities wou ld inclu d e the presence and movementof equ ipmentand materials,introd u ction of lights fornight-time work,storage of constru ction materials,and generalvisu alchanges in the viewed land scape d u ringconstru ction (see Section ,C onstru ction,foramore d etailed constru ction d escription).m easu res to minimize noise and visu alimpacts are id entified in Sections 4.3 and 4.7,respectively.Impacts associated withthe approx imately 2-yearconstru ction period wou ld end once constru ction is complete.impacts wou ld be less than 8 months forany particu larneighborhood alongthe rou te. The exception to this wou ld be Segment4 (W estlake),where the constru ction d u ration maybe longerbu twou ld be limited to evenings and weekend s.this wou ld extend the constru ction period forsegment4 compared to the othersegments bu twou ld red u ce conflicts withpeakd aily commu te period s and withthe commercialactivities thatd ominate StewartStreet.Therefore,no impacton land u ses is anticipated to occu rfrom constru ction. SD O T wou ld avoid orminimize constru ction-related access and parkingimpacts on office and commercialu ses throu ghmeasu res d eveloped as partof aconstru ction managementplan (su ch as maintainingthrou gh-traffic on two lanes,signage,constru ction u pd ates,and apromotion and marketingplan to assistbu sinesses in maintainingtheircu stomerbase).referto Section 4.1, Transportation,and Section 4.5,E conomics,formore information on constru ction impacts and mitigation measu res related to loss of parkingand bu sinesses.these short-term impacts (u nd er8 months in anyconstru ction segment)wou ld notresu ltin changes to land u ses Mitigation Measures N o mitigation specific to land u se wilbe requ ired. TBG SEA MARCH 2016 ENVIRONMENTAL ASSESSMENT PAGE 4.4-6
149 ECONOMICS 4.5 Economics Transportation projects can change access, travel patterns, property conditions, jobs, and tax base, all of which can affect the local and regional economy. This analysis evaluates potential localized and regional effects of the Center City Connector. The local economy surrounding the project area is represented by the Seattle Center City downtown area and the regional economy is represented by the city and four-county region (King County, Snohomish County, Pierce County, and Kitsap County). To define the local economy, projections of population and economic growth for Seattle were obtained from PSRC; PSRC uses Forecast Analysis Zones (FAZ), which are geographic areas that align with US Census tract boundaries. Each FAZ can contain from one to nine census tracts The local study area for the City Center Connector is spread across four FAZs: 6010 (Seattle Central Business District), 6020 (Denny Regrade), 6123 (South Lake Union/Seattle Center), and 5825 (Industrial District), as shown on Figure The local study area includes major employment centers, tourist attractions, retail businesses, and hotels that generate trips to and from the area. Major employers include Amazon, the Bill and Melinda Gates Foundation, the City of Seattle, Westlake Center, regional medical centers, and other businesses in the commercial core of Seattle. Also, in the study area, tourist attractions include the Seattle Center, Seattle Art Museum, Seattle Aquarium, the waterfront, Westlake Center, and Pike Place Market. Between 2000 and 2010, the study area s population growth rate was twice that of Seattle and the four-county region (Table 4.5-1). This trend is expected to continue between 2010 and 2040 but at a slower average annual growth rate. Table Historical and Projected Population Area Average Annual Growth Rate Study Area 35,990 47,055 86, % 2.0% Seattle 563, , , % 0.6% Four-County Region Source: PSRC (2014). A pplicabler egulations Under CEQ, NEPA regulations (40 CFR ) require an analysis of social and economic impacts in EA-level documents. Executive Order and other Environmental Justice regulations requires an economic analysis if a transportation project is likely to have a substantial adverse effect on a large segment of the economy or cause the loss of more than 10 percent of the permanent jobs within the study area. Projects that displace homes or businesses and change travel patterns, travel times, parking, land use, and access control also require analysis. 3,275,847 3,690,942 5,037, % 1.0% TBG SEA MARCH 2016 ENVIRONMENTAL ASSESSMENT PAGE 4.5-1
150 ECONOMICS Figure Center City Connector FAZ Area Map TBG SEA MARCH 2016 ENVIRONMENTAL ASSESSMENT PAGE 4.5-2

151 ECONOMICS As shown in Table 4.5-2, between 2000 and 2010, the study area s average annual household growth rate was over three times higher than that of Seattle or the four-county region. The annual household growth rate in the study area is expected grow at a slower average annual growth rate when compared to more recent housing trends but is still expected to be higher than that of Seattle or the four-county region. Table Historical and Projected Household Data Area Number of Households Average Annual Growth Rate Local Study Area 19,276 28,304 47, % 1.7% Seattle 258, , , % 0.7% Four-County Region 1,282,984 1,454,695 2,059, % 1.2% Source: PSRC (2014). Employment data from the PSRC is divided into five sectors: (1) manufacturing/warehousing, transportation, and utilities [WTU]; (2) retail/food services; (3) financial, insurance, and real estate/services [FIRES]; (4) government/education; and (5) construction resources. Total employment in the study area is projected to increase from approximately 210,000 jobs in 2010 to approximately 340,000 jobs in 2040, an increase of 130,000 jobs (62 percent increase). The FIRES sector has the largest share of total employees, accounting for approximately 60 percent of employment in 2010 (see Figure 4.5-2). The next largest sector is government/education, which accounted for 16 percent of employment. The FIRES sector is forecast to increase its share of total jobs in the study area by 7 percent by 2040 (see Figure 4.5-3). The largest decline in share of jobs is forecast within the government/education sector, which is projected to decrease by 6 percent compared with Figu re P erc entof Total Em ploym entby Ind u stry S ec tor(2010) TBG SEA MARCH 2016 ENVIRONMENTAL ASSESSMENT PAGE 4.5-3

152 ECONOMICS Although the unemployment trends of Seattle and the state generally reflect the movement of the national unemployment rate, both Seattle and the state have a lower rate than the nation as a whole. Figure shows the high unemployment rates of 2009 in Seattle, the state, and the United States, and the recovery through Median household income in Seattle is slightly higher than the state and national median. According to the U.S. Bureau of Census, estimated median household income in Seattle was approximately $63,470 in Median household income was $59,374 in the state and $51,107 nationally in Income levels in Seattle, the state, and the nation have increased by 39, 40, and 22 percent, respectively, when compared to levels reported in the 2000 Census. Figu re P erc entoftotalem ploym ent by Ind u stry S ec tor(2040) Impacts No Build Alternative The No Build Alternative would not result in economic impacts. Residents, employees, and visitors in the downtown core would not benefit from the interconnected transportation network that would be provided by the City Center Connector. The additional employment and income associated with new jobs created by the operation of the Center City Connector would not be realized. Figu re Unem ploym entrates ( ) No new economic activity that generally accompanies a large construction project, such as direct and indirect jobs and employment income, would ensue. Businesses and residents would also not experience the temporary increase in congestion and delays, traffic diversions, noise, dust, and roadway closures along the corridor and side streets that accompany a construction project. TBG SEA MARCH 2016 ENVIRONMENTAL ASSESSMENT PAGE 4.5-4
153 ECONOMICS Locally Preferred Alternative O perationalim pac ts The LPA would have beneficial effects on the local and regional economies: (1) it would expand the reach and convenience of existing transit investments to facilitate economic exposure and activities between local and regional commercial centers and (2) it would increase connectivity between potential employees and employers and (3) it would bring additional jobs to the City of Seattle. The LPA would leverage City and regional transportation partner investments by linking the Westlake and King Street intermodal hubs at the north and south ends of the downtown area, which is consistent with long-term economic development strategies for Seattle and the region. Additionally, the higher frequency of streetcars north of the Westlake Intermodal Hub along Westlake and Terry Avenues to Republican Street would benefit the business community, workers, and residents in the South Lake Union area by making it easier to reach downtown Seattle destinations. Similarly, the higher frequency of streetcars in the Chinatown-International District to Eighth Avenue S would increase accessibility to and visibility of this business district. The LPA would benefit residents, employees, and visitors with increased connectivity and additional transportation options to major employment centers, retail shops, and tourist attractions in the study area and to other local and regional areas. It would provide connections with other modes at one of the three transportation hubs: Westlake Intermodal Hub, Colman Dock Intermodal Hub, and King Street Intermodal Hub. In addition, the Center City Connector line would add 22 full-time employees to the streetcar network, as identified in Table The increased earnings from the additional jobs would result in positive economic impacts on the local economy, both through direct hiring to fill transit jobs and indirectly as the new transit workers spend their earnings in the local economy, which would create additional consumer demand and jobs to meet that demand. Table Employment Estimates from Operations Positions Number of FTE Supervisors 1 Maintenance Workers 3 Operators 18 Total FTE 22 FTE = full-time equivalent The project would increase the capacity to move people within the corridor. However, the road modification to exclusive-transit lanes for the LPA would reduce roadway capacity for other vehicles on First Avenue, Stewart Street and Olive Way. The dispersion would be absorbed by adjacent roadways while still maintaining acceptable traffic flow. Some left-turn restrictions would limit the ability of vehicles to turn from First Avenue, but these changes are not anticipated to result in negative economic impacts because residents, employees, and visitors would still easily access their destinations. The reduction of on-street parking would not affect businesses substantially because there is ample off-street parking along the corridor and nearby, TBG SEA MARCH 2016 ENVIRONMENTAL ASSESSMENT PAGE 4.5-5
154 ECONOMICS and restrictions are already in place limiting the duration of and the hours of the day that onstreet parking is available (see Section 4.1.6, Parking, for more detail). C onstru c tion Im pac ts Construction of the project would temporarily increase congestion and noise, reduce on-street parking, and temporarily change access for businesses and residents in the area. Although pedestrian access to businesses would be maintained and two lanes of traffic would be open at all times (except for nights and some weekend work), retail sales at some businesses could fluctuate when construction requires access to their businesses to be modified. See Section 4.1 for mitigation measures for traffic and reduction of parking, and see Section 4.5 for noise mitigation measures during construction. For most track segments, construction duration would be less than 8 months and would be limited to typical construction hours (generally 7 a.m. through 7 p.m. where residences are found and up to 10 p.m. outside of residential areas). An exception to this would be Segment 4 (Westlake), where construction hours would be limited to evenings and weekends. This would also extend the construction period for Westlake compared to the other segments, but because it would occur during non-weekday business hours, construction impacts on adjacent businesses would be reduced. Activities associated with the construction period may cause short-term fluctuation in business activity; however, following construction, no long-term negative effects on the Seattle economy from these construction periods is expected. The detour route planned around Pioneer Square construction may result in additional evening peak-hour congestion on Alaskan Way, which may affect travel times for commuters, freight, and labor along this route. A potential benefit from the project would be a temporary increase in local jobs and income resulting from construction spending. Expenditures during construction would result in demand for construction materials and construction jobs. These construction expenditures are considered direct effects, which would lead to indirect effects as the output of firms in other industries increases to supply the demand for inputs to the construction industry. In addition, wages paid to workers in construction trades or supporting industries would be spent on other goods and services and provide benefit to the economy, both locally and, to a lesser degree, regionally. To determine the additional benefits to the local economy related to construction spending, multipliers developed by the Washington State Office of Financial Management were applied to the project cost. A project s effect on a region depends on the source of project funding. Only new federal dollars that would not be present in the local economy were it not for the construction of the Center City Connector project were included. Funds from local or regional sources were considered transfers that would have been spent on other economic activities. The direct construction expenditure for the Center City Connector is estimated to be $64.5 million (2013 dollars). This includes costs for the trackway, the single-track on Republican Street, and the OMF expansion(s). For this analysis, an input-output model created by the Washington State Office of Financial Management estimates that 454 jobs would be created by construction spending associated with the project (Washington State Office of Financial Management, 2014). In addition, third-party betterment agreements, such as upgrading utilities during construction, which are not included in this cost, may result in additional construction employment opportunities beyond those reported above. TBG SEA MARCH 2016 ENVIRONMENTAL ASSESSMENT PAGE 4.5-6
155 ECONOMICS Mitigation Measures Only beneficial economic impacts have been identified during operation; therefore, no mitigation measures are proposed. To minimize negative impacts on businesses during construction, SDOT will work directly with affected businesses and develop a business mitigation plan. At a minimum, the plan will include: Provide signage alerting potential customers that businesses are open during construction and clearly marked detours as appropriate. Provide the public with construction updates, alerts, and schedules through informational meetings, a project website, and other forms of communication. Develop a promotion and marketing plan to help affected businesses maintain their customer base during construction. Maintain access to each business and parking areas as much as possible during construction and coordinate with businesses during times where access might be limited. Coordinate construction activities with other capital improvement projects to minimize construction impacts and competing needs for detour routes. Implement parking and access mitigation strategies described in Section , Parking. TBG SEA MARCH 2016 ENVIRONMENTAL ASSESSMENT PAGE 4.5-7
156
157 SOCIAL AND COMMUNITY EFFECTS 4.6 Social and Community Effects Transportation projects have the potential to affect the communities they travel through by adding or changing travel patterns, accessibility to services, and sometimes disrupting community cohesion. The local environment as experienced by the people who work and live in a neighborhood can also be affected by changes in noise, views, and walking environments. This section examines potential social and community impacts from the construction and operation of the Center City Connector. The study area for the social and community effects analysis is 0.25 mile around the centerline of the alignment, 1,000 feet around the existing South Lake Union and Chinatown-International District First Hill Street Car OMFs, and 1,000 feet around proposed turnback tracks along Republican Street (see Figure 4.6-1). This study area was used in the analysis because it encompass the areas where project impacts on social and community resources are most likely to occur Neighborhood Characteristics Applicable Regulations Title VI of the Civil Rights Act of 1964 prohibits discrimination based on race, color, and national origin. Limited English Proficiency (LEP) Presidential Executive Order directs agencies to ensure LEP populations have fair and equal access to services. In the study area, there are seven neighborhoods defined in the City of Seattle s Comprehensive Plan (City of Seattle, 2005). They contain a mixture of employment, residential, and retail uses, as well as locations for gathering such as restaurants, bars, coffee shops, and community facilities (see Figure for location of community facilities). The neighborhoods are urban in scale and nature; they are communities that combine residents, service providers, and business employees and patrons. There are sidewalks on both sides of the streets and pedestrian crossings at each intersection. Many streets in the project corridor include street trees along the sidewalks and occasionally in the median. The neighborhoods enjoy connections to many local and regional transit services, such as the Seattle Streetcar system (First Hill and South Lake Union); Sound Transit Link light rail, Sounder commuter rail, and express buses; King County Metro and RapidRide bus service; Community Transit express bus service; the Seattle Monorail; the King County Water Taxi; and Washington State Ferries. The seven neighborhoods (referred to as urban villages by City of Seattle Comprehensive Plan) are described below. For more information, see Section 4.4, Land Use. Denny Triangle. This highly urbanized area includes the Westlake Shopping Center and Pacific Place mall, as well as many other retail businesses. It has experienced recent growth in residential and commercial developments. Belltown. This dense, mostly residential neighborhood has multifamily residential developments and a mixture of commercial and office land uses. It also includes restaurants and evening entertainment locations. Commercial Core. This major employment center, tourist and convention attraction, shopping magnet, and regional hub of cultural and entertainment activities contains the TBG SEA MARCH 2016 ENVIRONMENTAL ASSESSMENT PAGE 4.6-1
158 SOCIAL AND COMMUNITY EFFECTS Central Business District, made up of high-rise and midrise office, government, and commercial mall buildings; many hotels; the Washington State Trade and Convention Center; and the Pike Place Public Market. To the west, the Central Waterfront area includes the Seattle Aquarium, Seattle Great Wheel, and Colman Dock, which attract visitors to the area. The Seattle Art Museum and Benaroya Hall are also in the Commercial Core. Most of the residential development is located close to the Pike Place Public Market. Pioneer Square. The original downtown Seattle, this neighborhood includes historic and architecturally unique buildings that house retail shops, restaurants, and bars, as well as a mixture of multifamily residential and office buildings. South Lake Union. This neighborhood is in the midst of large-scale redevelopment. It includes a mixture of large, new, mixed-use residential and office developments, including the Amazon campus and biotech facilities. Chinatown-International District. This district includes businesses, local organizations, cultural institutions and multifamily residential and office buildings. It is one of Seattle s oldest neighborhoods and offers a diverse mixture of Asian culture with many restaurants and shops. SoDo. This neighborhood is primarily associated with commercial and industrial uses and includes the Starbucks headquarters, an active industrial waterfront, and Safeco Field, home to the Seattle Mariners Community Facilities There are 52 community facilities in the study area, including social services, cultural institutions (such as libraries, museums, theaters, and landmarks), religious institutions, and government offices. There are also eight park facilities in the study area which consist of small open plazas. They are described in Section 4.13, Parks and Recreational Resources, of this EA. Figure shows the locations of all community facilities in the study area, and the following is a list of those community facilities that are adjacent to the project elements: Social Services: Bread of Life Mission Yesler Community Center Plymouth Housing Group Rental Office Cultural Seattle Art Museum Schools Academy of Languages Translation and Interpretation Services Governments U.S. Post Office U.S. Federal Building TBG SEA MARCH 2016 ENVIRONMENTAL ASSESSMENT PAGE 4.6-2

159 SOCIAL AND COMMUNITY EFFECTS Figure Community Facilities in the Study Area TBG SEA MARCH 2016 ENVIRONMENTAL ASSESSMENT PAGE 4.6-3
160 SOCIAL AND COMMUNITY EFFECTS Demographics Study area demographics were compiled from U.S. Census 2010 data and from the American Community Survey data. Data on total population, age, and minority population characteristics was collected at the Census block level. Other data such as income level and household information was collected at the Census block group level. Demographic characteristics of the study area are summarized in Table When compared to the larger Seattle area, the population in the study area is older, has smaller households, consists largely of renters, and is more dependent on transit than the City of Seattle as a whole 1. Also, the study area has a higher concentration of minority and low-income populations compared with the City as a whole. Recent rapid growth is attracting more jobs throughout the City of Seattle. The study area s total population increased by 30 percent from 2000 to 2010 and is forecasted to increase by more than 40 percent from 2010 to 2030, compared to an approximate 20 percent increase for the whole city (PSRC, 2014). Table Demographic Characteristics Study Area Seattle Total Population 20, , Years and Under (%) Over 65 Years of Age (%) Median Age Average Household Size Owner-Occupied Housing Units (%) Renter-Occupied Housing Units (%) Median Household Income $36,890 $63,470 Households with No Vehicle (%) Persons with Disability People Whose Income in the Past 12 Months is Below the Poverty Level (%) Minority (%) Households with Limited English Proficiency (%) Source: U.S. Census Bureau, 2010 and Year American Community Survey, 2012 A Census Block is the smallest geographic unit used by the U.S. Census Bureau for tabulation of 100% data (data collected from all houses, rather than a sample of houses). Census Block Group is between the Census Tract and the Census Block. It is the smallest geographic unit for which the bureau publishes sample data (data that is collected from a fraction of all households). 1 Households with no vehicle are considered to be transit dependent, although other groups often qualify, such as young, elderly, and disabled persons. These persons are not counted in this analysis. TBG SEA MARCH 2016 ENVIRONMENTAL ASSESSMENT PAGE 4.6-4
161 SOCIAL AND COMMUNITY EFFECTS Impacts No Build Alternative The No Build Alternative would not directly affect neighborhoods or community facilities. Persons living and working in Seattle would not enjoy the improved access and connectivity within Seattle Locally Preferred Alternative Operational Impacts The Center City Connector would provide a convenient, reliable, and frequent transit service to easily and directly connect the neighborhoods in the study area with the neighborhoods currently served by the South Lake Union and First Hill Streetcar lines. Connections would also improve access to community facilities, employment opportunities, and education in other neighborhoods in Seattle through easier regional and local transit connections, such as Sound Transit Link, Sounder, express buses, Washington State Ferries, monorail, and King County Metro. The quality of life for persons who live and work in, and visit, the City Center would benefit from increased transit access and opportunities for social interaction. The increased transit access would be especially beneficial to transit-dependent households, which is about 47 percent of the study area population. No property acquisition would occur because the project remains within public right-of-way or on publicly owned lands. Conversion of existing general purpose travel lanes to transit-only lanes would result in traffic diversion to adjacent streets and the project would also require some turning restrictions for general purpose vehicles. These changes would cause some increase in traffic delays as traffic disperses among adjacent roadways; however, they would not adversely affect travel through and across the neighborhoods or materially impair business access. The loss of on-street parking would affect some study area residents; however, these parking locations are predominantly time-restricted parking stalls, and as described Section 4.1.6, Parking, adequate alternative locations and supply exists nearby. The project would replace bus line (99) on First Avenue, but bus 99 is likely to return to its original route on Alaskan Way, and others (12, 16, and 66) would be rerouted. The project would maintain sidewalks in the study area and upgrade crosswalk locations to meet ADA guidelines. In addition, the introduction of streetcars would not result in negative impacts on pedestrian movement because the streetcar vehicles would be within the existing right-of-way and existing crosswalks would remain. No impacts on non-motorized travel are anticipated beyond relocation of one bicycle sharrow (a lane shared by bicycles and vehicles) along Stewart Street between Fourth Avenue and Second Avenue one block to the east to minimize conflicts. Operation of the project would not result in noise and vibration impacts on sensitive receptors such as residences, churches, or concert halls, or other sensitive community facilities. It would not require the acquisition of property or alter the function or use of park facilities. (See Section 4.3, Noise and Vibration, and Section 4.13, and Parks and Recreational Resources, for additional information.) TBG SEA MARCH 2016 ENVIRONMENTAL ASSESSMENT PAGE 4.6-5
162 SOCIAL AND COMMUNITY EFFECTS The Center City Connector would change the visual setting in neighborhoods, including historic Pioneer Square. However, these changes would be minimal because project design would incorporate neighborhood design guidelines to integrate with the surrounding context and character (See Section 4.7, Visual and Aesthetic Resources) of the neighborhood. The LPA would not result in negative changes in neighborhood quality, cause to barriers to social interaction, nor adversely affect community facilities because the project would be located within the existing roadway right-of-way, would maintain building access (including enhanced access to community facilities and parks), and would improve pedestrian facilities. In addition, the project would increase connectivity to other regional transit connections throughout the greater Puget Sound region by providing links to transit hubs in the downtown area. Construction Impacts Construction impacts associated with the Center City Connector would be minor and temporary and would include the presence and movement of equipment and materials, lighting for nighttime work, storage of construction materials, and general visual nuisance around staging and construction areas. The project would be staged over a 2-year period along work areas of two to eight block segments. Work would occur within 8 months or less within each segment, typically during weekday construction hours; however, some nighttime work may occur. Construction activities, sequencing, and phasing are described in Section Residents and community facilities would experience short-term impacts associated with construction, including the following: Temporary increases in noise and vibration Temporary increases in fugitive dust levels and other emissions Temporary traffic impacts, including changes in travel patterns, accessibility, and the loss of on-street parking and loading and unloading access Temporary changes in visual settings due to presence of construction equipment and activities Potential temporary avoidance of the area by pedestrians See the following sections for more detail on impacts and mitigation measures during construction: 4.1, Transportation; 4.2, Air Quality and Greenhouse Gases; 4.3, Noise; 4.5, Economics; and 4.7, Visual and Aesthetic Resources. Along the Stewart Street alignment (the Westlake Segment), construction impacts may occur over a longer period (up to 8 months) but would be limited to weekends and evenings to minimize disruption of weekday traffic. By sequencing construction, impacts on neighborhoods would be shorter in duration. During construction, one lane (with sidewalks) would remain open in either direction, and vehicle detours would not be required except in Pioneer Square. During construction, only one direction would be open; traffic going the other direction would be redirected onto nearby roadways. No access would be impeded during this rerouting period. On-street parking would be removed along the alignment, and closures of intersections along the route would be limited to evenings and weekends to minimize impacts on circulation during business hours. See Section 4.5 for business impacts and relevant mitigation measures during construction. Despite some negative impacts near construction activities, the overall neighborhood quality for residents would be affected for relatively short periods. Other than infrequent occasions of pre- TBG SEA MARCH 2016 ENVIRONMENTAL ASSESSMENT PAGE 4.6-6
163 SOCIAL AND COMMUNITY EFFECTS arranged and off-business hours, building access would be maintained throughout construction, including at community facilities along the alignment. Despite best management practices to minimize construction impacts, community and businesses can become frustrated with construction, especially if they are not kept apprised of construction activities. Construction at the South Lake Union OMF may result in short-term noise, dust, and vibration, which would be limited to the expansion site. The turnback tracks on Republican Street and Westlake Avenue would be installed during non-service periods for the South Lake Union Streetcar and result in temporary noise and vibration impacts and minor traffic closures during off-peak peak periods Mitigation Measures No adverse social, community facilities, and neighborhoods operational impacts have been identified, and no mitigation is proposed. During construction, SDOT will develop and implement a public information plan, which will include the following elements: Build routine communication programs with community organizations and service providers in the project area to apprise them of construction activities that may affect the community and service providers. Provide targeted outreach to businesses and individuals directly affected (fronting construction areas) by the project. Hold regular coordination meetings with project team and public outreach staff so that public messages are current, timely, and, to the extent possible, provide advanced warning of construction activities that may affect routine daily activities. TBG SEA MARCH 2016 ENVIRONMENTAL ASSESSMENT PAGE 4.6-7
164
165 VISUAL AND AESTHETIC RESOURCES 4. 7 Visu aland A esthetic Resou rc es The visual environment encompasses elements from both the built and natural environments, including buildings, trees, bodies of water, and entire landscapes. This section examines potential impacts of the Center City Connector on visual quality and protected public views. Additionally, it assesses whether the project would induce additional light and glare in the study area. The study area is the views of and from the project; in this urbanized environment, the study area extends between the building façades on either side of the streetcar track and includes vistas at cross streets. This section first describes the methods for assessing visual quality, followed by an overview of the existing visual quality of the study area. Finally, it describes impacts and, as warranted, mitigation measures A ssessing Im pac ts on Visu aland A esthetic Resou rc es The description of the existing visual conditions and the approach used to assess changes associated with the Center City Connector are based on the visual assessment system found in the V isu alimpacta ssessmentfor H ighway P rojects (FHWA, 1981). The detailed methodology used to assess changes to visual quality can be found in Appendix H7, C enterc ity C onnectorv isu al and A esthetic Resou rces TechnicalReport(SDOT, 2015). FHWA defines visual quality as a combination of the following three elements of a view: A pplicabler egulations A visualassessm entisincluded in N EP A environm entalevaluations based on42 U.S.C.4321,S ection 101(b)(2),w hichstatesthatitis the continuousresponsibility of thefederalgovernm entto useal practicablem eans to assurefor alam ericanssafe,healthful, productive,and estheticaly and culturaly pleasingsurroundings. S EP A (W A C andw A C )requiresalm ajoractions sponsored,funded,perm itted,or approvedby stateand/orlocal agenciestoundergoplanningto ensureenvironm ental considerationssuchasim pacts relatedtoaestheticsand visual quality aregivenduew eightin decision-m aking. S eattlem unicipalcode P providespublicview protectiononview sofsignificant naturaland m anm adefeatures, w hichforthisprojectincludethe P ugets ound,eliottbay,and O lym picm ountains. Vividness is the degree of drama, memorability, or distinctiveness of the landscape components. The degree of vividness is composed of landform, vegetation, water-features, and manmade elements. Intactness is a measure of the visual integrity of the natural and manmade landscape and its freedom from encroaching elements. This factor can be present in well-kept urban and rural landscapes as well as in natural settings. High intactness means that the landscape is free of eyesores and is not broken up by features that appear to be out of place. Unity is the degree of visual coherence and compositional harmony of the landscape, considered as a whole. High unity frequently attests to the careful design of individual components and their relationship in the landscape. A visual quality assessment determines if the vividness, intactness, and unity of the environment would change with the development of the proposed project and whether the changes would be TBG SEA MARCH 2016 ENVIRONMENTAL ASSESSMENT PAGE 4.7-1
166 VISUAL AND AESTHETIC RESOURCES perceived by sensitive viewers. The assessment also considers whether the proposed project would be consistent with the existing visual character of areas where the proposed project would be located. Per FHWA methodology, the primary portion of the study area was divided into landscape units identifiable and distinct geographic areas within a linear project corridor from which there are views (the viewshed) of a proposed action. A series of representative views, referred to as key observation points (KOPs), were selected within each landscape unit. The KOPs were used to represent areas along the LPA so that landscape character and visual quality could be described and changes associated with the LPA could be determined. Figure shows the locations of the KOPs. Within each of the landscape units and at each KOP, photographs of the existing condition and a simulation of the LPA are provided to convey the degree of change Existing C ond itions There are four landscape units identified for the Center City Connector corridor: Landscape Unit 1 Stewart Street and Olive Way Landscape Unit 2 Pike Place Market Landscape Unit 3 Commercial Core Landscape Unit 4 Pioneer Square Visualcharacterisadescriptionof theview ed landscapeand is defined by relationshipsbetw een existingvisiblenaturalandbuilt landscapefeatures. Landscape units and their visual characteristics are described in Table and illustrated on Figure Photos of typical views in each landscape unit are shown on Figure Each landscape unit contains City of Seattle protected view corridors, as shown on Figure In accordance with SMC P, protected view corridors considered in this analysis include westward views of the Olympic Mountains, Puget Sound, Elliot Bay, and general views of the city skyline. In addition, to the landscape units described above, the LPA would include other project components and options that would be seen. They are relatively small in size or scale or are located in areas not seen by many sensitive viewers. These are also described in Table and include: The block along Republican Street between Westlake Avenue N and Terry Avenue N where the LPA would add a single track to connect with the existing South Lake Union street car tracks. The areas proposed for storage tracks required for expanding the existing South Lake Union OMF and/or Chinatown-International OMF Locations for one to two TPSS placed along the corridor in landscape units 1 through 4. TBG SEA MARCH 2016 ENVIRONMENTAL ASSESSMENT PAGE 4.7-2
167 VISUAL AND AESTHETIC RESOURCES Figu re L and sc ape Units and Key O bservation P oints (KO P s) TBG SEA MARCH 2016 ENVIRONMENTAL ASSESSMENT PAGE 4.7-3
168 VISUAL AND AESTHETIC RESOURCES Table L and sc ape Unit# C enterc ity C onnec torl and sc ape Units General Nam e L oc ation Existing visu alc harac teristic s Visu alq u ality 1 Stewart Street and Olive Way From existing Westlake Transportation Hub (Westlake Ave N and Stewart St) westward along Stewart St to First Ave. Also includes Olive Way between Third and Fourth Avenues. Begins at the busy McGraw Square and the Westlake Transportation Hub with streetcar, Monorail, nearby light rail tunnel, and many bus routes. From the hub, west to First Ave, Stewart St is a busy thoroughfare lined with an assortment land uses that include a multistory parking garage, an atgrade parking lot, and multistory mixed-use buildings of varying heights and styles. Macy s Art Deco building fills the block on Olive Way. Protected view corridors on Stewart St include Elliot Bay. Vividness: mediumhigh Unity: medium Intactness: medium Visu alq u ality: m ed iu m 2 Pike Place Market First Ave, from Stewart Street south past Pike Place Market to the north side of Union St. It is a local and federal historic district with period architecture around Pike Place Market. Covered sidewalks with retail space on the street level and a mix of residential and commercial office on higher floors. Protected view corridors on Union St include Elliot Bay (see Figure 4.7-3). Vividness: high Unity: medium high Intactness: high Visu alq u ality: high 3 Commercial Core First Ave, from Union St south to Cherry St. Lined with buildings of various ages, types, heights, and scales and contains a mix of uses such as offices, residences, hotels, and public institutions. Variety of distinctive buildings, from high rise to four- and six-story historic buildings progressing south along the corridor. Vividness: high Unity: medium Intactness: mediumhigh Various cross streets include narrow views of Elliot Bay that would be greater once the Alaskan Way Viaduct is removed. Visu alq u ality: m ed iu m -high to high 4 Pioneer Square First Ave, from Cherry St south through Pioneer Square to S Jackson St, turns east on S Jackson St, and ends at the existing streetcar stop on S Jackson. Local and federal historic district with three- to eight-story buildings, mostly brick. Tree-lined median creates canopy over street. Key features include Pioneer Square, wide sidewalks with retail at street level and mixed residential and office above. Yesler Way and S Jackson St are protected view corridors. Views from within this landscape unit do not allow views of protected features due to topography and tree canopy. Vividness: high Unity: medium Intactness: mediumhigh Visu alq u ality: m ed iu m -high to high TBG SEA MARCH 2016 ENVIRONMENTAL ASSESSMENT PAGE 4.7-4
169 VISUAL AND AESTHETIC RESOURCES L and sc ape Unit# General Nam e L oc ation Existing visu alc harac teristic s Visu alq u ality South Lake Union OMF and single track on Republican Chinatown- International District OMF Republican Street located at between Westlake and Terry Avenues; City owned parking lot facing Fairview Avenue N (between Thomas and Harrison Streets) Existing OMF site located at Eighth Avenue S and S Dearborn Street The single track would bridge existing track running along Terry and Westlake Avenues. The South Lake Union OMF would be located adjacent to the existing maintenance facility. These areas consist of modern, mid- to low-rise office buildings and commercial buildings. The Chinatown-International District OMF (located at Eighth Avenue and S Dearborn Street) is in an industrial area flanked by the elevated lanes of I-5 to the east; elevated lanes and off-ramps of I-90 are approximately 0.5 mile to the south. There are some neighborhood and cultural centers across S Dearborn Street, but they do not face the busy roadway. Vividness: low Unity: medium to low Intactness: medium to low Visu alq u ality: low to m ed iu m Vividness: low Unity: low Intactness: low Visu alq u ality: low TBG SEA MARCH 2016 ENVIRONMENTAL ASSESSMENT PAGE 4.7-5
170 VISUAL AND AESTHETIC RESOURCES Figu re Typic alvisu alc harac terp hotos foreac h L and sc ape Unit L andscapeu nit1:s tew arts treet L andscapeu nit1:m cgraw S quareats tew arts treet and W estlakeavenue L andscapeu nit2:p ikep lacem arket L andscapeu nit3:firstavenue,com m ercialcore L andscapeu nit3:firstavenueand U niversity S treet, Com m ercialcore L andscapeu nit4:p ioneers quare TBG SEA MARCH 2016 ENVIRONMENTAL ASSESSMENT PAGE 4.7-6
171 VISUAL AND AESTHETIC RESOURCES Figu re P rotec ted Views TBG SEA MARCH 2016 ENVIRONMENTAL ASSESSMENT PAGE 4.7-7
172 VISUAL AND AESTHETIC RESOURCES Im pac ts No B u ild A lternative The No Build Alternative would not result in any change to the landscape units. The visual environment would remain essentially the same and gradually improve as development occurs over time to individual properties and the city continues to implement enhancement design concepts. One such design concept expected to be implemented along the corridor is the Pike- Pine Renaissance, which will provide and incorporate more consistent and scenic pedestrian spaces through upgrades to intersections and sidewalks, including streetscape improvements, public area amenities, and light installations L oc aly P referred A lternatives Operational Impacts Project components of the Center City Connector that could affect visual quality include the vehicles, trackway, stations, OCS, and TPSSs. The tallest component associated with operating the project is the OCS, which would include suspended wires and suspension poles that are approximately 27 feet high and typically installed at intervals of 80 to 100 feet. Poles along the alignment would be consolidated when possible by combining light standards or poles used for other purposes with the OCS suspension poles. Streetcar tracks result in a change to the views of the roadway, but they are visually consistent with the transportation purpose of the roadway and therefore are not mentioned further in the landscape units. In addition, the City of Seattle has developed contextsensitive design considerations that would be incorporated into final design. As recorded in the C enterc ity C onnectorurban D esign A nalysis Urban C ontextand H istoricalsetting(sdot, 2015), these considerations were developed based on feedback from the Seattle Design Commission, Pioneer Square Preservation Board, and the Pike Place Market Historical Commission, as well as from feedback received during a public open house. Many of the considerations and design concepts that Context-S ensitivedesignisan approachtotransportation projectdevelopm entthat leveragescom m unity inputto bestincorporatetheexisting characteroftheareasthrough w iththeprojectw ilpass. would be used for the final design are described below and illustrated in Seattle StreetcarC enter C ity C onnector;transitway and Station C oncepts,p reced ents,tools and V ision forfirst A venu e (SDOT, 2015). These tools and visioning concepts emphasize quiet insertion, a term that means the streetcar would blend into the context of the area as it travels through several commercial districts, as opposed to becoming a dominant feature. The design concepts for the stations include selecting appropriate trackway and platform paving materials, texture, and colors, identifying streetscape furniture and fixtures that reflect architectural styles, and designing the station canopy to be simple and transparent. TBG SEA MARCH 2016 ENVIRONMENTAL ASSESSMENT PAGE 4.7-8
173 VISUAL AND AESTHETIC RESOURCES L and sc ape Unit1 (S tewarts treetand O live W ay) The LPA would merge with the existing South Lake Union Streetcar adjacent to the Westlake transportation hub and McGraw Square, just before turning onto Stewart Street, and would be consistent with the urban character of adjacent areas. The City of Seattle has identified Stewart Street as a protected public view of Elliot Bay, but the trackway, Third/Fourth Avenue Station platforms, and streetcar vehicles associated with the project would not block this view because the station would not extend into the intersection and the streetcars would pass just like any bus or other transportation vehicle does along the road. The LPA would travel mostly in an exclusive trackway, with some areas of mixed traffic. The eastbound station between Third and Fourth Avenues would be located on the sidewalk of Olive Way and would not distract from the Macy s building located adjacent to it, as shown in the visual simulation (see Figure 4.7-5). The westbound station would be located adjacent to what is currently a planter that separates Olive and Stewart Street. The planter would remain and have more visual prominence with the station adjacent to it. Viewers in this landscape unit include shoppers, nearby workers, pedestrians, motorists, and people walking to Westlake Center or McGraw Square. These viewer types do not have high viewer sensitivity. The LPA would not lower the existing medium visual quality of Stewart Street or the moderately high visual quality of Westlake Avenue and Olive Way. KOPs 1 and 2, shown on Figures and 4.7-5, represent views within this landscape unit. TBG SEA MARCH 2016 ENVIRONMENTAL ASSESSMENT PAGE 4.7-9
174 VISUAL AND AESTHETIC RESOURCES Figu re KO P 1 M c Graw S qu are as S een From S tewarts treetand Fifth A venu e, L ooking East ExistingView View w ithl P A TBG SEA MARCH 2016 ENVIRONMENTAL ASSESSMENT PAGE
175 VISUAL AND AESTHETIC RESOURCES Figu re KO P 2 S tewarts treetand O live W ay B etween Third A venu e and Fou rth A venu e, L ooking East(D ownhil) ExistingView View w ithl P A TBG SEA MARCH 2016 ENVIRONMENTAL ASSESSMENT PAGE
176 VISUAL AND AESTHETIC RESOURCES L and sc ape Unit2 (P ike P lac e M arket) The historic character and pedestrian scale in Landscape Unit 2 would be reinforced by implementing context-sensitive design features for the Pike Street Station platform and using paving materials for the platform and areas between tracks that would reflect the historic character of the intersection of First Avenue and Pike Street. See Figures and to see the existing condition and visual simulation of the LPA at this location. The removal of parking along First Avenue and one lane dedicated to transit would remove the number of vehicles visible which would unclutter the view and enhance the aesthetic experience of pedestrians, including visually sensitive residents, some of whom would also see the change from their residences above First Avenue. The LPA would pass by two areas along the corridor with concentrations of viewers: (1) the main entry to Pike Place Market near the intersection of Pike Street and First Avenue and (2) the Union Street overlook. The trackway passing through the brick-paved intersection of First Avenue and Pike Street would introduce a new element to this distinctive area. The tracks would also be visible in the roadway from the Union Street and Pine Street view corridors but would not contrast with the transportation function of First Avenue. Project components, such as tracks, station platforms, streetcar vehicles, and the OCS (on the eastbound or northbound side of the route; the west side would be wireless) along this section of First Avenue would not lower the moderately high to high visual quality of areas adjacent to the alignment. KOPs 3 and 4, shown in Figures and 4.7-7, represent views within Landscape Unit 2. TBG SEA MARCH 2016 ENVIRONMENTAL ASSESSMENT PAGE
177 VISUAL AND AESTHETIC RESOURCES Figu re KO P 3 P ike S treetand FirstA venu e, L ooking N orth (Uphil) ExistingView View w ithl P A TBG SEA MARCH 2016 ENVIRONMENTAL ASSESSMENT PAGE

178 VISUAL AND AESTHETIC RESOURCES Figu re KO P 4 P ike S treet, L ooking W esttoward FirstA venu e ExistingView View w ithl P A,show nw ithplanned bikefacility TBG SEA MARCH 2016 ENVIRONMENTAL ASSESSMENT PAGE
179 VISUAL AND AESTHETIC RESOURCES L and sc ape Unit3 (C ore C om m erc ial) The LPA tracks, OCS (located only on the northbound side of the alignment), and Madison Street Station platform in the middle of First Avenue would be consistent with the urban character of this landscape unit. KOPs 5 and 6, shown in Figures and 4.7-9, represent views within Landscape Unit 3. Eliminating parking along First Avenue would enhance the aesthetic setting of First Avenue and would be appreciated by pedestrians and visually sensitive residents who live in towers along the west side of First Avenue. The track and streetcar vehicles would be consistent with the urban character of the Seattle Art Museum and of University Street, which includes a grand stairway between First and Second Avenues (adjacent to the Seattle Art Museum) as well as a series of stairs and plazas known as the Harbor Steps that connect First Avenue with the waterfront. The LPA would not lower the moderately high to high visual quality of this portion of First Avenue. TBG SEA MARCH 2016 ENVIRONMENTAL ASSESSMENT PAGE
180 VISUAL AND AESTHETIC RESOURCES Figu re KO P 5 L ooking N orth (Uphil)along FirstA venu e from the S ou thwestc orneroffirsta venu e and M ad ison S treet ExistingView View w ithl P A TBG SEA MARCH 2016 ENVIRONMENTAL ASSESSMENT PAGE
181 VISUAL AND AESTHETIC RESOURCES Figu re KO P 6 L ooking N orth (Uphil)along FirstA venu e from the S ou theastc orneroffirsta venu e and M arion S treet ExistingView View w ithl P A TBG SEA MARCH 2016 ENVIRONMENTAL ASSESSMENT PAGE
182 VISUAL AND AESTHETIC RESOURCES L and sc ape Unit4 (P ioneers qu are) The primary impact associated with the LPA in this landscape unit would be the addition of the Pioneer Square station with a median platform north of Cherry Street on First Avenue. The Pioneer Square Station would be a center platform serving both north and south streetcar directions. This station sits at the border of Landscape Units 3 and 4 but is discussed as part of Landscape Unit 4. This would remove the left-hand turn pockets on First Avenue S. In this location, when proceeding north, the streetcar would reconnect to the OCS wire because the area within Pioneer Square (from Cherry Street to S Jackson Street) would be wireless. It would not lower the medium-high visual quality in this portion in Landscape Unit 4 because it would be compatible with the surrounding roadway and pedestrian elements present. SDOT is coordinating with the Pioneer Square Historic Preservation Boards on context-sensitive design components and materials such as paving, lighting standards, and station elements to integrate the Center City Connector with the historic character of this landscape unit. KOP 7, shown in Figure , represents the view in Landscape Unit 4 and Pioneer Square Station. TBG SEA MARCH 2016 ENVIRONMENTAL ASSESSMENT PAGE
183 VISUAL AND AESTHETIC RESOURCES Figu re KO P 7 L ooking NorthwestA long P ortion offirsta venu e S B etween C herry S treetc olu m bias treet ExistingView View w ithl P A TBG SEA MARCH 2016 ENVIRONMENTAL ASSESSMENT PAGE

184 VISUAL AND AESTHETIC RESOURCES O thera reas Notin L and sc ape Units Outside of the four landscape units, the LPA would add new elements in areas that overlap the existing South Lake Union and First Hill streetcar lines, such as the turnback and access track on Republican Street, the area proposed for expanding the existing OMFs, the Eighth Avenue S station design option, and the locations of the TPSS facilities. Turnback and Access Track. Changes associated with the new single-access/turnback track for one block on Republican Street between Westlake and Terry Avenues would remove parking on the north side of the street and would have little to no influence on visual character or visual quality of this basically utilitarian street. OMFs. The South Lake Union OMF expansion site would be seen by nearby residents. The expansion would consist primarily of additional storage tracks (which would be up to several feet lower in elevation than the adjacent Fairview Avenue sidewalk) and a one-story annex building that would replace a two-story office building at the corner of Harrison Street and Fairview Avenue (see OMF site plan in Chapter 3, Figure 3-11). The annex building would be smaller in scale than the existing building, and would be similar to nearby existing South Lake Union OMF buildings in terms of siding and roofing materials. Fencing along Fairview Avenue and Harrison Street would be selected to be compatible with the character of the neighborhood. The expansion would replace the existing city-owned surface parking lot west of the existing OMF. The enclosure of the additional yard would be consistent in terms of visual character. It would not change the average visual quality of the area near it (see Figure ). Figure Location of South Lake Union Streetcar Expansion The proposed Chinatown-International District OMF expansion site would include the addition of four storage tracks within the existing parking lot of the City of Seattle Charles Street Maintenance Yard, which lies adjacent to the OMF. Consolidating the OMF at this location would only result in altering the uses of existing buildings and tracks inside the same yard. Both the OMF and maintenance yard lie within an industrial area, not visible by residents or office workers. The changes would occur within the existing enclosed maintenance site; therefore, it would not change the medium to low visual quality of the area. Lighting for either OMF would meet Seattle Building Code for shielded light. TPSS. If a parking garage is selected for the TPPS site, the TPSS enclosure would have the appearance of a room, as shown on Figure 3-9 in Chapter 3, Alternatives. The other possibilities for the TPPS locations (underneath Seneca Street near Post Alley and a triangular traffic divider bounded by Westlake Avenue, Stewart Street, and Sixth Avenue) would require aboveground structures (as shown on Figure 3-8 in Chapter 3.). The location under Seneca Street would be difficult to see except from adjacent areas and would not change the utilitarian character of the area or lower the visual quality. An aboveground TPSS located in Westlake Square (a traffic island) would be more visible and would include architectural enhancements to match the TBG SEA MARCH 2016 ENVIRONMENTAL ASSESSMENT PAGE
185 VISUAL AND AESTHETIC RESOURCES character and average visual quality of the surrounding area. No change to visual quality would result to views from and of the proposed TPSS locations. S eattle P rotec ted V iews Within one block of the LPA, people would view streetcar vehicles, the OCS, and tracks from the view corridors identified on Figure Where the LPA would travel along First Avenue, the OCS would be located above the northbound trackway, but the southbound track would be wireless. The northbound trackway OCS would be placed among existing OCS used by electric trolley buses and would not appreciably add to the appearance of wires passing through and along the view corridors. Although streetcar vehicles would temporarily intrude upon views along protected corridors, there would be less overall traffic crossing than there is today. The streetcar lanes would be exclusive transit, limiting other traffic to one lane in either direction. Neither the OCS nor the streetcar vehicles would block views along the protected view corridors, but streetcar vehicles would be briefly seen as they passed in front of view corridors. Figure depicts the existing view along Pike Street towards the Pike Place Market and a simulation of the view with the LPA. Although Pike Street is not a protected view, the simulation provides an example of how streetcar vehicles would briefly enter a protected view corridor just as a bus or large truck would. L ightand Glare Im pac ts Lights from the streetcar vehicles would be seen at night and would be similar in appearance to buses that currently travel most of the streets the LPA would use. Station areas would be lit by existing streetlights. During final design, existing streetlight poles may be consolidated with OCS poles, but the total lighting conditions would not increase. Lights associated with the OMFs would be directed down, and directional shields would be used to minimize light and glare seen from nearby areas. The LPA would not result in noticeable light and glare impacts. Construction Impacts The primary construction impacts on aesthetic and visual resources would be temporary and related to closing portions of streets, staging equipment and materials, utility relocation, and trackway installation. Fencing would be required around some work sites, which would have a temporary negative visual impact. Mechanized equipment, lights for evening work, material storage and delivery, and removal of excavated material would be seen by viewers near the construction area to varying degrees. In locations adjacent to residences, there would be a greater likelihood that residential viewers would find construction activities aesthetically and visually disruptive. These impacts would be temporary and short-term and therefore would not result in a substantial impact M itigation M easu res No adverse effects during operation have been identified; therefore, no mitigation is proposed. Temporary visual impacts during construction will be mitigated by screening construction zones and stage areas. Nighttime lighting will be directed downward to reduce the impacts of light on adjacent residences. TBG SEA MARCH 2016 ENVIRONMENTAL ASSESSMENT PAGE
186
187 STORMWATER/ WATER QUALITY 4.8 Stormwater/ Water Quality Water resources consist of surface drainage, stormwater collection systems, and groundwater. This section discusses potential water quality impacts from the Center City Connector as a result of any changes in impervious surfaces and how the Center City Connector Project would meet the federal, state, and local regulations that address stormwater. Groundwater is addressed in Section 4.11, Geologic and Soil Resources. The Center City Connector is located in downtown Seattle, where stormwater runoff generally flows in sheets off the roadway pavement to the roadside curb and gutter. The runoff is collected by inlets or catch basins and conveyed to sewer or storm drain systems. The project area consists of nearly 100 percent impervious surface. The study area is limited to the area that may be drained from the proposed project limits of the Center City Connector and associated project components, including the proposed OMF expansion sites. There are no exposed surface waters along the alignment, and the project does not lie within any floodplains. The closest receiving waterbody for stormwater is Elliott Bay, which is part of Puget Sound and is located two to three blocks away from most of the proposed project alignment Generally, stormwater runoff is collected by inlets and catch basins that enter the combined pipe sewer system. The runoff combines with sanitary sewer flows and is treated at the Westpoint Wastewater Treatment Plant, where it is discharged to Puget Sound. During occasional large storm events, the public sewer system may overflow into Puget Sound. This is categorized as combined sewer overflow (CSO). The storm drainage system for one small area, the block between University Street and Union Street, drains into the Denney Way CSO basin before discharging into Elliot Bay. Hydrogeologically, the groundwater in the study area around the South Lake Union OMF and access tracks drains to South Lake Union. Federal: Applicable Regulations Sections 401 and 402 of the Clean Water Act State: Washington State Water Quality Standards Washington State Department of Ecology Stormwater Management Manual for Western Washington National Pollutant Discharge Elimination System Program s General Permit for Stormwater Discharges Associated with Construction Activities Seattle: Seattle Municipal Code, Section Pollutant-Generating Impervious Surface Impervious surfaces that are considered a significant source of pollutants in stormwater runoff. Such surfaces include those that are subject to vehicular use; industrial activities (as defined in the Ecology Manual); and storage of erodible or leachable materials, wastes, or chemicals; and that receive direct rainfall. TBG SEA MARCH 2016 ENVIRONMENTAL ASSESSMENT PAGE 4.8-1
188 STORMWATER/ WATER QUALITY Impacts No Build Alternative The No Build Alternative would not create additional stormwater flows or degrade water quality because the area consists substantially of impervious surface and stormwater would continue to flow into the CSO basins or equivalent storm drain basins. The No Build Alternative would not reduce vehicle miles traveled within the study area, which is projected to increase by 3.6 percent from 2014 through the 2035 planning horizon (PSRC, 2014). More traffic can increase the amount of pollutants, such as oils and heavy metals that degrade water quality. Roadway surfaces are referred to as pollutant-generating impervious surface (PGIS) Locally Preferred Alternative O perationalim pac ts The LPA stations, trackway, and access/turnback track, as well as both OMF expansion sites, would be in roadway right-of-way or in areas of existing impervious surface. In general, the exclusive transit lanes and the stations would be non-pollutant-generating surfaces because the streetcars would be powered by electricity and their braking systems would be maintained routinely. However, because there would be no barrier between motor vehicles, the exclusivetransit lanes would be calculated with the rest of the roadway as PGIS. There would be approximately 3.2 acres of replaced PGIS within the two CSO basins that are treated at the West Point facility. The replaced PGIS in the area between University and Union would be less than 0.2 acre. Up to 0.5 acre of impervious surface would be replaced whether one or both OMFs were expanded. According to the City of Seattle Stormwater Manual (City of Seattle, 2014), transportation projects with more than 10,000 square feet of replaced impervious surface area within a CSO basin shall provide flow control. Between 3,200 and 3,300 cubic feet of flow control would be required for the two CSO basins in downtown Seattle, but additional treatment would not be necessary because the flow would drain into the CSO basins. The portion of the LPA that would be separated from the CSO basins (the block between University Street and Union Street) would contain more than 5,000 square feet of new and replaced PGIS. Therefore, per the City of Seattle Stormwater Manual, water quality treatment would be required for the equivalent of approximately 8,400 square feet. Compact, proprietary water quality treatment BMPs, such as Filterra (a self-contained stormwater treatment system) or filter cartridges in underground structures, could be implemented to meet the treatment requirements. In addition to the requirements for flow control for the streetcar tracks and stations, the total OMF expansion area would require an additional 1,000 cubic feet of detention volume for the replacement PGIS. The project will adhere to the stormwater quality and flow control requirements contained in the Seattle Municipal Code, Section , and comply with other applicable federal, state, and local regulatory requirements. TBG SEA MARCH 2016 ENVIRONMENTAL ASSESSMENT PAGE 4.8-2
189 STORMWATER/ WATER QUALITY C onstru c tion Im pac ts During construction, sediment from removal of the roadway surface, relocation of utilities, and removal of impermeable surface at the OMFs may drain into the existing or proposed storm drain system during storm events Mitigation Measures The project will adhere to the stormwater quality and flow control requirements contained in the Seattle Municipal Code, Section , and comply with other applicable federal, state, and local regulatory requirements; therefore, no mitigation is proposed. Erosion control measures will be implemented during construction by the contractor. Prior to construction SDOT will obtain a National Pollutant Discharge Elimination System Program General Permit for Stormwater Discharges Associated with Construction Activities. One of the permit requirements is a project-specific Stormwater Pollution Prevention Plan and Sediment Control Plan, which would employ BMPs during construction to minimize the potential for soil erosion and sediment to enter the stormwater system. TBG SEA MARCH 2016 ENVIRONMENTAL ASSESSMENT PAGE 4.8-3
190
191 UTILITIES, ENERGY, AND ELECTROMAGNETIC FIELDS 4.9 Utilities, Energy, and Electromagnetic Fields Public and private utilities in the study area provide electricity, water, wastewater management, stormwater collection, natural gas, steam, communications, and telecommunications services. Water lines and high-pressure gas mains, sewer pipes, stormwater facilities, fiber-optic cables, telephone lines and other utilities run parallel beneath streets along the alignment. This section analyzes the short-term construction and long-term operational impacts of the Center City Connector on utility provider and systems that would serve or could be affected by the project. Project construction activities and operating vehicles, including the proposed streetcar system in the study area, would consume energy. The proposed Center City Connector vehicles would be powered by electricity; therefore, in addition to reviewing impacts on utilities, this section evaluates energy use by the project and potential impacts from electromagnetic fields (EMFs), which are produced wherever electricity is used Utilities Electricity, water, sewer, gas, steam, and fiber-optic lines are located within eight feet of the LPA alignment centerlines. Table lists the utilities, providers, and locations of utilities in the study area, which is defined as the area within public right-of-way where the project trackway, turnback tracks, access tracks, and stations are proposed, as described in Section The study area also includes the proposed OMF expansion sites and on-site utility connections Existing Energy Use and Supply According to the PSRC traffic model, the existing daily VMT for the study area is approximately 493,000 (PSRC, 2014). The daily energy use for all surface modes of traffic (transit, bus, truck, and automobile) is approximately 2.4 x 10⁹ British thermal units (Btu) (2,440 million Btu [MMBtu]) regardless of the power sources used. Within the study area, electric power supply is distributed through a combination of overhead and underground electrical lines. In the area of the proposed project, electrical lines are located underground. Overhead electric power trolley contact wires are present throughout the LPA corridor. Most electric trolley buses use First Avenue to turn around before returning on their route. Applicable Regulations WAC provides the accommodation of utilities within roadway rights of way. WAC provides guidance on design, permits and franchise agreements for incorporating utilities in transportation projects. Vehicle Miles Traveled (VMT) refers to the auto vehicle miles traveled within the region. TBG SEA MARCH 2016 ENVIRONMENTAL ASSESSMENT PAGE 4.9-1
192 UTILITIES, ENERGY, AND ELECTROMAGNETIC FIELDS Table Utilities in the Study Area Utility Type Provider Location within Public Right-of-Way Electric Power Water Sewer Service Natural Gas Service Seattle Steam Telecommunica tions Seattle City Light Seattle Public Utilities Seattle Public Utilities Puget Sound Energy Enwave (formerly Seattle Steam) Multiple private companies Network and distribution feeder lines are located underground. Depth ranges from 3 feet to 8 feet under pavement. Water mains are generally 3 to 6 feet underground and run parallel beneath the street in various locations, but primarily close to the curb line. Sewer and storm drain pipes are located at least 6 feet below the surface and typically run parallel beneath streets (smaller lines can be less than 3 feet underground). The system includes combined sewers, which collect stormwater runoff, in addition to wastewater. Gas transmission and distribution pipes are buried underground to depths of 3 to 6 feet. Steam service area encompasses roughly a square-mile area of the Seattle s downtown, distributing steam in 2- to 6-inch-diameter lines (depth underground unknown). Fiber-optic cables and telephone lines in the study area are provided by several private companies and public utilities that own fiberoptic cable and/or provide long distance and other telecommunication services. Generally, fiber-optic cables and telephone lines are less than 3 feet underground. Types of Utilities Present Lines, underground vaults, and structures Feeder main 12-inch vitrified clay pipe and ductile iron pipe 24-inch reinforced concrete pipe with 48-inch steel casing 48-inch brick Manholes 4-inch intermediate pressure 8 to 10-inch lowpressure manholes and vaults Multiple cables and lines In the City of Seattle, Seattle City Light is the main provider of electricity, which is generated using a number of resources. Some of these are self-generated, with the remaining power purchased from other producers. In 2012, hydroelectric power accounted for nearly 90 percent of the utility s power generation portfolio. Figure illustrates the utility s energy source mix. In 2013, Seattle City Light sold approximately 9.5 million megawatt hours to residential and commercial customers (Seattle City Light, 2013). Of this total, the utility had about 6.1 million megawatts of company-controlled power-generating capacity. The remaining power supply came from long-term contracts and wholesale power contracts with other providers, including Bonneville Power Administration, other utilities, independent power producers, and energy marketers across the western United States. Seattle City Light has achieved net-zero carbon emissions every year since 2005 (Seattle City Light, 2013). TBG SEA MARCH 2016 ENVIRONMENTAL ASSESSMENT PAGE 4.9-2
193 UTILITIES, ENERGY, AND ELECTROMAGNETIC FIELDS Puget Sound Energy provides natural gas in the study area, which is used for electricity generation and heating. Puget Sound Energy s network consists of transmission and distribution pipes, pressure controls, meters, and service lines. Natural gas mains, along with distribution and service lines, are located within the study area. Enwave (formerly Seattle Steam) Other is a district heating utility franchised by the City. Its 89.8% service area encompasses roughly a square-mile area of the Central Business District, extending from Blanchard Street to King Street and from the waterfront to 14th Avenue, crossing First Hill. The company provides steam to commercial, residential, and institutional customers for space and hot water heating, along with other uses, via a system of pipes running through street rights-of-way Electromagnetic Fields EMFs are produced wherever electricity is used. EMFs create electromagnetic interference, which can cause disruptions and possibly malfunctions in some types of equipment. In addition, EMF can interfere with utilities, causing corrosion and reducing the effective life of the utilities. Power lines, overhead trolley bus cables, and the passing of truck traffic can all result in EMF in the project corridor Impacts No Build Alternative Figure Seattle City Light Electricity Generation by Type, % 3.9%0.8%0.6%0.5% The No Build Alternative would not result in the relocation or disruption of any utility, nor would it result in additional energy demands. However, without new transit options, energy use, in the form of fossil fuels, would continue to rise to accommodate the transportation needs for the projected growth in population and commerce in Seattle. Although motor vehicles are becoming more efficient, the growth expectancy in Seattle would result in high demands on energy use for inner-city travel movements. Energy use is calculated by computing the number of vehicle miles traveled (VMT) using an average energy consumption per vehicle mile for the region in Using 2035 projected VMT, the No Build Alternative would require 2,974 Hydro Nuclear Wind Coal Landfill Gases 1 Enwave Seattle is a district energy system. In a district energy system, heat is produced at a centralized plant that generates steam (by burning natural gas, diesel oil and recycled wood) and distributes it via underground lines to nearby buildings. TBG SEA MARCH 2016 ENVIRONMENTAL ASSESSMENT PAGE 4.9-3
194 UTILITIES, ENERGY, AND ELECTROMAGNETIC FIELDS MMBtus of energy (see Table 4.9-2). The No Build Alternative would not result in new sources of electromagnetic interference. Table Projected Daily VMT and Energy Consumption for 2035 Mode Consumption Factor a 2035 No Build 2035 LPA Daily VMT MMBtu Daily VMT MMBtu % Change in MMBtu from No Build Alternative Automobile, Bus, and Truck Vehicles 4, ,000 2, ,000 2, % a Consumption factor: MMBtu/vehicle mile Locally Preferred Alternative Operational Impacts This section discusses how operation of the LPA may affect access to utilities in the roadway, use of electric power and water utilities, whether overall energy expenditure would change, and potential for EMF effects. Utilities The streetcar would be designed to avoid long-term conflicts with access to utilities for maintenance and repair. Utilities would remain in place wherever possible. Table lists the range of changes to and relocations of utilities necessary to avoid conflicts during streetcar operation. Table Impacts on Utilities Utility Type Provider Types of Utilities Present Relocation or Change to Utilities Electric Power Seattle City Light Lines, underground vaults, and structures Replacing duct bank at intersection crossings on 1st Ave at Pike, Pine, and Stewart. Replacing duct bank at intersection and alley crossings on Stewart at 1st/2nd Alley, 2nd/3rd Alley, 3rd Ave, 3rd/4th Alley, and 5th Ave. Water Seattle Public Utilities Feeder main Relocation of feeder main on 1st Ave between Stewart and Jackson St and on Stewart Street between 3rd and 4th Ave. Sewer Service Seattle Public Utilities 12-, 6-, and 8-inch vitrified clay pipe and ductile iron pipe No pipe relocation necessary; however, inlets at intersection may be rebuilt. 24-inch reinforced concrete pipe with 48-inch steel casing No relocation necessary. 48-inch brick No relocation necessary. TBG SEA MARCH 2016 ENVIRONMENTAL ASSESSMENT PAGE 4.9-4
195 UTILITIES, ENERGY, AND ELECTROMAGNETIC FIELDS Utility Type Natural Gas Service Provider Puget Sound Energy Types of Utilities Present Relocation or Change to Utilities Manholes Reconstruction of manholes for the top 4 to 8 inches when located within the track slab. 4-inch intermediate pressure Relocation of gas lines would to be outside of trackway throughout project limits. Seattle Steam Enwave (formerly Seattle Steam) 8- to 10-inch lowpressure manholes and vaults Minor repair of expansion vault chambers (3- to 5-foot depth) from Washington to Cherry St. Telecommunications Multiple private companies Multiple cables and lines No relocation necessary. Necessary utility connections are operational at both of the proposed OMF expansion sites. A new annex building at the South Lake Union OMF would include connections to sewer, water, and electric power. This would not be an expansion of service, because these utilities are already connected to the existing building that the smaller annex building would replace. Expansion of utility service areas would be limited to power required for OCS lines and potentially to expanding the on-site storm drainage detention systems. The existing OMFs drainage systems are designed to filter and recycle a high percentage of the wash and rinse water; solids, oils, soaps, and other contaminants would be filtered, settled to a sludge tank, and periodically hauled for disposal in accordance with regulations. Some disposal to the local sanitary sewer system would be expected from the recycled, filtered washwater (see Section 4.8, Stormwater/Water Quality, for more detail on stormwater detention and treatment). The water discharged to the sanitary sewer system is and would continue to be disposed of according to local and state regulations. Washing the additional streetcar vehicles would not affect the water providers existing and projected water supplies because no changes would be required to the existing utility system to meet the additional demand. Energy Demands Operation of the Center City Connector would be a new demand on the local electrical utility, Seattle City Light. The operation of the new line is expected to require one or two additional TPSS, each of which would likely have a maximum power draw of 350 kilowatts, with a short-term overload capability of 200 percent. This represents less than 0.1 percent of the total Seattle City Light power-generating capacity. Lighting and the OMF operations would also require electricity; however, by removing the existing building and replacing it with a smaller annex building, overall power use may be reduced for this property. Seattle City Light has planned for an adequate supply to service the proposed power demands projected through 2035 and beyond. Consequently, operation of Center City Connector is not expected to have a substantial impact on the demand of the electric utility. TBG SEA MARCH 2016 ENVIRONMENTAL ASSESSMENT PAGE 4.9-5
196 UTILITIES, ENERGY, AND ELECTROMAGNETIC FIELDS The LPA would alter the mixture of transportation modes in downtown Seattle by shifting some trips from motor vehicles to transit. This in turn would alter total use of energy, because streetcars, which are powered by electricity, can carry more passengers using less energy resources than the automobile. Due to the array of destinations and origins, energy attributed to transportation can only be computed at the regional scale, which may not reflect all the shifting of trips internal to the City of Seattle. Table (on page 4.9-4) presents the daily projected 2035 regional VMT with the LPA operational and with the No Build Alternative (see Center City Connector Transportation Technical Report (SDOT, 2015) for more detail on VMT projections). When compared to the No Build Alternative, the LPA would result in a slight reduction of the region s passenger VMT and therefore less energy consumption as people shift to more energy-efficient streetcar and transit options. Using only the regional model, energy use during project operation would result in approximately 0.5 percent less energy use than the No Build Alternative. Electromagnetic Fields No negative impacts caused by EMFs from the streetcar are anticipated. There are no known EMF-sensitive facilities, such as buildings housing highly sensitive equipment, that could be affected by EMFs from the LPA electrical system, including the OCS and TPSS, nor are there sensitive facilities around either of the OMF expansion sites. In addition, utility lines that cross under the trackway would be insulated in accordance with city standards, or cathodic protection systems to prevent corrosion damage from passing streetcars. Construction Impacts Utilities The construction phase would include relocation of utilities as needed to minimize long-term conflicts with maintaining or accessing utilities corridors. Relocating underground utilities would involve pavement demolition, excavation, repaving, ground support systems, groundwater control, relocation effects on other localized utilities, dust and noise control, short-term traffic disruptions, and lane or sidewalk closures. For aboveground utilities, direct effects typically include placement of new or temporary poles. Direct effects on utilities could include short disruptions to utility service during the cutover from existing to temporary service feeds and again when permanent utilities are completed. Occasionally, during construction, unintended disruptions occur. Disruptions of utility service during relocations would likely be minimal because temporary connections to customers would typically be established before relocating utility conveyances. However, inadvertent damage to underground utilities could occur during construction if utility locations are uncertain or misidentified. While such incidents do not occur frequently, they could temporarily affect services to customers served by the affected utility while emergency repairs are made. Efforts to minimize impacts would include potholing and preconstruction surveys to identify utility locations and outreach to customers to inform them of potential service disruptions. All required improvements would be installed per the 2014 Edition, City of Seattle Standards for Municipal Construction and Standard Plans for road, Bridge and Municipal Construction. After TBG SEA MARCH 2016 ENVIRONMENTAL ASSESSMENT PAGE 4.9-6
197 UTILITIES, ENERGY, AND ELECTROMAGNETIC FIELDS completion, the project would not result in an impact on demand or delivery of utility services in the study area. Energy Demands The energy used during construction would be a non-recoverable use of resources. Estimates of energy consumption during construction are directly related to construction costs. With a projected cost of $64.5 million, the energy consumed over the maximum 2-year period is projected to be 201,610 MMBtu 2, which is the equivalent of providing the energy needs of approximately 2,400 residential homes for 1 year. This would be lost energy use, but the energy savings from operations would compensate for the loss in less than 15 years. Electromagnetic Fields The period of construction would not result in damage from EMF Mitigation Measures Once utilities are relocated, no adverse effects on utilities, energy consumption, or electromagnetic interference are anticipated; therefore, no mitigation measures are proposed. During construction, no adverse effects on energy consumption or electromagnetic interference are identified; therefore, no mitigation measures are proposed. However, to mitigate risk of disrupting utilities during construction, SDOT will develop a utility relocation plan prior to construction, which will include coordination with utility providers to minimize potential disruptions through detailed construction schedules and sequencing. When more than a short service disruption may be needed, temporary connections to businesses and residences will be provided. 2 The California Department of Transportation (Caltrans) was employed to derived energy consumption factors for the construction of different light/streetcar rail transit facilities in Energy and Transportation Systems, and these factors are still widely used in the industry today (Caltrans, 1983). Because the Caltrans report was developed using 1973 construction dollars, the energy consumption factors were adjusted to account for the change in construction costs. The California Construction Cost Index was used to adjust the factors to 2014 dollars. TBG SEA MARCH 2016 ENVIRONMENTAL ASSESSMENT PAGE 4.9-7
198
199 HAZARDOUS MATERIALS 4.10 Hazardous Materials Hazardous materials require special handling and disposal. In Washington state, hazardous materials are regulated under several state and federal laws and categorized as hazardous waste, problem waste, petroleum products, dangerous waste, hazardous substances, or toxic substances. Encountering hazardous materials during construction could pose risks to human health and the environment or could create control or cleanup requirements for the project. This section considers the potential of the Center City Connector to encounter hazardous materials and to introduce new sources of hazardous materials contamination. Information used to evaluate potential project impacts was obtained from databases maintained by the U.S. Environmental Protection Agency (EPA) and the Washington Department of Ecology (Ecology) to track sites with potential or confirmed hazardous material releases to the environment and facilities that manage hazardous materials as part of their operations. The study area for the hazardous materials analysis is 1/8 mile 1 from either the center line of the proposed new tracks/access track or around the areas where OMF expansion would occur. Environmental database searches for sites within the study area were conducted in September and October 2014 (Environmental Data Resources, Inc. [EDR], 2014a, b, c). The database searches identified sites within the study area that have a record of hazardous material, substance, or waste handling or that have the potential to be contaminated or have been contaminated in the past. A total of 75 sites were identified within the Center City Connector study area (see Table A-2 in Appendix D4.10). Sites identified in the EDR search were prioritized based on potential risk levels to determine the need for avoidance, remediation, or mitigation, while considering associated costs and liability. The three risk levels are defined as follows: Applicable Regulations Comprehensive Environmental Response Compensation and Liability Act (42 U.S.C. 9601, et seq.) Superfund Amendment and Reauthorization Act Resource Conservation and Recovery Act of 1976, as amended (42 U.S.C. 6901, et seq.) Clean Water Act (33 U.S.C. Section 1 251, et seq.) Toxics Substances Control Act (15 U.S.C ) Dangerous Waste Regulations (WAC ) Model Toxics Control Act (WAC ) Underground Storage Tanks (USTs) WAC This study area was selected because, if contamination is present, being within 1/8 mile of a high-risk site could affect the project or the project could affect the site. TBG SEA MARCH 2016 ENVIRONMENTAL ASSESSMENT PAGE
200 HAZARDOUS MATERIALS H ighrisk. High-risk sites typically include contaminated sites that are located within or adjacent to the project construction limit and have not received a no-further action (NFA) determination from regulatory agencies such as Ecology. The high-risk level is assigned to contaminated sites that might create liability either from construction activities exposing hazardous materials or by acquiring all or a portion of the site and the liability for cleanup responsibilities. M ediu m Risk. Medium-risk sites are located within or adjacent to construction limits where there has been a past release, but where the sites have undergone remedial cleanup and have received an NFA determination from regulatory agencies such as Ecology. L ow Risk. This risk level applies to sites where there has been no documented release to the environment and are not expected to be affected by the project. Low-risk sites where there has been a past release, and where the sites have undergone remedial cleanup and have received an NFA determination from regulatory agencies such as Ecology. The hazardous material analysis in this EA focuses on high-risk sites because they have the greatest potential to expose hazardous materials during construction. High-risk sites in the study area are listed in Table and shown on Figure Detailed information can be found in Appendix D Hazardous Materials Sites within the Study Area There are 28 high-risk hazardous material sites in the study area (see Figure ): 14 sites within 1/8 mile of the streetcar alignment 8 sites within 1/8 mile of the South Lake Union OMF expansion site 6 sites within 1/8 mile of the Chinatown-International District OMF expansion site The only high-risk site located directly under the proposed area of construction activity is located at the Chinatown-International District OMF expansion site (Map ID A2/A8). Table High-Risk Sites in the Study Area Map ID Site Name and Address Potential Impacts 31B 38A 41B 44A 53A Pacific Place Construction Sixth Ave and Olive Way Fourth Ave and Virginia St 1920 Fourth Ave Barg French Cleaners 1929 Third Ave Autopark USA Inc Second Ave Saint Regis Hotel 116 Stewart St Streetcar Alignment Petroleum products in soil. Petroleum products in soil and groundwater. Halogenated organics in soil and groundwater. Benzene, non-halogenated solvents, diesel, and gasoline in soil. Petroleum products are also suspected in groundwater. Petroleum products in soil and groundwater. TBG SEA MARCH 2016 ENVIRONMENTAL ASSESSMENT PAGE
201 HAZARDOUS MATERIALS Map ID Site Name and Address Potential Impacts 77A/B 77C Seattle Steam 1310 and 1319 Western Ave Union Substation/Seattle City Light 1312 Western Ave 91 Alexis Hotel 1007 First Ave 102A 103B 108B 108D Cherry Street Garage 213 Cherry St Commuter Centre Parking 801 Western Ave Butler Garage 114 James St Seattle Steam Co 700 Post Ave 117 Old Seattle Parking Garage 74 S Jackson St 229 Seattle Fire Station Second Ave S 2 Ivar s Commissary 500 Terry Ave N 5A 5B 8B Petroleum products in groundwater and polycyclic aromatic hydrocarbons (PAHs) and petroleum products in soil. Metals and polychlorinated biphenyl (PCBs) are also suspected in soil and groundwater, and PAHs are also suspected in groundwater. Petroleum products in soil. Benzene, gasoline, and non-halogenated solvents in soil and groundwater. Lead and other metals are also confirmed in soil. Gasoline in soil, groundwater, and air. Gasoline and other petroleum products in soil. (Seven USTs were removed in July Soil contamination, including gasoline and other petroleum products, remains above cleanup levels.) Benzene, non-halogenated solvents, and gasoline in soil and groundwater. (Two USTs were removed in 2000, and at least one tank remains in place for storage.) Petroleum products in soil and groundwater. Metals, PCBs, and PAHs are also suspected in soil and groundwater. Gasoline confirmed in soil. Benzene and other petroleum products are also suspected in soil. Petroleum in soil. South Lake Union OMF Expansion Site and Access Track 428 Westlake LLC 428 Westlake Ave N Firestone Tire & Rubber Co 400 Westlake Ave N Lake Union III LLC 410 Terry Ave N/415 Boren Ave N/1015 Republican St 13 Block 40 E & W Westlake & Terry Ave 320 Westlake Ave N Gasoline and other petroleum products confirmed in groundwater. Benzene, diesel, gasoline, and other petroleum products are confirmed in soil. Benzene and diesel are also suspected in groundwater. Site has restricted land use and groundwater use and requires maintenance. In addition, all soil disturbance is prohibited at this site. Gasoline suspected in groundwater and soil. Diesel in soil. Petroleum products in soil. TBG SEA MARCH 2016 ENVIRONMENTAL ASSESSMENT PAGE
202 HAZARDOUS MATERIALS Map ID Site Name and Address Potential Impacts A4 B13 17B A2/A8 a Troy Laundry 311 Fairview Ave N The Seattle Times Co 307 Fairview Ave N Mastercraft Metal Finishing Inc Harrison St Specific contaminants of concern include trichlorethene, cis- 1, 2- dichloroethene, vinyl chloride, gasoline, diesel, and oilrange petroleum hydrocarbons (Ecology, 2014). Groundwater at the site generally flows northwest (Touchstone SLU LLC, 2013), which puts this site downgradient from the South Lake Union OMF expansion site. A site that undertook cleanup, where dangerous wastes were generated as part of the remediation in Metals confirmed in soil. Metals are also suspected in surface water and air, and corrosive wastes are suspected in soil and surface water. Chinatown-International District OMF Expansion Site Charles Street Site West (Two Reports) 705 S Charles St 11 Seattle City ESD 805 S Charles St B13 C20 D17/D18 D23 Triangle Property 901 Maynard Ave S Spic N Span Cleaners Corp, Inc. 652 Dearborn St Facility Maintenance Headquarters 802 S Dearborn St Seattle City Fire Garage 815 S Dearborn St Benzene, lead, non-halogenated solvents, diesel, gasoline, and other petroleum products in soil and groundwater. Benzene in soil. Gasoline in groundwater. Halogenated organics, chlorinated solvents, and petroleum products in soil and groundwater. Benzene, halogenated and non-halogenated organics, diesel, gasoline, and other petroleum products in soil and groundwater. Metal is also suspected in soil and groundwater. This site is also listed in the INST CONTROL database, and all groundwater uses are restricted at this site. (This site is also listed as the King County DOT Metro Transit Division with the same address. The King County DOT Metro Transit Division is listed in the ICR database as a site containing petroleum products in soil and groundwater.) Benzene, diesel, and gasoline confirmed in soil. Halogenated and non-halogenated organics and metals are also suspected in soil. a Map ID A2/A8 is shaded gray in the table to indicate that it is a high-risk site located directly under the proposed area of construction activity. TBG SEA MARCH 2016 ENVIRONMENTAL ASSESSMENT PAGE
203 HAZARDOUS MATERIALS Figure Locations of High-Risk Sites TBG SEA MARCH 2016 ENVIRONMENTAL ASSESSMENT PAGE
204 HAZARDOUS MATERIALS Impacts No Build Alternative Under the No Build Alternative, the project would not be implemented, there would be no impacts on hazardous material or contaminated sites, and there would be no releases or spills of hazardous substances. In addition, potential discovery, cleanup, or removal of new and existing hazardous material and contaminated sites would not occur under the No Build Alternative Locally Preferred Alternative O perationalim pac ts The proposed stations, trackway, OMF, and access and turnback tracks would be located within the existing public right-of-way or City of Seattle property. No new property would be acquired. During track and streetcar maintenance, there would be an extremely low chance that a small amount of fuel or hydraulic fluid would spill. The likelihood of impacts (i.e., releases) from project operation and maintenance activities would be low. Because the streetcar would be powered by electricity, there are few risks of hazardous materials spilling as a result of vehicle operations along the route, and impacts from releases to the environment would be low because the amount of material spilled would be small. If a spill were to occur during operation, BMPs would be implemented. Operation of the OMF would increase the likelihood of potential releases to the environment because hazardous materials such as fuels, adhesives, cleaners, epoxies, propane, grease, lubricants, paints, and solvents would be stored at the facility and used in the study area during maintenance activities. The risks of potential releases to the environment would be low, however, because the amounts of each of these materials located on the OMF site would be small, in most cases a few gallons each, and spill pollution prevention measures and other BMPs would be implemented during facility operation. C onstru c tion Im pac ts As shown on Figure , there are sites close to the LPA and the proposed OMF expansion sites that could be affected during construction. Compared to the No Build Alternative, the primary potential for construction impacts from the project would include: Release of hazardous materials into the environment through the disturbance and removal of contaminated soil and groundwater. Risk of construction-related hazardous materials such as fuels, oil, or uncured concrete entering soil, groundwater, or surface water as a result of spills. Groundwater is not likely to be encountered during the construction of the proposed new trackway, turnback track, or access track because the anticipated depth of construction is less than 2 feet and up to 8 feet where utilities need to be relocated. This activity is shallower than the groundwater depth. The only exception is the installation of the OCS poles, which may need to be augered down up to 15 feet deep. However, the only area where groundwater is estimated to be at a depth of 12 feet is in Pioneer Square, where OCS poles would not be needed because this portion of the track would be wireless (Washington State Department of Natural Resources, TBG SEA MARCH 2016 ENVIRONMENTAL ASSESSMENT PAGE
205 HAZARDOUS MATERIALS 2014). Additionally, there are no high-risk hazardous sites underneath in this area; thus, contaminating groundwater or releasing contaminated groundwater is not likely. The exception may be the Chinatown-International District OMF expansion site, where groundwater may be present at depths of 20 feet or greater (Washington State Department of Natural Resources, 2014). At the Chinatown-International District OMF, new tracks and OCS would be constructed. Because OCS suspension poles are typically installed at 15-foot depths, a hazardous release into the groundwater would be avoided. As noted above in Table , the only high-risk site directly under the construction footprint is Map ID A2/A8 at the proposed Chinatown- International District OMF expansion site. SDOT is already implementing regulatory standards to manage this site and would continue to do so and contain the hazardous materials during construction to avoid adverse effects of releasing hazardous materials. The likelihood of impacts from encountering existing contamination or hazardous materials containers depends upon the extent and characteristics of the contamination and hazardous materials. If construction disturbs one of the high-risk sites, a variety of impacts, both beneficial and adverse, would be possible during construction: Construction activities, such as grading, in the vicinity of these materials could release contaminants to soil, groundwater, and surface water. Contaminated materials might be uncovered, allowing more direct exposure to the public. Contamination might spread as a result of construction. If required, dewatering might generate large quantities of contaminated water that would need to be treated and disposed of. Contamination that otherwise would remain in place and potentially migrate might be discovered and addressed by the project. To accommodate project construction, contamination might be cleaned up earlier than otherwise would occur. Contamination might be prevented by removing potential existing sources, such as USTs and aboveground storage tanks, before they cause releases. Under these circumstances, SDOT would implement the following BMPs, as applicable. S ite A voidance.through final design, SDOT would minimize impacts from known sites by avoiding contaminated sites, or portions of sites, as practical. By minimizing encounters with hazardous materials, the project would reduce exposure risk, as well as potential delays, construction costs, and liability associated with site acquisition and cleanup. Avoiding contaminated sites would also reduce the opportunity for beneficial impacts associated with cleanup. Avoidance would be implemented through the following strategies: Conducting additional studies and site surveys to confirm the presence or absence of contaminated environmental media at or near the high-risk sites. The nature and extent of contamination at high-risk sites with confirmed contamination also need to be evaluated prior to construction. For example, Map ID 5A in Table , located adjacent to the proposed South Lake Union OMF access tracks, indicates soil disturbance is prohibited because of existing contamination. If additional study confirms the presence of contaminated soil in the construction footprint, the area would be avoided or cleaned up prior to construction. TBG SEA MARCH 2016 ENVIRONMENTAL ASSESSMENT PAGE
206 HAZARDOUS MATERIALS Locating USTs and associated piping at sites within the construction footprint to avoid or remove prior to construction of the LPA. Using construction techniques that minimize disturbance or release of contaminated media. C leanu pp riorto C onstru ction.cleanup efforts implemented before or during construction would reduce potential long-term impacts. As part of the project, SDOT would comply with hazardous materials regulatory requirements associated with project construction and operation. For example, the Chinatown-International District OMF expansion site is contaminated (Table , Map ID A2/A8). Prior to construction, SDOT would verify the extent of contamination at the site and minimize exposure to hazardous materials, where possible. In addition, SDOT would coordinate with the site cleanup manager and agencies to support compliance with site-specific cleanup and disposal requirements. SDOT would also minimize potential impacts of accidental releases of hazardous material during construction, through the following strategies: Preparing a comprehensive contingency and hazardous substances management plan, a worker health and safety plan, a spill prevention control and countermeasures plan, and a stormwater pollution prevention plan. Managing and disposing of hazardous or contaminated materials in accordance with applicable requirements. Preparing a stormwater pollution plan to prevent pollution in stormwater runoff. Mitigation measures to protect stormwater from contamination are found in Section 4.8, Stormwater and Water Quality Mitigation Measures The most likely operational impact would be the release of hazardous materials into the environment from accidental spills at the OMF sites, and such potential impacts will be avoided or minimized by implementing BMPs, including spill prevention planning and emergency response procedures. SDOT will continue to manage the hazardous material site currently located on the Chinatown- International District OMF site. Construction impacts will be avoided or minimized by implementing BMPs (as listed above in Section , under the Site Avoidance and Clean-Up Prior to Construction subsections), and a spill prevention plan and emergency response procedures will be developed and implemented to guide the characterization, management, and disposal of contaminated materials, if encountered. The contractor will develop a spill prevention plan that meets City standards to control spills on the site (Standard specifications A (1)8-01.3(2)C) and a waste management plan that follows City Standard Specification , Discoveries of Contaminated Materials, Dangerous Waste(s) and TSCA Waste(s), which includes procedures for identifying and characterizing unanticipated hazardous materials. TBG SEA MARCH 2016 ENVIRONMENTAL ASSESSMENT PAGE
207 GEOLOGIC AND SOIL RESOURCES 4.11 Geologic and Soil Resources Geology and soils are evaluated as part of an environmental document because conditions in the project area can influence the type and size of a project s structure, the noise level, the amount of ground disturbance created during construction, and the volume of soils needed to be excavated. In addition, geology and soils are related to the presence of geologic hazards such as earthquake vulnerability (see definitions in right inset box). Geology and soil considerations affect project construction methods and, if not adequately considered during project design, could affect the long-term operations and safety of the project. This section provides a general overview of regional and local geological conditions, existing soil data, and geological hazard information, including a general evaluation of seismic hazards and liquefaction or inundation from tsunami or seiche that could occur in the study area. The study area is defined as the area within public right-ofway where the new project tracks, turnback tracks, access tracks, and stations are proposed, as described in Section of this EA. The study area also includes the proposed OMF expansion sites Topography, Regional Geology, and Seismicity Regional topography in the Seattle area has been influenced by repeated glaciations during the past million years, and it is dominated by north-south trending ridges and troughs formed through glacial erosion and sediment deposition (Troost et al., 2005). In the project vicinity, approximately 1,500 feet of glacial and nonglacial sediments overlie bedrock (Troost et al., 2005). The City of Seattle is Geologic Hazard Areas Steep slopes are slopes steeper than 40 percent with a vertical elevation change of at least 10 feet. Landslide hazards may occur where the slope is steeper than 40 percent, in areas with indications of past landslide activity, and in areas that have shown significant movement during the last 10,000 years. Seismic hazard areas are subject to potential risk from earthquake-induced ground shaking and fault displacement. Ground shaking can result in slope failure, settlement, liquefaction, a tsunami, or a seiche. Liquefaction refers to soils with little or no cohesion that lose strength during earthquakes. Liquefaction typically occurs in areas where there is a shallow groundwater table. A tsunami is a sea wave resulting from an underwater landslide or seafloor movement during an earthquake. Seiches are periodic oscillations in an enclosed body of water during an earthquake. Peat settlement-prone areas are areas where the soils are highly compressible and prone to settlement. Volcanic hazard areas are those areas in the project vicinity subject to inundation by lahars or related flooding from volcanic activity on Mount Rainer. generally composed of hilly terrain. Elevation in Seattle varies between sea level and up to approximately 450 feet above sea level. Topography generally slopes from northeast to southwest, toward Elliott Bay. The streets parallel to Elliot Bay, such as First Avenue, are relatively flat. TBG SEA MARCH 2016 ENVIRONMENTAL ASSESSMENT PAGE
208 GEOLOGIC AND SOIL RESOURCES In addition, the project vicinity has undergone extensive modification over the past 150 years, including moving the shoreline waterward with construction of the Elliott Bay seawall. Historic photographs indicate that the shoreline was originally located close to the current-day First Avenue. Building the seawall led to raising the ground level in the historic Pioneer Square area approximately one story higher. Basements for most buildings were originally the ground floor. Also, in the late 1800s, an enormous regrading project, known as the Denny Regrade, resulted in leveling a large hill to lower the topography from Denny Way to Jackson Street and between First Avenue and Fifth Avenue, making way for the entire downtown Seattle as it stands today. The King County interactive database includes the results of numerous soil boring data along the LPA alignment. A sampling of boring data suggests a range of soil conditions along the alignment, generally limited to silts, sands, and clay of varying density and consistency (Washington State Department of Natural Resources, 2014). The borings reveal fill material and manmade debris within surficial layers from early development and earthwork. Fill material was observed in the vicinity of the Newslane Tower (First and Pike), MC-1 Site Development (First and Union), Carma Center (First and University), the 1000 First Street Project (First and Madison), and the Buttnick Building (First and Washington). The uppermost native material commonly consists of loose to medium-dense fine sand and silty sand within the upper 10 to 15 feet. Below 15 feet, the material density and consistency generally increase substantially, becoming very dense or hard and consisting of interbedded sand, sandy silt, sandy clay, and variations of silt, sand, and clay. The City of Seattle is a seismically active area. The closest fault is in the 6-kilometer-wide Seattle fault zone, which runs west to east across the south part of the city, according to the Geologic Map of Seattle (Troost and Booth, 2008). The upper boundary of the Seattle fault zone lies just south of the study area in Pioneer Square. Although activity within the Seattle fault zone could be a major contributor to potential ground shaking, a fault rupture from the Seattle fault zone is unlikely in the study area Hydrogeological Conditions Hydrogeological conditions in the project vicinity are greatly influenced by the steep topography of the region and Elliott Bay to the west. Groundwater flow is primarily from the east-northeast to west-southwest, toward Elliott Bay. Depth to groundwater along the new track alignment on First Avenue is as shallow as 12 feet in the south portions of the study area and becomes deeper moving northward (Washington State Department of Natural Resources, 2014). Depth to groundwater at the South Lake Union OMF expansion site is between 75 to 80 feet below ground surface (Touchstone SLU LLC, 2014). Depth to groundwater in the area around the Chinatown- International District OMF expansion site is between 20 and 30 feet below ground surface (Washington State Department of Natural Resources, 2014) Geologic Hazards Based upon information in Section of the Seattle Municipal Code, geologic hazards include the following: liquefaction, landslide, peat settlement, volcanic hazards, and seismic hazards, which include tsunamis and seiches. These situations could result in soil settlement, thereby undermining the infrastructure integrity. The study area does not include steep slopes nor is it considered a landslide hazard area. The southern one-third of the study area is located in the TBG SEA MARCH 2016 ENVIRONMENTAL ASSESSMENT PAGE
209 GEOLOGIC AND SOIL RESOURCES Pioneer Square District, which is characterized as having high liquefaction susceptibility. 1 In addition to liquefaction, the Pioneer Square-Skid Road Historic District could be inundated by a seiche from a seismic event, and there are areas where peat settlement is a concern. Other areas of the study area are less susceptible because they are at higher elevation. The Seattle Police Department is responsible for the Disaster Readiness and Response Plan and, among other responsibilities, coordinates the emergency broadcast system to provide advanced warnings to vacate the area in the event of tsunami and seiche events. The Disaster Readiness and Response Plan was develop in response to the Seattle Hazard Identification and Vulnerability Analysis (both available at http: // Impacts No Build Alternative Under the No Build Alternative, the existing geology and soils environment would essentially remain the same and there would be no change in existing risks from seismic hazards Locally Preferred Alternative Op e rationalim p acts Geologic risks consist of seismic hazards, seiches, and potential soil settlement, each of which could affect the condition of the trackway. Strong ground shaking could cause movement for the streetcar and possible derailment or damage to the rail alignment from ground movement and liquefaction. The trackway nearest the Pioneer Square District has high liquefaction susceptibility, whereas the Pike Street and Stewart Street areas of the study area are designated as very low susceptibility, but these roadways are still adjacent to areas of high liquefaction susceptibility. The streetcar track design would meet seismic standards including replacement of soft soils. Following a seismic event, a tsunami could inundate the Pioneer Square District. No other portion of the LPA would be within the zone of inundation; the existing and renovated seawall raised the ground level. There are no further design solutions to prevent hazards of inundation. Although original geologic or existing geotechnical conditions show a presence of soft or loose soils in the southern portion of the project alignment, the overall risk of settlement is low because the LPA would be entirely within existing roadway right-of-way where settlement has not occurred over multiple years of use. Historically, streetcars have operated in the same corridor. Engineering design and current seismic standards will be used to avoid impacts during 1 Approximately the southern one-third (Pioneer Square District) of the study area is in an area determined to be Site Class E (Soft Soil) according to the King County Soil Site Classes map (Map 11-5), based on the National Earthquake Hazard Reduction Program. The northern section of the study area is an area determined to be Site Class D (Stiff Soil); however, the alignment would run adjacent to and near the area mapped as being Site Class D (King County, 2010). TBG SEA MARCH 2016 ENVIRONMENTAL ASSESSMENT PAGE
210 GEOLOGIC AND SOIL RESOURCES operation. Neither of the OMFs is located on soft or loose soils; therefore, settlement is not anticipated in those areas. Construction Im p acts Impacts during construction would be associated with the equipment used to perform the construction, as well as the direct and indirect impacts of the construction activities. Construction activities have the potential to cause a number of geology- and soils-related short-term impacts on the environment. Construction activities would include disturbances of up to 8 feet to relocate utilities and augering of up to 15 feet to install the OCS poles. The South Lake Union OMF would include a retaining wall behind the sidewalk along Fairview Avenue that would support the site excavation of up to 5 feet lower than the sidewalk, because the storage tracks require a relatively flat grade. There are no other deep foundations required for structures or the construction of retaining walls. Impacts during construction would be associated with the equipment used to perform the construction, as well as the direct and indirect impacts of the construction activities. Soil erosion may occur during excavation of roadbed and stockpiling spoils during construction, where rain could erode soil piles. Construction BMPs consistent with the stormwater pollution protection plan to be prepared for the project would reduce the effects of erosion. Refer to Section 4.8, Stormwater/Water Quality, for information. Heavy equipment used during construction could cause ground vibration that may be of concern for historic properties and annoyance to people working and living in the area. The major sources of construction vibration could include vibratory ground improvement, earth excavation in hard ground using jackhammers, and vibratory rollers for subgrade compaction. As described in Section 4.4, Noise and Vibration, based on the existing geology and the building materials near the construction areas, no vibration impacts during construction are anticipated. Construction is not anticipated to reach groundwater depth in most of the study area, even in the Pioneer Square Historic District, where groundwater is most shallow (about 12 feet). The OCS suspension poles need to be placed as deep as 15 feet, but the OCS poles are not proposed in areas with shallow groundwater because the streetcars would be wireless in Pioneer Square Historic District. During construction, seismic hazards could occur without adequate warning, resulting in failures of excavation or ground settlement anywhere in the study area. Work schedules would likely be delayed as efforts are made to repair damaged components of the work. Some disruption could also occur to utilities or nearby structures from the damage to exposed cuts or fills. This impact is not specific to the Center City Connector. During such a rare event, Seattle would follow the Seattle s Disaster Readiness and Response Plan. During final design, SDOT will complete an additional geotechnical investigation to determine subsurface conditions and to identify the presence or absence of near-surface obstructions (e.g., manmade debris) to refine track and OMF design requirements and construction techniques, in accordance with current seismic standards. The project-specific subsurface investigation may include (1) test borings, (2) test pits, (3) geophysical surveys and testing, (4) laboratory testing, (5) geotechnical engineering analyses, and (6) evaluations such as bearing capacity, liquefaction and settlement, lateral spreading, and ground improvement, and (7) determination of which seismic resistance design standards apply. The additional testing would also address soil TBG SEA MARCH 2016 ENVIRONMENTAL ASSESSMENT PAGE
211 GEOLOGIC AND SOIL RESOURCES settlement probability to identify where soils need to be improved or removed to substantially reduce settlement risk. Engineering design and current seismic standards will be used to minimize potential impacts during construction. While seismic events can vary in degree of intensity, current seismic design standards can prevent most human health risks associated with unanticipated seismic events. Although a seismic event and resulting liquefaction cannot be entirely avoided, current building codes require projects to meet seismic design standards to reduce the effects of an event on the project and reduce risk to human life Mitigation Measures Due to standard engineering and design practices, no adverse geologic impacts have been identified; therefore, no mitigation is proposed. TBG SEA MARCH 2016 ENVIRONMENTAL ASSESSMENT PAGE
212
213 PUBLIC AND EMERGENCY SERVICES 4.12 Public and Emergency Services Public services include schools, community centers, cemeteries, and social service providers. Emergency services include fire and police stations and services, hospitals, nursing homes, and medical and dental clinics. Transportation projects can affect public and emergency services and utilities by increasing the demand for additional services, by temporarily disrupting service, or by increasing travel time for emergency services. Within the study area, there are fire, police, and emergency medical services, as well as solid waste and postal services. This section examines potential impacts of the Center City Connector on public and emergency services in the study area, which extends for approximately a ½-mile radius from the LPA alignment and components (see Figure ). The analysis determines whether the project would induce the need for additional services, impact accessibility or deliver of public services or affect response times of emergencies services Fire and Emergency Medical Services The Seattle Fire Department (SFD) provides fire and emergency medical services in the study area, which is where the department headquarters and three stations are located: Headquarters, 301 Second Avenue S Fire Station 2, 2320 Fourth Avenue Station 5, 925 Alaskan Way Fire Station 10, 400 S Washington Street Applicable Regulations WSDOT is the state s designated rail transit safety oversight agency pursuant to 49 CFR 659. In accordance with regulations adopted by WSDOT, a Streetcar System Safety Program Plan would be required. The city s fire alarm center is located at the corner of Fourth Avenue and Washington Street. Emergency fire and medical units are generally dispatched from the station closest to the call site, although units can be dispatched from other stations as well. In addition to the emergency medical units provided by SFD, several hospitals (Virginia Mason, Swedish Hospital, and Harborview Medical Center) are located outside of the study area but provide emergency medical services to persons in the study area when patients are transported by SFD or other private ambulance service providers to these hospitals. Harborview Medical Center is the nearest hospital and is the location of the headquarters for the SFD Medic One Program, which provides advanced life-support activities and responds to fires, hazardous materials calls, and rescue calls in the study area. The SFD s average response times in 2013 (from the time units were dispatched following a 911 call to their arrival at the site) were as follows: 4.45 minutes for fire and hazardous materials responses (provided by fire and special operations) 3.74 minutes for basic life support responses (provided by fire and medical units 3.74 minutes for advanced life support (provided by Medic One) (SFD, 2014) TBG SEA MARCH 2016 ENVIRONMENTAL ASSESSMENT PAGE
214 PUBLIC AND EMERGENCY SERVICES Figure Public Services within the Half-Mile Study Area TBG SEA MARCH 2016 ENVIRONMENTAL ASSESSMENT PAGE
215 PUBLIC AND EMERGENCY SERVICES The introduction of a new travel mode to a transportation corridor creates another point of conflict with moving vehicles and the potential to increase the number of emergency incidents. Traffic safety is addressed in Section 4.1, Transportation, and in more detail in the Ce nte rcity Conne ctor Transp ortation Te ch nicalre p ort (SDOT, 2014). Currently, none of the intersections along the alignment is designated as a high accident location by the City of Seattle, which means they have fewer than 10 accidents per year Police Emergency-response and public safety services are provided by the Seattle Police Department (SPD). The study area is within SPD s West Precinct. The West Precinct is located at 810 Virginia Avenue, approximately one block east of the main project route on Westlake Avenue. The SPD s Downtown Service Center is next to the West Precinct, at 820 Virginia Avenue. The main Seattle Police Headquarters is located in the study area, with the Seattle Justice Center, at 610 Fifth Avenue. SPD provides law enforcement and responds to 911 emergency calls throughout Seattle. SPD has officers and civilian personnel in four main bureaus: Patrol Operations, Criminal Intelligence, Special Operations, and Field Support. The SPD protects public safety in many ways, ranging from officers patrolling beats to the deployment of special teams and task forces, which focus on a variety of issues, including auto theft, drug dealing and violence, and crimes against children. As part of the existing streetcar patrol service, the SPD performs transit patrol services, law enforcement, and enforcement of streetcar rules. The SPD provides a streetcar safety training program for officers and security officers, which includes engagement with other security and public safety departments Impacts No Build Alternative The No Build Alternative would not result in impacts on public service in the study area. Traffic is expected to increase through 2035, which would slow traffic a little more than 1 minute in the southbound direction compared with today s travel during peak evening periods; therefore, response times are expected to increase, as well. Northbound is expected to be similar to today s travel times. There would be no change in the intersections, access points (driveways), or operations, other than slightly higher volumes of vehicles moving slower in Therefore, no changes in collision rates or types of accidents are expected Locally Preferred Alternative Operational Impacts Fire and Emergency Medical Services. The traffic analysis (see Section 4.1, Transportation) finds that operation of the Center City Connector would not delay traffic and emergency service response times along the planned route in 2018 compared to the No Build Alternative. However, in 2035, the LPA would increase travel time by as much as 1.5 minutes in the westbound direction on S Jackson Street approaching First Avenue compared to the No Build Alternative. To avoid delay, the streetcar trackway is designed to have a mountable curb, so emergency TBG SEA MARCH 2016 ENVIRONMENTAL ASSESSMENT PAGE
216 PUBLIC AND EMERGENCY SERVICES vehicles may use the trackway to circumvent impediments en route to an emergency, at the discretion of the service operator. Emergency vehicles may choose to use other routes in the grid roadway network during peak traffic periods to avoid this delay in emergency service response. In addition, the LPA would divert traffic, resulting in approximately 6 percent more vehicles on adjacent streets. However, traffic movements throughout the downtown study area would remain acceptable during peak-hour commute periods less than a half-minute increased delay at intersections within the study area compared to what they area today and slightly improved compared to the No Build Alternative. This is likely due to the convenience of the streetcar, which would reduce the need for multiple vehicle trips within the Center City area because drivers could park once and travel by streetcar to multiple destinations within the city. Therefore, on average, the LPA would not increase delays in emergency response times beyond the No Build Alternative. Any moving vehicle has the potential to induce or be involved in a collision; however, the LPA would include several safety design features and standard operating practices that would help to avoid and minimize the potential for incidents to occur. The project s exclusive-transit travel lane would minimize conflicts with vehicular traffic, bicycles, and pedestrians. Left turns in front of the streetcar would either be eliminated or, where permitted, motor vehicles turning left would have a separate signal time to avoid conflict with streetcars. Outside of designated intersections, crossing the trackway for motor vehicles would be prohibited. However, the exclusive-transit lane would include a mountable curb for emergency vehicles to use the travel lane or to cross over at their discretion. In addition, the streetcar facilities would be made of nonflammable materials, and the vehicles would be electrically powered and would not use combustible fuels. Where the streetcar would run in the roadway median, there is low potential for conflicts with ingress and egress points from parking garages (which would be limited to right-in and right-out access). The exception is where the LPA is proposed on the outside, eastbound lane along Stewart Street, which would pass in front of the Bon Macy s parking garage on Stewart Street and Third Avenue. In this case, the stations on Stewart Street near Third/ Fourth Avenue would be positioned east of the egress. A signal would alert vehicle drivers exiting into the shared traffic lane. Existing parking garages already include alarms to alert for cross-pedestrian and - vehicle traffic; therefore, the new signal would be consistent with expected vehicle driver responsibility to use judgment before advancing safely to avoid a collision. In addition, bike lanes are planned to have perpendicular crossings of the streetcar trackway, which would help avoid accidents from bicycle wheels becoming lodged in the trackway. Bicycle routes are not planned to occur parallel to streetcar alignment. Pedestrians would be encouraged to access the station at crosswalks, which provide access to the center stations. For more detail on bicycle safety, refer to the non-motorized analysis found in Section of this EA. The Seattle Streetcar System Safety Program Plan (Seattle, 2013) would be expanded for the Center City Connector with input from public service providers. It addresses procedures relevant to fire and emergency medical services, including a fire/life safety committee; safety, security, and emergency plans; and emergency preparedness (i.e., exercises and drills) to provide a safe environment for passengers, employees, and persons interacting with the streetcar. Final design may add hydrants so that both sides of the roadway are served. If there are not adequate fire hydrants, streetcar service could be temporarily shut down during fire emergencies because SFD regulations and procedures prevent placing fire hoses across tracks when streetcars are in operation. TBG SEA MARCH 2016 ENVIRONMENTAL ASSESSMENT PAGE
217 PUBLIC AND EMERGENCY SERVICES Police. The overall crime rate is not expected to increase as a result of the Center City Connector. Although an accident or crime-related incident could involve the streetcar, the risk of such occurrences would not be higher than presently exists for the public bus system in the area. Most crimes at transit stations are nonviolent incidents, such as vandalism and theft, or nuisance crimes such as disorderly conduct and drunkenness, and loitering. However, most rail transit passengers are 10 to 20 times less likely to experience those types of events while using rail transit than while walking, living, or driving in the neighborhoods near the rail transit system (FTA, 2006). Postal and Solid Waste Services. The loss of the commercial loading zones along the streetcar route would affect pick-up and delivery services, such as postal deliveries and solid waste removal. To minimize this effect, several potential loading strategies are under consideration, including providing all-day loading zones where additional right-of-way is available, providing loading zones on side streets, allowing on-street loading/unloading during early morning or late evening hours (outside of streetcar operating hours), and using alleys for deliveries or loading zone access. Section in the Transportation Section discusses impacts on on-street parking and loading zones. Similarly, solid waste removal could be restricted to non-operational hours where curbside service is the only option. Most of the waste removal zones are already accessed through alleyways or garages. Transportation Section identifies mitigation measures appropriate to address impacts on public service delivery (postal service, waste removal). Construction Impacts Fire and Emergency Medical Services. Impacts on public services during construction would be minimized by dedicating two lanes to the construction of the LPA, diverting traffic to adjacent roadways, eliminating left turns at some intersection, and removing loading and unloading zones so that two lanes of vehicle travel can be maintained throughout construction. Also, only segments of up to four to six blocks would be under construction at any given time. Potential effects during construction of the trackway (including OMF access/turnback track on Republican Street) would include slightly increased travel time or detours for emergency vehicles due to temporary lane closures and cross-road access restrictions or closures on evenings and weekends within the segment under construction. The delays would be negligible except for construction in the Pioneer Square area, where northbound traffic would be diverted from First Avenue to Alaskan Way. This would result in delays of approximately 15 seconds at intersections along Alaskan Way. This would be a relatively short-term impact because the total estimated construction period for the Pioneer Square segment is less than 8 months. These delays are expected to be a minor impact, because the proposed construction would be phased as opposed to disrupting the entire alignment at once, and emergency service providers would have alternatives routes available. Construction along Stewart Street and Olive Way would occur predominantly during evenings and on weekends, when traffic volumes are lower and access is more manageable, thus limiting impacts on emergency service. Construction of the OMF expansions is not expected to affect public-service response times or access. There is a potential for construction-related incidents that could require emergency response. Police. Crime incidents during construction are typically limited to trespassing and minor vandalism. Barriers would separate construction and staging areas; as a result, crime is not expected to increase substantially during construction. TBG SEA MARCH 2016 ENVIRONMENTAL ASSESSMENT PAGE
218 PUBLIC AND EMERGENCY SERVICES Postal and Waste Removal Services. Removing on-street parking and delivery zones to accommodate the trackway would affect public services, such as postal service and private delivery services. Most waste removal services occur in the alleyways and therefore would not be affected Mitigation Measures Potential operational impacts on public service and emergency service will be mitigated with the following measures: To minimize effects of delay in emergency response, the streetcar exclusive-transit lane will include a mountable curb for emergency vehicles to use or cross over at their discretion. To mitigate for loss of commercial loading zones, SDOT will provide all-day loading zones along the corridor where additional right-of-way is available and on side streets. Additionally, SDOT will allow on-street loading/unloading during early morning or late evening hours (outside of streetcar operating hours) and designate alleys for deliveries or loading zone access. Solid waste removal will be limited to access via alleyways and side streets; where curbside service is the only option, solid waste removal will be limited to hours when the streetcar is not operating. To address safety and emergency response coordination with the addition of the Streetcar service, the Seattle Streetcar System Safety Program Plan (Seattle, 2013) will be expanded for the Center City Connector with input from public service providers. It will address procedures relevant to fire and emergency medical services, including a fire/life safety committee; safety, security, and emergency plans; and emergency preparedness (i.e., exercises and drills) to provide a safe environment for passengers, employees, and persons interacting with the streetcar. To adequately respond to fires on either side of the streetcar track, during final design SDOT will consider adding hydrants so that both sides of the roadway are served. Potential construction impacts on public service and emergency service will be mitigated with the following measures: Prior to construction, applicable agencies will review and approve construction activities and traffic control plans. Emergency service providers will be provided with information on lane closures, detour routes, and construction schedules. SDOT will coordinate with SPD and SFD to maintain reliable access for emergency services during construction and to minimize delays in response times from construction activities and detours. Relocation of access for deliveries and pick-up services will be implemented prior to construction. Relocation strategies for access and delivery include using alleyways, allowing early and late delivery periods that avoid construction periods, and making special provisions for nearby loading zones outside of construction areas. TBG SEA MARCH 2016 ENVIRONMENTAL ASSESSMENT PAGE
219 PARKS AND RECREATIONAL RESOURCES 4.13 Parks and Recreational Resources There are more than 400 parks and open areas in the City of Seattle, including facilities such as community centers, open spaces, gardens, athletic fields, and off-leash areas for dogs. Parks in the study area (which is defined as one block on either side of the LPA alignment) are classified as triangle parks and/or downtown parks. Triangle parks are often dedicated as parks in the original plat rather than purchased for use. They are small sites typically composed of traffic islands or leftover pieces of land, and serve a transportation function. Downtown parks are typically small public spaces or beauty spots, which are small islands within the urban environment that present opportunities to enhance the city s character and identity, and the public s enjoyment of downtown, but are not large enough for substantial park facilities. They are typically between 0.1 and 5 acres (Seattle Parks and Recreation, 2009). 1 There are eight parks or recreational areas located within the study area shown on Figure and described briefly below. Additional information about location, size, and whether these facilities qualify as section 4(f) or Section 6(f) resources (see definitions in inset to right) is included in Table Westlake Square is a visually open plaza. The center 469-square-foot area is owned by the Seattle Parks and Recreation Department (Parks) and categorized as a triangle park. The outer portion of the plaza is city-owned right-of-way; together the square is approximately 2,740 square feet. The square was once an underground comfort station in the form of a bus stop shelter, built in It Applicable Regulations Section 4(f) of the Department of Transportation Act of 1966 (23 U.S.C. 138 and 49 U.S.C. 303) S ection4(f)prohibitstheft A from approvingaprojectorprogram thatusesland from asignificant park,recreationarea,w ildlifeor w aterfow lrefuge,orhistoricsite unlessthefolow ingcriteriaare m et:(1)thereisnofeasibleor prudentalternativetotheuseof theland,and(2)theproject includesalpossibleplanningto m inim izeharm totheproperty. Section 6(f) of the Land and Water Conservation Fund (LWCF) S ection6(f)protectsoutdoor recreationproperty thatw as acquired ordeveloped w ithl W CF grantassistance.s ection6(f) prohibitstheconversionof property acquiredordeveloped w iththesegrantstononrecreationalpurposesw ithout approvalofthen ationalp ark S ervice. was demolished and its rooms filled in Currently, Westlake Square is a concrete pedestrian island used for street crossings. It contains a few street trees, with no other amenities or activities. McGraw Square and the McGraw Square Plaza are visually one open plaza; however, the site consists of two separate properties (see Figure ): McGraw Square, which is a small triangular portion of the site (658 square feet) adjacent to Fifth Avenue and Stewart Street, owned by Parks, includes a historic statue of former Governor John H McGraw; and the 1 Neither triangle nor downtown parks contribute to usable open space or serve a primary recreational function. Therefore, they are not protected under Section 4(f), TBG SEA MARCH 2016 ENVIRONMENTAL ASSESSMENT PAGE
220 PARKS AND RECREATIONAL RESOURCES Figure Park Resources in the Center City Connector Study Area TBG SEA MARCH 2016 ENVIRONMENTAL ASSESSMENT PAGE
221 PARKS AND RECREATIONAL RESOURCES Table Park and Recreational Resources Within the Study Area Park Name Address Acreage Hours of Operation 4(f)/6(F) Resource? Ownership b Westlake Square 1900 Westlake Ave 469 square feet (with public rightof-way, it is 2,740 square feet) 6 a.m. 10 p.m. No/No Parks McGraw Square 1801 Stewart St c 658 square feet NA No/No The John H. McGraw statue is a Section 4(f) resource. The Plaza is not. Parks (maintained and managed by SDOT) Pioneer Place 100 Yesler Way 0.3 acre NA Yes (includes National Historic Landmark as well as park resource)/ No Parks Occidental Square S Main St and Occidental Ave S 0.6 acre 6 a.m. 10 p.m. Yes/No Parks Waterfall Garden Park 219 2nd Ave S 0.05 acre 8 a.m. 5:30 p.m. No/No Private, but open to public Union Station Square 3rd St, 2nd Ave, and Jackson St 0.04 acre (1,600- square-foot triangle) NA No/No Parks Hing Hay Park 423 Maynard Ave S 0.3 acre 6 a.m. 10 p.m. Yes/No Parks Klondike Gold Rush National Historic Park 319 Second Avenue South NA (located in a historic building former Cadillac Hotel) September to May: 7 days a week, 10 a.m. 5 p.m. May to June: 7 days a week, 9 a.m. 5 p.m. Yes/No National Park Service a The 2009 Seattle Park classification system serves as a basis for policies for programming and uses of City of Seattle parks and open spaces (Seattle Parks and Recreation, 2009). b Parks = Seattle Parks and Recreation TBG SEA MARCH 2016 ENVIRONMENTAL ASSESSMENT PAGE

222 PARKS AND RECREATIONAL RESOURCES Westlake Square Plaza, which is vacated city street right-of-way (Westlake Avenue and the terminus for the South Lake Union Streetcar line). The plaza is maintained and operated by SDOT. Westlake Plaza connects with McGraw Square, but it does not qualify as a park resource. McGraw Square was acquired by the City in 1911 for a public square and designated as a Seattle City Landmark in Pioneer Place is a downtown/ triangle park and registered on the NRHP as a National Historic Landmark. This triangular park contains benches and a historic totem pole and fountain adjacent to a small garden, which includes a historic pergola. The pergola cover originally served as a cover for passengers waiting for the previous streetcars that serviced this area from 1889 to Figure Plan View of McGraw Square versus Roadway Right-of-Way with LPA Tracks and Westlake Station Occidental Square is a large open space park that contains benches, historic totem poles, modern sculptures, outdoor seating, a large chess set, and movable café seating areas. It often hosts events with vendor activities. Waterfall Garden Park is a small, enclosed, pocket park developed as a tribute to United Parcel Service s first headquarters. Although privately owned, it remains open to the public during regular business hours and is locked at night. It contains a large, manmade 22-foot-high waterfall, many tables and chairs, and stepped-down, landscaped planter boxes. The rushing waterfall effectively removes outside street noises. Union Station Square is a downtown/triangle park. It serves as a traffic island in front of King Street Station. It is primarily open with street trees on its edges and a sculpture of square-stones that can serve as seating. It also contains a bus shelter. Hing Hay Park is a downtown park containing a red brick square and Asian artwork and pavilion structure. It serves as open space, meditation space, and meeting area in the Chinatown- International District. The Klondike Gold Rush National Historical Park is a series of places with the purpose of preserving the trails, historic structures, artifacts, landscapes, and stories associated with the Klondike Gold Rush of The Seattle Unit of the Klondike Gold Rush National Historical Park preserves the story of the stampede to the Yukon gold fields and Seattle s crucial role in this event. The Seattle Unit is located in the historic former Cadillac Hotel and provides information about of the historic Klondike Gold Rush in an indoor museum environment. TBG SEA MARCH 2016 ENVIRONMENTAL ASSESSMENT PAGE
223 PARKS AND RECREATIONAL RESOURCES Impacts No Build Alternative Under the No Build Alternative, none of the park resources would be affected Locally Preferred Alternatives Operational Impacts The LPA would travel in the street right-of-way that would pass adjacent to the following park facilities: Westlake Square, McGraw Square, Pioneer Place, Union Station Square and Klondike Gold Rush National Historic Park, as shown on Figure Other parks and recreational facilities in the study area are far enough away from the alignment and OMFs that there would be no impacts during streetcar operations. The Westlake Station platform and a crossover track as an optional turnback and storage track for the First Hill Streetcars would be adjacent to Westlake Square on Westlake Street between Stewart Street and Sixth Avenue (see Figure for station locations). Persons in Westlake Square would see the platform and streetcars arriving, departing, and using the turnback tracks, in addition to streetcars continuing along the existing tracks. The station would include a bell that sounds as trains arrive and leave the station. Access to the platform would include a crossing from Westlake Square, which serves as a traffic triangle for pedestrians crossing Westlake Street. There would be more streetcars visible from Westlake Square and more persons using the Square. The additional streetcars and the station bell noise would not affect the function of Westlake Square. One of the six potential TPSS (site No. 1) is proposed to be located on the Westlake Square. While the original square managed by the Seattle Park s Department is only 469 square feet, the total area of the Westlake Square including City right-of-way is approximately 2,740 square feet (0.06 acre). The TPSS would occupy up to 800 square feet (0.02 acre), which is approximately one-third of the Square s area. The TPSS enclosure would be above ground and include architectural enhancements (see Section for description and images of a TPSS). The TPSS may affect some of the park property and a portion of one sidewalk on one side of the triangle, but it would not alter Westlake Square s function as a traffic island for pedestrians. McGraw Square is adjacent and connected to the McGraw Streetcar Plaza, within which is the current southern terminus station of the South Lake Union Streetcar. The Center City Connector would not remove the tracks nor platform within the Plaza; however, it would relocate the primary Westlake Station for both northbound and southbound passengers to a center platform in Westlake Street as described above adjacent to Westlake Square. During typical operations, the streetcars would leave the station (southwest bound) and turn onto Stewart Street, passing by McGraw Square and the John H. McGraw Statue. During special events, when more frequent streetcar service may be needed, SDOT may use the existing streetcar station within the McGraw Streetcar Plaza as additional station and streetcar layover. None of these operational activities would change the appearance or function of McGraw Square nor would they encroach onto McGraw Square. TBG SEA MARCH 2016 ENVIRONMENTAL ASSESSMENT PAGE
224 PARKS AND RECREATIONAL RESOURCES The Pioneer Square station would be located just one intersection north of Pioneer Park. It would not intrude on any portion of park property, but it would provide more access to and from Pioneer Place Park and the adjoining Pioneer Square-Skid Road Historic District. Sidewalk curbs along First Avenue in Pioneer Square would be upgraded to ADA standards to enhance accessibility along the route. Along S Jackson Street, the LPA would travel on trackway built for the First Hill Streetcar line and pass in front of Klondike Gold Rush National Historic Park and Union Station Square. The LPA would add to the total number of streetcars passing in front of these two parks. However, the increase in streetcars would not affect Union Station Square s function as a bus stop and traffic island for pedestrians, and because the functions of the Klondike Gold Rush National Historic Park are indoors, there would be no effect on that park s functions either. The LPA would pass nearly one block away from Occidental Park, Waterfall Garden Park, and Hing Hay Park; therefore, the LPA would not affect the function of these parks, but it may result in more visitors to these parks. The LPA would not result in property acquisition from these facilities, and none of these parks contains uses that are dependent on quiet atmosphere. Therefore, the noise caused by passing streetcars or bells at the station would not affect the function of the park facilities. As discussed in Section 4.7, Visual and Aesthetic Resources, the LPA would not degrade visual quality. There are no park facilities near the OMFs, the proposed access tracks on Republican Street, or the turnback track at S Jackson Street and Eighth Avenue. Construction Impacts Construction activities would potentially include installing a TPSS within a portion of the Westlake Square. This may require closing a portion of the walkway on one-third of the square until construction is complete. The other two sidewalks would be open, which would facilitate access to each intersection crossing during construction. Construction activities would have minor, short-term impacts on the five parks adjacent to the LPA trackway, station platforms, and staging area for track welding (S Main Street): Westlake Square, McGraw Square, Pioneer Place, Occidental Square, and Waterfall Garden Park (see Figure ). The project would not encroach onto any of these parks for staging or construction activities. Temporary noise, vibration, dust, and equipment traffic from construction activities may affect the user experiences, but construction would occur within existing roadway right-of-way and would be limited in duration. Although partial roadway closures (two of the four lanes) along First Avenue would be necessary, access to adjacent uses would remain open. Some construction activities may affect sidewalks, resulting in short-term closures, but access to each park resource would be maintained. Occidental Square and Waterfall Garden Park are near the staging area proposed for track welding, which would occur within street rights-of-way. The welding may include noise for pounding steel for short periods, but none of the Occidental Square or the Waterfall Garden Park uses would be effected by short periods of noise. The Klondike Gold Rush National Historic Park is within one block of the track-welding staging area, but because the park museum s activities are located indoors and the entry is a full block away, construction would not affect Klondike Gold Rush National Park visitors. TBG SEA MARCH 2016 ENVIRONMENTAL ASSESSMENT PAGE
225 PARKS AND RECREATIONAL RESOURCES Routes for detouring one direction of travel around Pioneer Square (from First Avenue between Jackson Street to Cherry Street) would not affect the use of Pioneer Place or other parks; however, trucking routes to and from the construction areas may result in additional noise, vibration, and dust. In the north end of the study area, construction trucks would likely to use Stewart Street and Westlake Avenue, which pass by Westlake Square and McGraw Square. Both roadways are already heavily traveled, so truck traffic is not likely to change the user experience at these parks. In the south end of the study area, construction trucks would use Yesler Way and First Avenue to access construction areas. Yesler Way passes along the south side of Pioneer Square and park visitors would experience the nuisance of the passing trucks, which may limit the amount of time they spend at this location. However, this would not change the overall use and purpose of the square. Sections 4.1, Transportation, 4.2, Air Quality and Greenhouse Gas, 4.3, Noise and Vibration, and 4.7, Visual and Aesthetic Resources of this EA include more detailed discussions of construction-related impacts and mitigation measures to address these temporary impacts. Although the construction BMPs would include dust suppression measures and limit most noise to daytime hours, some users may avoid parks during construction or not stay as long, but after construction is completed, users would be expected to return. Due to the proposed construction plan and phasing (see description in Section ) most parks would not be affected for longer than 8 months. While rail welding may occur for a longer period, the noise would not affect the use of the nearby parks. No long-term impacts on the parks would result from construction activities. Other parks in the study area are either outside of the construction area or not close enough to be disturbed during construction Mitigation Measures For the impact of locating a TPSS on Westlake Square, SDOT will either select another one of the five other site locations under consideration to avoid this site, or the TPSS enclosure will be designed to provide a point of interest consistent with Seattle s design plans for the Square. The TPSS placement will not inhibit pedestrian circulation on the Square. Due to the short duration of each stage of construction and the mitigation measures included in relevant EA sections to address short-term, construction-related impacts on park users experience, no mitigation measures specific to park resources during construction are proposed. TBG SEA MARCH 2016 ENVIRONMENTAL ASSESSMENT PAGE
226
227 HISTORIC, CULTURAL, AND ARCHAEOLOGICAL RESOURCES/SECTION Historic, Cultural, and Archaeological, Resources/Section 106 To complete environmental review, a project receiving federal funding must demonstrate that it is in compliance with Section 106 of the National Historic Preservation Act (NHPA). To accomplish this, potential project impacts on historic properties must be evaluated to determine, in accordance with Section 106, whether the project would have adverse effects on them, and those effects must be mitigated. Cultural resources include historic and prehistoric archaeological sites, as well as districts, buildings, structures, objects, and landscapes, in addition to cultural or traditional places or resources that have value to a community, such as an Indian tribal group (NHPA Section 101). Historic properties are those cultural resources that are listed in or eligible for listing in the National Register of Historic Places (NRHP). Generally, properties must be at least 50 years of age to be eligible for listing in the NRHP, unless they are proven to have exceptional importance. The four primary NRHP criteria are listed in 36 CFR Consistent with Section 106 requirements, an Area of Potential Effects, or APE, for the project was established. An APE is the geographic area within which a project may cause direct or indirect alterations to the character or use of historic properties, if any exist. The APE for the project encompasses both aboveground and below-ground resources (Figure ).The aboveground APE for historic architectural resources includes buildings fronting the project limits. The belowground APE is limited to areas of ground disturbance and varies from 2 to 15 feet deep, depending on the excavation needed to relocate utilities, install tracks, provide power to and from the TPSS sites, or install OCS poles. The A pplicablefederalr egulations S ection106ofthen ationalhistoric P reservationa ct(n HP A)provides for protection of historic properties (36 CFR 800), which are defined as any prehistoric or historic district, site, building, structure, or object included in or eligible for listing in the National Register of Historic Places (NRHP). Properties are determined to be significant if they meet the criteria listed in 36 CFR 60.4 and retain sufficient integrity to convey that significance. S ection4(f)oftheu.s.departm entof T ransportationa ct(23 U.S.C.138and 49 U.S.C.303)also protects historic properties (see above definition). S ection110(f)ofthen HP A requires that federal agencies exercise a higher standard of care for undertakings that may directly and adversely affect N ationalhistoricl andm arks(nhls). The law requires that agencies, to the maximum extent possible, undertake such planning and actions as may be necessary to minimize harm to such landmark. When an agency s undertaking directly and adversely affects an NHL, or when projects under its jurisdiction or carried out by a state or local government under its delegation or approval so affect an NHL, the agency should consider all prudent and feasible alternatives to avoid an adverse effect on the NHL [Sec. 110(a)(2)(B) and Sec. 110(f)]. Washington State Department of Archaeology and Historic Preservation (DAHP) concurred with the APE on December 3, Project historians and archaeologists conducted a detailed literature review and records search for potential historic, cultural, and archaeological resources within the APE, as well as a review TBG SEA MARCH 2016 ENVIRONMENTAL ASSESSMENT PAGE
228 HISTORIC, CULTURAL, AND ARCHAEOLOGICAL RESOURCES/SECTION 106 Figure Area of Potential Effects (APE) TBG SEA MARCH 2016 ENVIRONMENTAL ASSESSMENT PAGE
229 HISTORIC, CULTURAL, AND ARCHAEOLOGICAL RESOURCES/SECTION 106 of the half-mile radius study area around the APE for previous archaeological surveys. In 2014, project historians surveyed each building in the APE built in 1969 or earlier to identify potential historic properties. Given the paved and urbanized nature of the project corridor, the extensive ground disturbance and changes to the geomorphology that have occurred over time, the absences of known significant archaeological resources in the APE, and the project s limited ground disturbance anticipated from the project, no subsurface archaeological survey was conducted. Section 101 of the NHPA requires consultation with federally recognized American Indian tribes when a proposed project might affect places or resources that have cultural value to a tribe. FTA consulted with the federally recognized Snoqualmie, Stillaguamish, Tulalip, Muckleshoot, and Yakama tribes, as well as with Duwamish Tribal Services, about the project and its potential effects on archaeological sites and traditional cultural places. Results of this consultation revealed no culturally sensitive resources in the project vicinity. This chapter summarizes the cultural resources/section 106 evaluation that was completed for the project. The detailed analysis can be found in the Center City Connector Cultural, Historic, and Archaeological Resources Technical Report (SDOT, 2015a), found in Appendix H14. Historic properties and cultural resources are also recognized and protected at the local level. An evaluation of potential project impacts on City of Seattle landmark properties and local historic districts can also be found in Appendix H14 (pages E-1 through E-8). Historic Architectural Resources There are 140 historic architectural resources, including buildings, structures, sites, and objects, located within the APE that are at least 50 years old by time construction would be completed on this project 1. There are also three historic districts, which are considered separate entities from the historic buildings they contain. 2 Therefore, there are 143 historic era properties located within the APE. Of these 143 properties, 102 are eligible for or listed in the NRHP (see complete list in Appendix D4.14), including: 3 historic districts (Pike Place Public Market, Pioneer Square-Skid Road, and Seattle Chinatown) with a total of 72 contributing buildings and objects. 27 historic buildings not contributing to one of the districts. The APE also contains a National Historic Landmark: The Pioneer Square National Historic Landmark includes five buildings and objects: the Pioneer Building, Pioneer Square Park, a totem pole, a pergola, and a fountain. These also contribute to the Pioneer Square-Skid Road Historic District. Forty-two buildings/objects in the APE were previously determined not eligible or noncontributing resources, or were recommended not eligible or noncontributing by FTA 1 Buildings build earlier than 1969 were reviewed for eligibility for the NRHP. While some are not yet 50 years old, it is anticipated that they will be by time construction is complete and therefore included in the survey. 2 Individual properties within a historic district are considered contributing resources if they retain integrity and convey a related or united history, aesthetic, or physical development that adds to the overall significance of a historic district. Properties that are not aesthetically or historically linked to the other resources within a historic district are considered noncontributing. TBG SEA MARCH 2016 ENVIRONMENTAL ASSESSMENT PAGE

 which are considered part of the historic properties to which they are")
230 HISTORIC, CULTURAL, AND ARCHAEOLOGICAL RESOURCES/SECTION 106 following the 2014 survey. The DAHP concurred with these determinations on October 27, Figures through show the properties constructed in or before 1969 and their status with respect to eligibility for the NRHP. Appendix H14 is organized by the identification numbers on Figures through , along with the building name for those that are listed in or determined eligible for the NRHP. Many of the historic properties on First Avenue and Stewart Street have adjacent areaways (see sidebar on the next page) which are considered part of the historic properties to which they are attached. The three historic districts described below collectively make up the visual setting and historic character of a large portion of the APE. Outside of these historic districts, the visual setting is urban with both historic and modern buildings intermixed. The visual setting includes wide sidewalks and heavily trafficked roadway, including electric trolley buses. Most of the historic properties were built when the city streets were paved with bricks and the roads included streetcars and tracks. P ike P lace P u blic M arketh istoric D istrict(with four contributing properties in the APE). In 1907, the Seattle City Council created a public market known as Pike Place along the waterfront, where local farmers could sell their produce to Seattle residents. It was an immediate success. Construction of a permanent structure to shelter the stalls was started soon after and completed by 1917, at which point the market had essentially taken on its current, now iconic appearance (as seen in the photo to the right). The market was composed of the Main Market with lower levels, as well as an Economy Market, Corner Market, and Sanitary Market. The market flourished through the 1920s and 1930s. The photo shows that the historic setting originally included streetcars and tracks. P ioneers qu are-s kid Road H istoric D istrict(with 54 contributing properties in the APE). Pioneer Square was the location of original settlement of the Seattle area, but the great fire of 1889 destroyed the original buildings. The rebuilding effort was modeled after the then popular Richardsonian Romanesque buildings in Chicago and on the East Coast. Characteristics of this style include a heavy masonry base, use of the Roman arch, and varied architectural details on each floor (Seattle Department of Neighborhoods, N.D.[a]). During the area s reconstruction, the boggy areas south of Yesler Way were A reaw aysare useable spaces beneath the sidewalks, located between the building walls and the walls supporting the streets. They are City rights-of-way owned by SDOT but often used by building owners. Areaways are typically open to the basement or accessible through doorways. They are particularly common in the Pioneer Square -Skid Road Historic District. Pike Place Market, Courtesy of Seattle Municipal Archives, Item Pioneer Square with Totem Pole, Courtesy of Seattle Municipal Archives, Item TBG SEA MARCH 2016 ENVIRONMENTAL ASSESSMENT PAGE
231 HISTORIC, CULTURAL, AND ARCHAEOLOGICAL RESOURCES/SECTION 106 Figure Historic Properties in Westlake and Pike Place Market Area TBG SEA MARCH 2016 ENVIRONMENTAL ASSESSMENT PAGE
232 HISTORIC, CULTURAL, AND ARCHAEOLOGICAL RESOURCES/SECTION 106 Figure Historic Properties along First Avenue and Pioneer Square Area TBG SEA MARCH 2016 ENVIRONMENTAL ASSESSMENT PAGE
233 HISTORIC, CULTURAL, AND ARCHAEOLOGICAL RESOURCES/SECTION 106 Figure Historic Properties in International District-Chinatown District TBG SEA MARCH 2016 ENVIRONMENTAL ASSESSMENT PAGE
234 HISTORIC, CULTURAL, AND ARCHAEOLOGICAL RESOURCES/SECTION 106 Figure Historic Properties in South Lake Union Area TBG SEA MARCH 2016 ENVIRONMENTAL ASSESSMENT PAGE
235 HISTORIC, CULTURAL, AND ARCHAEOLOGICAL RESOURCES/SECTION 106 filled in and regraded, and new sidewalks were constructed. The new city was built higher than the old city, leaving remnants of the old buildings and infrastructure below the street level in Pioneer Square. The focal point of the square itself, a triangular piece of land that was made into a public city park known as Pioneer Square Park (see photo), along with the Pioneer Building, the large Native American totem pole, the iron pergola, and the fountain, was named as a National Historic Landmark in The photo shows the historic setting, which originally included streetcars, tracks and overhead wires along First Avenue. S eattle C hinatown H istoric D istrict(with 14 contributing properties in the APE). This district marks the center of Seattle s Asian-American cultural history. Architecturally, it is characterized by three- to six-story brick hotels, one- and two-story commercial buildings, and automobile garages from the period primarily between 1907 and 1936 (Kreisman, 1986). Developed as a rich and ethnologically diverse neighborhood, the area became the cultural center for Chinese, Japanese, Filipino, Vietnamese, and African American immigrants (Seattle Department of Neighborhoods, N.D.[b]). Just like Pioneer Square-Skid Road, the original Chinatown was completely destroyed in the Great Fire of Between 1907 and 1910, the massive regrading project known as the Jackson Regrade filled in the muddy tide flat areas along S Jackson and S King Streets, which became the focal point for the new, rebuilt Chinatown. Archaeological Resources in the APE The archaeological literature search identified one archaeological site within the APE, near King Street Station along Jackson Street between Third and Fourth Avenues. However, this site was determined not eligible for listing in the NRHP by the DAHP. Field work areas just outside the APE, within two blocks of First Avenue, found heavily charcoal-stained layers, brick fragments of varying sizes, charcoal flecks and pieces, larger pieces of charred wood and fragments of unburned wood, wood stove waste (clinker and ash), organic layers probably representing sawdust, and one artifact (a stoneware ceramic sherd) possibly from the Great Seattle Fire of 1889 but none of these items was determined eligible for the NRHP (Northwest Archaeological Associates, 2006). Impacts No Build Alternative The No Build Alternative would not adversely affect any historic properties nor disturb the ground surface and therefore would not result in excavating archaeological sites Locally Preferred Alternative Operational Effects on Historic Properties This section describes potential effects on historic properties during operation of the Center City Connector. The project would not remove or damage any identified historic properties. An analysis using the FTA s noise and vibration modeling methodology described in Appendix H3, Center City Connector Noise and Vibration Technical Report (SDOT, 2015b), determined that with TBG SEA MARCH 2016 ENVIRONMENTAL ASSESSMENT PAGE
236 HISTORIC, CULTURAL, AND ARCHAEOLOGICAL RESOURCES/SECTION 106 appropriate avoidance measures, no moderate or severe noise or vibration effects would occur to any building within the corridor, regardless of historic status. The following operational analysis focuses on whether there would be adverse effects on the visual or historic setting of any historic properties as a result of: Operating streetcars (including tracks, stations, OCS wires, and support poles) Operating the OMFs Operating the TPSS Effects of Streetcar Tracks, Stations, OCS Wires and Support Poles This analysis is supported by the visual impact assessment described in the Center City Connector Visual and Aesthetic Resource Technical Repot (SDOT, 2015c).The visual setting of the buildings that line the corridor would not be affected by the operation of streetcars because the streetcars would be similar to existing buses in size and because the overhead contact wires mimic those of the electric trolley bus wires that currently operate throughout most of the APE, including the segments of First Avenue and Stewart Street. Still, to minimize the visual impact of the overhead wires, the design includes wireless portions within the Pioneer Square-Skid Road Historic District and, in the Pike Place Public Market Historic District overhead wires would only be installed on the east side of the street. OCS support poles would be consolidated with existing utility and light poles to minimize the number of new poles and create an even distribution of poles along the street sidewalks. The increased number of streetcars and overlapping operations of the South Lake Union and First Hill Streetcar lines would not detract from the historic character of any buildings or districts because the roadway currently experiences heavy traffic from vehicles, buses, and delivery trucks. Adding the trackway, including turnback tracks, would not detract from or affect the historic character of adjacent historic buildings because streetcars were an important component of the area s original historic setting. Since automobile traffic would be limited to one lane in either direction, the proposed project may result in less traffic interfering with views of the adjacent historic façades. Similarly, removal of parking would alleviate some of the visual clutter that distracts from viewing the buildings for some viewers. New stations would have a minor visual effects on the limited area surrounding their proposed locations within the historic districts, but the effects would not lower the overall visual quality of the districts and their contributing resources. All of the proposed stations except the Third/ Fourth Avenue Station on Stewart Street would be located in the center median, creating distance between the station structure and any historic buildings along the street. The new stations would not block views of or access to the historic properties; rather, the platforms would provide a vantage point from which to observe the historic buildings and would allow visitors easier access to the historic districts. The eastbound Third/ Fourth Avenue Station platform would be on the sidewalk in front of the historic Macy s Building (see Figure ). The widened sidewalk station area and appurtenances would not interfere with views of the awning and ornate detail on the multi-story, corner-parcel Macy s Building. Station appurtenances would be minimal and visually subtle in order to blend in or complement their surroundings. The station designs would be developed in consultation with historic TBG SEA MARCH 2016 ENVIRONMENTAL ASSESSMENT PAGE
237 HISTORIC, CULTURAL, AND ARCHAEOLOGICAL RESOURCES/SECTION 106 preservation boards and conform to the particular historic district s preservation ordinance and would not detract from its historic fabric. Similarly, paving material between the tracks and on the station platforms, and the design of OCS support poles and benches, would conform with the respective local historic districts preservation ordinances to minimize changes to the visual setting and historic character. A Certificate of Approval from appropriate local historic districts would be obtained prior to construction. No adverse effects on the historic districts are anticipated from having tracks, stations, or OCS wires within the roadway, as illustrated by Figures through Figure Simulation of Third/Fourth Station at Stewart Street and Olive Way TBG SEA MARCH 2016 ENVIRONMENTAL ASSESSMENT PAGE
238 HISTORIC, CULTURAL, AND ARCHAEOLOGICAL RESOURCES/SECTION 106 Figure Simulation of Pike Station Figure Simulation of Madison Station TBG SEA MARCH 2016 ENVIRONMENTAL ASSESSMENT PAGE
239 HISTORIC, CULTURAL, AND ARCHAEOLOGICAL RESOURCES/SECTION 106 Figure Simulation of Pioneer Square Station Effects from Operation of Expanded Operations and Maintenance Facilities Operation of the proposed OMFs expansion could affect visual setting and historic character in the APE. No other effects on historic properties are expected from operation of the expanded OMFs. No historic properties are located adjacent to the existing South Lake Union OMF or the proposed location for its expansion. As a result, it would have no effect on historic buildings. The existing Chinatown-International District OMF is located within the southern boundary of the local International Special Review District but outside the Seattle Chinatown Historic District boundary. There are no buildings that contribute to the NRHP district located in the immediate vicinity of the existing OMF and the expansion area would be to the south, farther away from the NRHP district. Therefore, operation of the expanded Chinatown-International District OMF would have no effects on historic properties. Effects from Operation of Traction Power Substations This section describes potential effects on visual setting and historic character from the TPSSs; no other effects on historic properties are expected from operation of the TPSSs. No historic properties are located adjacent to proposed TPSS Sites 1, 4, 5, and 6 (see Figures and ). As a result, they would have no effect on historic properties. TPSS Site 2 would be located within the NRHP-eligible Bon Macy s Parking Garage, as shown on Figure The character-defining features of the garage are its reinforced concrete parking-level floor plates and spiral (circular) entry and exit ramps at the north end of the building, which would remain intact. TBG SEA MARCH 2016 ENVIRONMENTAL ASSESSMENT PAGE

240 HISTORIC, CULTURAL, AND ARCHAEOLOGICAL RESOURCES/SECTION 106 The proposed TPSS site would not be visible from the street or sidewalk and would not visually alter any aspects of the building that make it eligible for listing in the NRHP. Operation of the TPSS would not affect these features. Figure TPSS Site 2 within NRHP-eligible Bon Macy s Parking Garage at Stewart Street and Third Avenue TPSS Site 3 would be constructed in a vacated Seneca Street right-of-way below First Avenue, adjacent to the Colonial Hotel/Grand Pacific Building, which is shown on Figure The building is listed in the NRHP for its architecture and is significant as the work of one of Seattle s major early architects and as representative of the working class hotels that once dominated the First Avenue streetscape. The main façade of the historic building overlooks First Avenue, and the small utilitarian structure would be located below the level of the building s primary storefront and main façade; therefore there would be no adverse effect on the setting or elements that contribute to the building s eligibility. There would be no adverse effects from the operation of the TPSS sites. Operational Effects on Archaeological Sites Operation of the Center City Connector streetcars, trackway, TPSS, and OMF expansion areas would not disturb archaeological sites. TBG SEA MARCH 2016 ENVIRONMENTAL ASSESSMENT PAGE
241 HISTORIC, CULTURAL, AND ARCHAEOLOGICAL RESOURCES/SECTION 106 Figure TPSS Site 3 Adjacent to NRHP-listed Colonial/Grand Pacific Building within Vacated Seneca Street and below First Avenue Construction Effects on Historic Properties Most Center City Connector construction activities and staging areas would be contained within existing street right-of-way, with limited construction activities within the sidewalk. While construction may require short detours for portions of sidewalks, access would be preserved to all buildings. Construction activities such as excavating the roadway, relocating utilities, welding and installing tracks, building station platforms, and installing OCS wires across the roadway would create temporary visual disturbance, noise, vibration, and dust. However, because these effects are temporary and would occur in a phased manner in small areas along the alignment, no adverse effects on historic properties are anticipated. The remainder of the construction analysis addresses activities that would occur outside the public right-of way, including the attachment of the OCS to historic buildings, the expansion of the OMFs, and the construction of TPSS sites inside or adjacent to historic buildings. Effects from Construction of OCS A physical effect on historic buildings could occur from the attachment of clips (eye bolts) to buildings as part of the OCS or from installation of contact-wire suspension poles to be fastened within historic areaways. No clips or OCS would be needed in the Pioneer Square-Skid Road Historic District. Figure illustrates a typical cross section of a pole attachment inside an areaway. The contact-wire suspension poles would be about 27 feet high and typically installed at intervals of 80 to 100 feet. Placement of these poles would generally occur in locations where poles already exist, and/or in locations where the number of street poles could be consolidated by combining light standards or other uses with the contact-wire suspension poles, as shown on Figure In addition, historic areaways would be avoided where possible. TBG SEA MARCH 2016 ENVIRONMENTAL ASSESSMENT PAGE

242 HISTORIC, CULTURAL, AND ARCHAEOLOGICAL RESOURCES/SECTION 106 Figure Cross Section of OCS Pole Attachment Figure Example of OCS Wire Suspension Pole Consolidated with Lighting and Signage Any required improvements made to areaways as a result of construction activities would follow the guidelines presented in the Secretary of the Interior s Standards for the Treatment of Historic Properties (National Park Service, 1995). If construction could affect a historic areaway, SDOT would survey the areaway before construction is initiated to verify the condition of the structure and determine if a Certificate of Approval from the City of Seattle is necessary. In some instances, in lieu of support poles, clips may be attached to buildings along the alignment to secure overhead wires. These would resemble the existing clips that currently hold electric trolley bus support wires, as shown on Figure Any clips required on historic properties would alter the physical building materials only in the immediate area of attachment. The nature and size of the hardware would be selected to limit effects. No clips or OCS would be used in the Pioneer Square-Skid Road Historic District. The attachment of any clips to historic buildings within the Pike Place Public Market Historic District would be implemented in conformance with the appropriate preservation ordinances. No adverse effects on the buildings are anticipated from the physical attachment of clips to building façades. TBG SEA MARCH 2016 ENVIRONMENTAL ASSESSMENT PAGE

243 HISTORIC, CULTURAL, AND ARCHAEOLOGICAL RESOURCES/SECTION 106 Effects from Construction of Expanded Operation and Maintenance Facilities The Center City Connector Project includes expansion of storage tracks for additional vehicle storage at one or both existing OMFs in the Chinatown-International District or South Lake Union neighborhood. There are no historic properties adjacent to the existing South Lake Union OMF, and its construction would have no effect on historic properties. The Chinatown-International District OMF expansion site is located within the southern boundary of the local International Special Review District but outside the NRHP-listed Seattle Chinatown Historic District. Therefore, construction of the expanded OMF would have no effect on historic properties, including the historic district. Figure Example of OCS Adhered to Historic Buildings in Pioneer Square Effects from Construction of Traction Power Substations There are six proposed TPSS sites, but only Site 2 and 3 could potentially have construction effects on historic properties. Site 2 is located in the Bon Macy s Parking Garage at Stewart Street and Third Avenue, which was determined NRHP-eligible in Construction of this TPSS within the historic garage would be temporary and would affect a small section of the large, utilitarian, nine-story, midcentury modern garage. The installation of the TPSS would remove 1 to 2 parking spaces but it would not affect the character-defining features of the garage consisting of reinforced concrete parking-level floor plates and spiral (circular) entry and exit ramps at the north end of the building. The TPSS at Site 3 would be constructed in a vacated Seneca Street right-of-way below First Avenue, adjacent to the historic Colonial Hotel/Grand Pacific Building, which is listed in the NRHP. The vacated right-of-way is located adjacent to the building s lower levels, beneath First Avenue and the historic building s primary elevation. This section of the building is below the main street level and is clad in construction-grade brick. Although some visual, noise, and vibration effects from the construction of the TPSS could occur, these effects would be minor; they would occur at a significant distance below the building s main entrance on First Avenue and away from its primary elevation. No adverse effects on historic properties are anticipated from construction of the proposed TPSS sites. Construction Effects on Archaeological Sites Much of the APE has had previous ground disturbance, fill, and development. However, data from previous projects, and the proximity of known historic and archaeological sites to the APE, suggest that intact archaeological sites likely exist beneath the ground surface in some areas at depths greater than 2.4 feet. The Center City Connector alignment runs along streets below which are existing utility corridors 8 to 15 deep, and most excavation associated with the project would not be this deep; therefore, it is possible but unlikely that construction activities would encounter unknown, intact sites. TBG SEA MARCH 2016 ENVIRONMENTAL ASSESSMENT PAGE
244 HISTORIC, CULTURAL, AND ARCHAEOLOGICAL RESOURCES/SECTION 106 Mitigation Measures FTA, in consultation with SHPO, has determined that no Adverse Effect on historic buildings or structures would result from the project due to the nature and scale of the project, the history of streetcars that were once common along most of the alignment, and the context-sensitive design measures that will make the stations and improvement visually compatible with their surroundings; therefore, no mitigation will be required. The project will have no effects on known archaeological or cultural sites. However, construction activities could encounter an unknown site. An archaeological monitor would be present to observe locations where ground-disturbing activities would reach 2.4 feet in depth or deeper, including the OMF expansion areas on the north and south ends of the APE, with the exception of activities existing utility corridors and where existing pole locations are re-used for new contact-wire suspension poles. Also, a draft Archaeological Monitoring and Inadvertent Discovery Plan is included in Appendix H14, which provides procedures to be followed should a potential archaeological site be discovered during construction. SDOT will consult with FTA, the SHPO, and interested tribes to finalize the plan prior to beginning construction. If potential prehistoric- or historic-period archaeological sites are encountered, the plan requires SDOT to consult with FTA and the SHPO, interested Indian tribes, and other interested parties, as appropriate, regarding eligibility for listing in the NRHP, project effects, necessary mitigation, and other treatment measures. TBG SEA MARCH 2016 ENVIRONMENTAL ASSESSMENT PAGE
245 ENVIRONMENTAL JUSTICE 4.15 Environmental Justice Presidential Executive Order on environmental justice requires federal agencies to take appropriate steps to identify and address disproportionately high and adverse impacts to minority and low-income populations. Disproportionate impacts are the effects of a project predominately borne by a minority and/or low-income population. USDOT Order (a) and Circular FTA C provide guidance on how to evaluate and address environmental justice impacts minority and low-income populations. Both documents require that the assessment of disproportionate impacts consider (a) impacts, (b) mitigation, and (c) any offsetting benefits that may also result from the project. This section summarizes how operation and construction of the Center City Connector could potentially impact, negatively and positively, minority and low-income populations within the study area. Appendix D4.15 contains more detailed information. The selected study area of 0.25 mile around the centerline of the alignment, 1,000 feet around the existing South Lake Union and Chinatown-International District OMFs, and 1,000 feet around proposed turnback tracks along Republican Street encompasses the most likely areas of project impacts on minority and low-income populations. (See Figure ) Study Area Demographics Demographic information on minority and low-income populations in the study area was compiled from U.S. Census 2010 data and American Community Survey data. Minority populations were analyzed at the Census block level, the smallest area available, using 2010 Census data; low-income populations were analyzed at the Census block group level using 2008 to 2012 American Community Survey data because data are not available at a smaller geographic scale. Table shows that the study area has a higher concentration of minority and low-income populations than the rest of the city. Almost half of study area residents (44 percent) are minorities. The highest concentrations are located at either end of the project, with pockets in South Lake Union and in Regulatory Framework Environmental Justice Presidential Executive Order 12898, Federal Actions to Address Environmental Justice in Minority Populations and Low Income Populations. U.S. Department of Transportation Departmental Order to Address Environmental Justice in Minority Populations and Low Income Populations (5610.2(a)) Environmental Justice Guidance The Center City Connector analysis followed the guiding Environmental Justice principles provided in USDOT Order (a) and FTA Circular : To avoid, minimize, or mitigate disproportionately high and adverse human health and environmental effects, including social and economic effects, on minority populations and low income populations. To ensure the full and fair participation by all potentially affected communities in the transportation decision making process. To prevent the denial of, reduction in, or significant delay in the receipt of benefits by minority and low income populations. the Chinatown-International District (Figure ). Table provides information on the minority populations within the study area by neighborhood. Of the minority populations in the TBG SEA MARCH 2016 ENVIRONMENTAL ASSESSMENT PAGE
246 ENVIRONMENTAL JUSTICE Figure Minority Populations within the Study Area TBG SEA MARCH 2016 ENVIRONMENTAL ASSESSMENT PAGE
247 ENVIRONMENTAL JUSTICE study area, most are Asian, with the highest concentration in the Chinatown-International District neighborhood, followed by Black or African American populations concentrated in the Pioneer Square and Commercial Core neighborhoods (see Table ). All the neighborhood districts in the study area, except Belltown, have a higher concentration African American populations compared to Seattle s overall 7.9 percent. However, only the Chinatown-International District greatly exceeds the proportion of Asian population (at 58.7 percent), compared to the overall Seattle Asian population of 13.8 percent. Neighborhood districts slightly exceed representation of Native American and Hispanic minority groups compared with Seattle overall. Table Demographic Characteristics Study Area Seattle Total Population 20, ,660 Minority (%) People Whose Income in the Past 12 Months is Below the Poverty Level (%) Median Household Income $36,890 $63,470 Source: U.S. Census Bureau, 2010 and Year American Community Survey, 2012 Table Minority Populations in the Study Area Neighborhood District White Black or African American American Indian and Alaska Native Asian Native Hawaiian/ other Pacific Islander Hispanic or Latino Other/Two or more races Denny Triangle 1,722 (68.8%) 100 (4.0%) 11 (0.4%) 427 (17.1%) 3 (0.1%) 143 (5.7%) 98 (3.9%) Belltown 2,091 (64.8%) 378 (11.7%) 73 (2.3%) 294 (9.1%) 12 (0.4%) 219 (6.8%) 159 (4.9%) Commercial Core 3,727 (64.9%) 964 (16.8%) 92 (1.6%) 531 (9.2%) 12 (0.2%) 275 (4.8%) 146 (2.5%) Pioneer Square 1,392 (57.5%) 495 (20.4%) 74 (3.1%) 139 (5.7%) 6 (0.2%) 200 (8.3%) 116 (4.7%) South Lake Union 1,861 (65.7%) 349 (12.3%) 29 (1.0%) 260 (9.2%) 16 (0.2%) 189 (6.7%) 128 (4.5%) Chinatown- International District 527 (21.2%) 243 (9.8%) 56 (2.2%) 1,461 (58.7%) 4 (0.2%) 127 (5.1%) 72 (2.9%) SoDo 101 (60.8%) 5 (3.0%) 6 (3.6%) 25 (15.1%) 8 (4.8%) 9 (5.4%) 12 (7.2%) City of Seattle 422,870 (69.5%) 48,316 (7.9%) 4,809 (0.8%) 84,215 (13.8%) 2,351 (0.4%) 40,329 (6.6%) 31,247 (5.1%) Source: U.S. Census, 2010 TBG SEA MARCH 2016 ENVIRONMENTAL ASSESSMENT PAGE
248 ENVIRONMENTAL JUSTICE The low-income population in the study area is more than double the percentage for Seattle as a whole, and the median household income for the study area is 60 percent of Seattle s median income (see Table ). Higher concentrations of low-income populations are found in the Commercial Core, Pioneer Square, and Chinatown-International District (Figure ). A number of social service organizations provide services to the minority and low-income populations in the study area, including organizations that provide shelter and food. There are 29 affordable housing facilities in the study area, including 13 that are located adjacent to the proposed project (see Figure ): Women's Wellness Center Plymouth on Stewart Yesler Terrace Apartments Gatewood Hotel Sanitary Market Livingston Baker Bell Tower Apartments Hotel Scargo Kasota Oxford Apartments Market House Condominium Pike Market Senior Center Lewiston Apartments In the study area, a little over 47 percent of households do not own an automobile. Households with no vehicle are transit-dependent, which can indicate low income. In Seattle, transit dependence may also be a lifestyle choice because the density of uses and availability of Environmental Justice Populations (USDOT Order ) Minority Persons: Black a person having origins in any of the black racial groups of Africa Hispanic a person of Mexican, Puerto Rican, Cuban, Central or South American, or other Spanish culture or origin, regardless of race Asian American a person having origins in any of the original peoples of the Far East, Southeast Asia, the Indian subcontinent, or the Pacific Islands American Indian or Alaskan Native a person having origins in any of the original people of North America and who maintains cultural identification through tribal affiliation or community recognition Low Income Persons: Persons whose median household income is at or below the Department of Health and Human Services poverty guidelines public transportation puts many necessary destinations within walking distance or one transit ride away. There is a large homeless population in Seattle. King County s 2015 One Night Out Survey documented 3,772 unsheltered individuals in the City on January 23, However, the number of homeless individuals typically residing within the study area is uncertain. The project will work with the Seattle Human Services Division to identify any areas of use by homeless populations along the project alignment. TBG SEA MARCH 2016 ENVIRONMENTAL ASSESSMENT PAGE

249 ENVIRONMENTAL JUSTICE Figure Low-Income Population within the Study Area TBG SEA MARCH 2016 ENVIRONMENTAL ASSESSMENT PAGE
250 ENVIRONMENTAL JUSTICE Limited-English proficient (LEP) individuals are those individuals who do not speak English as their primary language and who have limited ability to read, speak, write or understand English. While environmental justice guidance does not directly relate to LEP individuals, data on LEP individuals can provide additional information on minority populations in the study area that can provide projects with an awareness of potential language barriers that help makes outreach more effective. About 27 percent of the study area population is LEP (Table ). There are larger concentrations in the Chinatown-International District and SoDo neighborhoods. Table Languages Spoken at Home a Neighborhood District b English Less than Very Well - Spanish English Less than Very Well - Asian and Pacific Islander Languages Denny Triangle 0 40 (3.1%) Belltown 52 (1.4%) 63 (1.6%) Commercial Core 53 (1.1%) 175 (3.6%) Pioneer Square 57 (3.6%) 32 (2.0%) South Lake Union 55 (1.4%) 204 (5.1%) Chinatown-International District 111 (1.9%) 2,225 (39.0%) SoDo 66 (7.4%) 90 (10.2%) City of Seattle 9,330 (1.5%) 28,592 (4.6%) Source: Year American Community Survey, a U.S. Census Bureau American FactFinder 1 Year Estimates (DP02) b American Community Survey 5 Year estimates Outreach to Minority and Low-Income Populations Chapter 7, Public and Agency Outreach, describes the engagement activities performed for the planning and environmental review of the Center City Connector. This section summarizes that information and focuses on efforts targeted to engage minority and low-income populations. General public outreach for the project has included stakeholder interviews, four open houses, and media events. In addition, the City of Seattle streetcar system website links to a project webpage that provides project information, links that allow people to sign up for updates, and contact information. In addition, the City of Seattle requires programs and projects to develop an inclusive outreach and public engagement (IOPE) plan. This plan includes an equity analysis and incorporate best practices for reaching out to traditionally underrepresented populations, such as working with Neighborhood Service Center coordinators to distribute project and meeting information, stapling project information sheets onto sack lunches that are provided to homeless persons, 1 providing interpreters for non-english speakers at public meetings, and developing and 1 Operation Sack Lunch information sheets will let recipients know that construction is coming and provide information about how to get their belongings if they are left in the work zone and about resources and shelters in the area. TBG SEA MARCH 2016 ENVIRONMENTAL ASSESSMENT PAGE
251 ENVIRONMENTAL JUSTICE distributing translated informational materials. The IOPE plans use Census data to identify translation and interpretation needs. Early in the project s development process, SDOT collected information on how best to reach minority and low-income communities and collect stakeholder contact information. It then sought input from minority and lowincome populations on the alternatives and screening process. Project staff regularly informed those populations of the status of project development. SDOT provided project information materials to social service providers, low-income housing providers, and homeless shelters. As described below, public input was solicited at open houses and stakeholder interviews, and through coordination with Native American tribes. When the project conducted a survey on persons interests for using transit in downtown, almost 80 percent of respondents were residents within the downtown Center City. Respondents expressed support for exclusive-streetcar trackway to provide reliable and consistent streetcar service. Some respondents expressed concern about street trees, neighborhood character, parking and loading impacts, and traffic impacts. Overall, there were more comments from participants expressing support for the project than any other comment. Meaningful Public Engagement One of the guiding principles of Environmental Justice is to ensure the full and fair participation by all potentially affected communities in the transportation decision making process. This helps decisionmakers better balance the benefits of the project against its adverse effects; consider options to avoid, minimize, or mitigate adverse effects; and determine whether the project will result in the denial or reduction or delay in the receipt of project benefits by Environmental Justice populations. As part of project development, SDOT will continue to distribute materials throughout the environmental and design process, inviting the public and stakeholders to open houses and events, and soliciting their comments on the project. SDOT is also updating the IOPE plan. Open Houses. Five open houses were held at three Center City locations, shown in Table Invitations for two of them were translated into Chinese, Vietnamese, and Spanish, and more than 1,000 postcards in different languages were distributed at 30 downtown sites, including human and social service agencies and low-income housing locations. In addition, print ads announcing the open house were printed in the NW Asian Weekly and Real Change newspapers. SDOT provided Mandarin and Spanish interpreters at the first public meeting and it offered sign language as well as Mandarin, Spanish, Vietnamese, and Taiwanese translation services at the meetings, but none were requested. Most of those who commented expressed a desire for the project to move forward quickly. Other concerns focused primarily on construction impacts. Stakeholder Interviews. SDOT held or attended 24 meetings with 40 stakeholder groups, including community and human services organizations such as Seattle YMCA, Seattle Housing Authority, Plymouth Housing Group, Alliance for Pioneer Square, Historic South Downtown, Seattle Chinatown-International District Preservation and Development Authority, Seattle Chamber of Commerce, and King County Labor Council. These and other groups assisted in contacting minorities and identified other community-based organizations that provide services TBG SEA MARCH 2016 ENVIRONMENTAL ASSESSMENT PAGE
252 ENVIRONMENTAL JUSTICE to minority and low-income populations. 2 The outreach to these organizations was targeted to try to build engagement in the project development from minority and low-income populations and find out if they or associated service organizations had issues to consider in the environmental analysis process. The resulting feedback included consistent general support for the project, along with concerns focused on effects on business during construction and parking impacts. Native American Tribes. FTA has government-to-government responsibility for coordinating with federally recognized Native American tribes. The study area does not include tribal lands, but tribes are consulted about their interests regarding natural and cultural resources. Therefore, FTA initiated consultation with several potentially interested tribes: the Muckleshoot Indian Tribe, Snoqualmie Tribe, Stillaguamish Tribe, Tulalip Tribes, Confederated Tribes and Bands of the Yakama Nation, and Duwamish Tribal Services (an organization which is not federally recognized). FTA contacted the tribes by letter and offered in-person meetings. None of the Native American tribes expressed an interest in the project or voiced concerns over sensitive resources. FTA and SDOT will continue to consult if any tribes wish to do so. Table Open Houses Date Open House Forum Meeting Objective February 6, 2013 City Hall Discuss status of project development; receive input on range of alternatives. June 6, 2013 South Lake Union Discovery Center Project update; receive input on initial screening of alternatives. October 29, 2013 Pike Place Market Project update; receive input on second screening of alternatives. November 19, 2014 September 29 and 30, 2015 Pike Place Market City Hall Impacts No Build Alternative Project update; receive input on range of alternatives. Project update to receive input on project design and potential effects. The No Build Alternative would not directly affect low-income or minority populations or community facilities Locally Preferred Alternative This section analyzes the location, intensity, and duration of the project s environmental impacts during operation and construction to determine if any of the identified impacts would result in disproportionately high and adverse impacts on minority and/or low-income populations. Each environmental resources analysis is summarized in Appendix D4.15, and more detail is provided 2 Findings from stakeholder interviews can be found in Appendix P of the Seattle Center City Connector Transit Study Detailed Evaluation Report, Volume II, available on SDOT s project website: TBG SEA MARCH 2016 ENVIRONMENTAL ASSESSMENT PAGE
253 ENVIRONMENTAL JUSTICE in the other sections of Chapter 4 of this EA. This section summarizes key operation and construction impacts potentially affecting Environmental Justice populations. Operational Impacts The LPA would result in only minor adverse impacts on minority and/or low-income populations. Mitigation will further reduce the impacts. It would eliminate some onstreet parking, but there is adequate off-street parking available. Because the LPA would be within public right-of-way or Seattle-owned property, no acquisition or relocations are necessary. There would be no conversion of land use, and parks and historic properties would remain unharmed and functional as they exist today. The LPA would improve pedestrian and transit access along First Avenue and Westlake Avenue, connecting the South Lake Union and First Hill Streetcar lines. This will benefit all who live or work in the study area, especially transit-dependent populations. The project would maintain sidewalks and existing street crossings, and, where needed, upgrade crossings to meet ADA guidelines. Ultimately, the LPA would provide people with a convenient, reliable, and frequent transit service to easily and directly connect people in the study area with the neighborhoods currently served by the South Lake Union and First Hill Streetcar lines. The mobility benefits would accrue especially to lowerincome and transit-dependent populations, making it easier for them to access jobs, health care, and services. The potential noise and vibration impacts would be mitigated, there would be a minor change in access to or delay of public services, and the project would meet the design requirements for management of stormwater, seismic standards, and avoidance or cleanup of hazardous materials encountered during construction. The introduction of the streetcar and stations would be a visual change. However, the streetcar line would be visually compatible with the streetscape and incorporate context-sensitive design following neighborhood design guidelines. Minority and low-income populations in the study area would not experience adverse impacts that are materially different than those who are not minority and low-income population or people elsewhere in the city. Construction Impacts Disproportionately high and adverse effect on low income and minority populations is: (1) predominately borne by a minority population and/or a low income population; or (2) will be suffered by the minority population and/or low income population and is appreciably more severe or greater in magnitude than the adverse effect that will be suffered by the non minority population and/or non low income population. Impacts from the construction of the Center City Connector would be minor and temporary. To minimize impacts in any one area, the project would be staged over a two-year period along work areas of two- to eight-block segments. Work would last no more than eight months within each work area and occur mostly during weekday construction hours, although limited nighttime work would be necessary. The exception would be along Stewart Street where construction would be longer, but limited to weekends and evenings to avoid high traffic periods. TBG SEA MARCH 2016 ENVIRONMENTAL ASSESSMENT PAGE
254 ENVIRONMENTAL JUSTICE Short-term construction impacts that might be experienced by people in the study area, including low-income and minority populations, would include the following: Temporary increases in noise and vibration Temporary visual impacts such as the presence, storage, and movement of equipment and materials; lighting for nighttime work; and general visual nuisance around staging and construction areas Temporary increases in fugitive dust, construction-related exhaust, and other emissions Temporary traffic impacts, including changes in travel patterns, and the loss of on-street parking and loading and unloading access Temporary detours for pedestrians Community facilities, including those that provide services to minority and low-income populations, would also experience similar construction impacts. As described elsewhere in this EA, the project would fully or partially mitigate each of these impacts. Impacts that could not be fully mitigated would likely be annoying at times, but persons living and working in the area would experience these annoyances for relatively short periods. No known unique vulnerabilities, special exposure pathways, or cultural practices associated with minority populations and low-income populations in the study area would exacerbate the anticipated adverse effects. Compared to individuals elsewhere in the city, the minority and lowincome populations in the study area would not suffer high and adverse effects from the construction of the project Project Benefits USDOT Order (a) directs agencies to consider the benefits of a proposed transportation project when determining whether it could result in disproportionately high and adverse impacts on minority and low-income populations. The operation of the Center City Connector is anticipated to result in the following benefits: Improving connections to other neighborhoods for the people in study area neighborhoods, by connecting the First Hill and South Lake Union streetcar segments Providing transit travel-time savings and increased transit reliability, because the streetcar would be in exclusive lanes along much of the corridor Improving connections to other transit modes, such as Sound Transit Link and Sounder, Colman Dock ferries, and monorail and bus service, which would improve connections both locally and regionally Adding up to 22 new jobs to operate and maintain the new streetcar segment These benefits would apply to all populations who live, work, and visit the study area. For transit-dependent individuals, who tend to be lower-income and could include persons living in the affordable housing locations in the study area, the benefits of reliable transit service, increased transit reliability, and improved connections would be more important. TBG SEA MARCH 2016 ENVIRONMENTAL ASSESSMENT PAGE
255 ENVIRONMENTAL JUSTICE Environmental Justice Conclusion While there are higher minority and low-income populations in the study area than in the City as a whole, the Center City Connector would not result in adverse impacts on any population. Impacts would not be predominantly borne by a minority or low-income population; the identified impacts would not be greater in magnitude than the impacts that would be experienced by the non-minority and non-low-income populations in the study area; and the project would not result in adverse impacts on cultural and social resources especially important to minority and low-income populations. Any impacts during construction and operation would affect all populations to the same degree. Most project impacts would occur during construction; they would be limited in duration and would be further reduced by implementing the proposed mitigation measures and would not result in any adverse impacts. Complete information on project impacts and mitigation is provided in the other sections of this EA and is summarized in Appendix D4.15. Additionally, the Center City Connector would provide benefits for the traveling public as a whole, especially minority and low-income populations. Benefits would include a more reliable and efficient transportation system, improved mobility through the study area, and improved connections to other neighborhoods in Seattle due to the connections to the other streetcar lines and public transportation networks. Based on these conclusions, the Center City Connector would not result in disproportionately high and adverse effects on minority or low-income populations Mitigation Measures As noted above, other subsections of this EA describe specific mitigation measures for project construction and operation. Chapter 6 of this EA collects those measures. They are also summarized in Appendix D4.15. Additionally, the City of Seattle requires programs and projects to develop and implement an IOPE plan that outlines how the City will continue to provide outreach to traditionally underrepresented populations, including low-income, minority, homeless, and LEP individuals. SDOT will translate materials such as project notices into Chinese, Vietnamese, and Spanish, and distribute these materials at social service agencies and at affordable housing sites and offices throughout downtown. No other mitigation specific to environmental justice would be required. TBG SEA MARCH 2016 ENVIRONMENTAL ASSESSMENT PAGE
256
257 5 CUMULATIVE IMPACTS This chapter describes how the effects of the Center City Connector may contribute to the effects of other past, present, and future projects in the vicinity. The objective is to understand how the project might interact with impacts that persist from past actions, with present-day activities, and with other projects that are planned but have not been built yet. A cumulative impact assessment can reveal unintended consequences that might not be apparent when the project is evaluated in isolation. This cumulative impact assessment follows the approach recommended by the President s Council on Environmental Quality in Considering Cumulative Effects Under the National Environmental Policy Act (CEQ, 1997), and the following additional guidance documents: Consideration of Cumulative Impacts in EPA Review of NEPA Documents (EPA, 1999) Interim Guidance: Questions and Answers Regarding Indirect and Cumulative Impact Considerations in the NEPA Process (FHWA, 2003) Definition of Cumulative Impacts: The impact on the environment which results from the incremental impact of the action when added to other past, present, and reasonably foreseeable future actions regardless of what agency (Federal or non Federal) or person undertaking such other actions. Cumulative effects can result from individually minor but collectively significant actions taking place over a period of time. Guidance on the Consideration of Past Actions in Cumulative Effects Analysis (CEQ, 2005) Executive Order Indirect and Cumulative Effects Work Group Draft Baseline Report (ICF Consulting, 2005) Indirect and Cumulative Impact Analysis (National Cooperative Highway Research Program, 2006) For the project to incur a cumulative impact in combination with other reasonably foreseeable future projects, the project itself would have to cause an incremental impact. The opposite also is true. If the project does not present an incremental impact after avoidance, minimization, and mitigation measures are applied, then it would not result in a cumulative impact. This chapter only addresses incremental impacts that would result in a cumulative impact. Throughout the development of alternatives and impacts analyses, the project team has reached out to other agencies and the public to identify impacts of past and present developments and reasonably foreseeable future actions that could interact with the Center City Connector project. This chapter incorporates the results of these discussions. 5.1 Geographic and Temporal Boundaries of Cumulative Analysis The development actions that were considered include those that are past, present, and reasonably foreseeable as follows: TBG SEA MARCH 2016 ENVIRONMENTAL ASSESSMENT PAGE 5-1
258 CUMULATIVE IMPACTS Past actions include nonnative settlements dating back to the 1800s and continuing trends in urbanized development patterns up to the present. Present actions are those projects by local, state, or federal agencies just completed or under construction. Reasonably foreseeable future actions are those that have obtained local, state, or federal government approval and thus could be under construction at any time between the present through 2035 (the Center City s planning horizon year 1 ). The study areas for the cumulative impacts analysis are defined for each resource in Chapter 4. For air quality (including GHG) cumulative impacts are evaluated on the regional level. Social resources that may experience a range of cumulative impacts from new infrastructure projects (such as land use, local economic business, social impacts and neighborhoods, public services, visual resources, and parklands) were generally analyzed within 0.25 mile to 1 mile of the project limits. Built environment resources (such as property, hazardous materials, geology, electromagnetic fields, utilities, historic and archaeological resources, and noise and vibration) were evaluated within 1/8th of a mile or less around the project. 5.2 Past and Present Actions Impacts from past actions have shaped the project vicinity since the mid-19th century, and they continue to shape how Seattle is changing in response to economic and population growth and to development trends. Starting with the first nonnative settlements along the Duwamish River in the 1850s, development of the Seattle area was driven by timber harvesting, commercial fishing, shipbuilding, merchant shipping, railroads, aircraft manufacturing, and other heavy industry, as well as by development and expansion of the state and federal highway systems and by residential communities with their supporting infrastructure. Section (Historic, Archaeological, Architectural, and Cultural Resources Cultural Setting) briefly describes the historic setting and how it developed. In brief, the evolution from Native American tribes to current day Seattle Center City has resulted in the transformation of the project vicinity from tidelands and forested wilderness to a densely populated, urban environment. As Seattle became increasingly urban, dispersed suburban-population growth spread to surrounding areas. Such growth was notable in the decades after World War II, and it rapidly accelerated from the 1980s to the present. The predominant trend today is the densification of multiple use buildings and neighborhoods, including office, retail, and residential development uses. This pattern is being supported by upgrades in infrastructure, including recent utility upgrades and transportation and transit improvements. Recognizing that the pressure of increasing population growth would continue and intensify, in 2010 PSRC adopted the VISION 2040 (2010a; update to its 1990 long-range plan). Like its predecessor, this plan puts forth an integrated, long-range growth management, economic, and transportation strategy based on a vision of high-density, urbanized centers linked by a highquality multimodal transportation system. Its transportation element is called Transportation 2040 (2010b). VISION 2040 focuses growth on regional growth centers, which are areas of higher densities of population and employment served by multimodal transportation. These 1 The planning horizon is a future forecast year that often corresponds with the long-range plan horizon for transportation projects. TBG SEA MARCH 2016 ENVIRONMENTAL ASSESSMENT PAGE 5-2
259 CUMULATIVE IMPACTS centers also create opportunities for the arts, civic activity, commerce, and recreation. The Center City Connector advances policies identified in both VISION 2040 and Transportation 2040 by enhancing a transit system to serve a growing transportation need for planned density of residential and employment uses within designated urban areas in Seattle. 5.3 Reasonably Foreseeable Future Actions Reasonably foreseeable future actions (RFFAs) are considered regardless of the agency, organization, or person serving as their proponent. They must be likely to occur in the reasonably foreseeable future by virtue of being funded, approved, or under consideration for regulatory permitting; the subject of an environmental review process under NEPA or SEPA; or part of an officially adopted planning document or publicly available development plan. A number of substantial capital projects could overlap with the construction of the Center City Connector. One set of substantial projects includes waterfrontrelated projects (see inset above and to the right, and Waterfront Related Projects include many transportation, utility, and pier improvement projects from S Jackson Street (Pier 46) to approximately Battery Street (Pier 66). Several may have construction during the same period that the Center City Connector is under construction and involve closing portions of the waterfront area for project related construction and detouring traffic. Figure 5-1), including demolition of the Alaskan Way Viaduct; completion of the downtown SR 99 tunnel; the Elliott Bay Seawall Project; Waterfront Seattle; the Seattle Multimodal Terminal at Colman Dock Project; and numerous pier-improvement projects. Other types of RFFAs are roadway, transit, and development projects in downtown Seattle. RFFAs are listed in Table 5-1. Project information in Table 5-1 was adapted from the Elliot Bay Seawall Final EIS and the Waterfront Seattle Draft EIS and was updated based on current project information. The location of RFFAs is shown in Figure 5-1. TBG SEA MARCH 2016 ENVIRONMENTAL ASSESSMENT PAGE 5-3

260 CUMULATIVE IMPACTS Figure 5-1 RFFAs for the Seattle Area TBG SEA MARCH 2016 ENVIRONMENTAL ASSESSMENT PAGE 5-4
261 CUMULATIVE IMPACTS Table 5-1 RFFAs in the Seattle Area Project ID a Project Name Sponsor c Description/Proximity to Center City Connector 1 Pike Place Market Waterfront and Union Street Pedestrian Project 2 Waterfront Seattle Alaskan Way Promenade (Phase 2) 3A Alaskan Way Viaduct Replacement Program Alaskan Way Viaduct demolition 3B Alaskan Way Viaduct Replacement Program SR 99 Tunnel Project South Access Project North Access Project North Surface Street Connections Battery Street Tunnel decommissio ning 4 Elliott Bay Seawall Project (Phase 1 and 2) 5 Alaskan Way Relocate utilities SDOT SDOT WSDOT WSDOT SDOT WSDOT New pedestrian bridge and elevated walkways, stairway and elevator along Union Street from Post Alley to Alaskan Way one block west of Center City Connector Corridor. Replaces Alaskan Way with a new permanent roadway and a promenade extending north from the Overlook Walk to Broad Street two blocks west of Center City Connector corridor. The demolition of the SR 99 Viaduct would not occur until after the SR 99 Tunnel and associated project elements are complete. The Alaska Way Via Duct Replacement Program includes several sub-projects, each having their own schedule and duration. They include: SR 99 Tunnel Project, South Access Project, North Access Project, North surface street Connection, Alaskan Way Viaduct Demolition (see 3A above), and the Battery Street tunnel decommissioning. Phase 1 South rebuild the seawall from Yesler Way to Virginia Street. Phase 2 North rebuilds the seawall from Virginia St to Broad St and could restore Alaska Way to four lanes until Alaskan Way Promenade can be built. This project consists of numerous relocations of private utilities, two blocks west of Center City Connector corridor. Completion Year Transportation Economics Noise and Vibration Cultural, Historic, and Archaeological Resources Energy Resources Land Use, Shorelines, and Parks and 2018 X X Public Services and Utilities Social Resources and Environmental Justice X X X X X X X X X X X X X X X X X X X X X X X X X X X X Portions complete in 2016 and Tunnel expected to be open in or later (Phase 1) 2022 or later (Phase 2) Before demolition of the Alaskan Way Viaduct X X X X X X X X X X X X X X Visual Resources Fish, Wildlife, and Vegetation X X X X X X X X X X X X X X Water Resources Contaminated Materials Geology and Soils Air Quality TBG SEA MARCH 2016 ENVIRONMENTAL ASSESSMENT PAGE 5-5
262 CUMULATIVE IMPACTS Project ID a Project Name Sponsor c Description/Proximity to Center City Connector 6 Seattle Combined Sewer Overflow (CSO) System Upgrades 8 Union Street Pier Replacement 9 Union Street Gondola 10 Seattle Multimodal Terminal at Colman Dock 11 Terminal 46 Dock Rehabilitation, Crane Rail Extension and paving 12 Seattle Aquarium expansion 13 Waterfront Park/ Pier 62/63 14 Pier 66 Cruise Terminal Shore Power Upgrade 15 Elliott/ Western Connector 16A Pike-Pine Renaissance Seattle Public Utilities SDOT Private Developer WSDOT - Ferries Port of Seattle Seattle Aquarium Society and Seattle Parks and Recreation Seattle Parks and Recreation Port of Seattle SDOT Downtown Seattle Association Basins 70, 71 and 72 will be improved in close coordination with the Elliott Bay Seawall Project and Waterfront Seattle; this project will install a new 24- to 36-inch pipeline and remove or seal overflow structures in Alaskan Way between Pike Street and South King Street. Basin 69 will be upgraded later. Replace Waterfront Park with a new park on a rebuilt Union Street Pier. This project is approximately two blocks west of Center City Connector corridor. A gondola has been proposed on Union Street Pier linking Washington State Convention and Trade Center with Seattle waterfront via Union Street. Replace aging and seismically vulnerable components of Colman Dock, including vehicle and overhead loading structures on Slip 3, the main terminal building, and the timber portion of the dock, two blocks west of Center City Connector corridor near Pioneer Square. Repair deteriorated container berth pile caps and deck panels; repair terminal apron and container yard and extend dock crane rail to allow an additional 100-foot gauge crane. This is two blocks southwest of Center City Connector corridor. The Seattle Aquarium expansion includes the remodeling of the Seattle Aquarium at Pier 59 Central Waterfront Master Parks Plan c calls for replacing the existing Pier 62/63 with a reconfigured pier to be used for recreation, including temporary boat moorage. This is three blocks west of Center City Connector corridor. Upgrade the pier s electrical system to allow cruise ships to plug into shore power during calls to reduce diesel emissions The Elliott/Western Connector is a new roadway linking Alaskan Way to Elliott Ave and Western Ave over the BNSF mainline railroad tracks. It includes four traffic lanes with pedestrian and bicycle facilities, two blocks west of Center City Connector corridor. Urban design concepts to improve the Pike-Pine corridors in downtown Seattle from 1st Ave to I-5 with higher-quality, more consistent pedestrian space by upgrading the standards for sidewalks and intersections, including along and crossing portions of the Center City Connector corridor. Completion Year (Basins 70, 71 and 72) (Basin 69) Transportation Economics Noise and Vibration Cultural, Historic, and Archaeological Resources Energy Resources Land Use, Shorelines, and Parks and Public Services and Utilities Social Resources and Environmental Justice Visual Resources Fish, Wildlife, and Vegetation Water Resources Contaminated Materials X X X X X X X X X X X X X X X X X X X X Unknown X X X X X X X X X X X X X X X X X X X X X X X X 2022 X X X X X X X X X X X X X 2022 X X X X X X X X X X 2021 X X X X X X X X X X X X X X X X X X X X Unknown X X X X Geology and Soils Air Quality TBG SEA MARCH 2016 ENVIRONMENTAL ASSESSMENT PAGE 5-6
263 CUMULATIVE IMPACTS Project ID a Project Name Sponsor c Description/Proximity to Center City Connector 16B MarketFront Pike Place Market Preservation and Development Authority 17 (BME) S Main and S Washington Street Improvements 18 (UG) Next Gen Intelligent Transportation System 21 (BME) 22 (BME) Roosevelt to Downtown Project Westlake Transit Priority Improvement Project 23 Third Avenue Transit Corridor Improvements 24 Link Extensions (Light Rail) SDOT SDOT SDOT SDOT Sound Transit The MarketFront will be located on a 0.75-acre surface parking lot on Western Avenue. The location was formerly home to the Municipal Market Building, which was demolished after a fire damaged the building in Improve streetscape and sidewalks to provide improved connections and wayfinding between downtown Seattle and the waterfront, including along and crossing portions of the Center City Connector corridor. Technologies to help mitigate major planned project construction (SR 99 Tunnel Project, Elliott Bay Seawall, Waterfront, etc.). Major components include adaptive signals, dynamic message signs, transit priority, enhanced traveler information, FHWA model systems engineering, and parking evaluation and needs assessment. These measures overlap major portions of the Center City Connector study area. Provides a new high-capacity transit route for improved service between the University District and downtown Seattle via Eastlake Ave E, outside the Center City Connector study area. Reconfiguration of Westlake Avenue N from near Westlake Hub to Valley Street by replacing a general purpose traffic lane in each direction with either a Business Access Transit (BAT) or transit-only lane. The project is being completed to accommodate King County Metro bus Route 40, the RapidRide C Line, and the South Lake Union Streetcar. Extending transit priority measures, improved lighting, new bus shelters, and new artistic elements, sidewalk widening, and safety improvements, which connects with the Center City Connector study area on Stewart Street. University Link Extension will provide light rail service linking Seattle with University of Washington, then Lynnwood Link Extension will continue this line north to Northgate and Redmond Link Extension would expand the light rail east to Bellevue and Redmond across Lake Washington, which connects with the Center City Connector study area at the Westlake and King Street Intermodal Hubs. It is estimated that once North Link and East Link are expanded, bus traffic in the Downtown Transit Tunnel would move up to surface streets. Completion Year Transportation Economics Noise and Vibration Cultural, Historic, and Archaeological Resources Energy Resources Land Use, Shorelines, and Parks and Public Services and Utilities Social Resources and Environmental Justice X X X X 2018 X X X X X X X X X 2014 Ongoing X 2020 X X X 2016 X X X X X X X 2016 (University Link Extension) 2022 (Redmond Link Extension) 2023 (Lynnwood Link Extension) X X X X X X X X X X X X X Visual Resources Fish, Wildlife, and Vegetation Water Resources Contaminated Materials Geology and Soils Air Quality TBG SEA MARCH 2016 ENVIRONMENTAL ASSESSMENT PAGE 5-7
264 CUMULATIVE IMPACTS Project ID a Project Name Sponsor c Description/Proximity to Center City Connector 25 Interim South Downtown Pathways 26 Two-Way Columbia Street Pathway Project 27 Madison Corridor Bus Rapid Transit Project 28 Broadway Streetcar Extension 29 North Parking Lot Development (Qwest Field) 30 Battery Street Portal Park 31 SoDo Arena and Transportation improvements 32 First Avenue Sewer Upgrade Project Shown as star on map Private development (downtown Seattle and Belltown) King County SDOT SDOT SDOT King County Metro (TOD) City of Seattle Private Developer City of Seattle Various Developers a Project ID corresponds to ID on Figure 5-1. BME = beyond mapped extent; UG = undefined geographically b WSDOT = Washington State Department of Transportation c Seattle Parks and Recreation (2006). The project consists of moving buses to new permanent travel pathways starting with the Alaskan Way Viaduct demolition. The project will connect transit from south of downtown along the new Alaskan Way surface street to the 3rd Ave transit spine. First Avenue, the location of the Center City Connector, is being considered for detoured buses. Reroute bus routes from Southwest Seattle onto Alaskan Way and Columbia St up to 3rd Ave after Alaskan Way Promenade Overlook Walk is complete, which connects with the Center City Connector study area on Stewart Street. Implement bus rapid transit service on Madison Street between Colman Dock and 23rd Ave E in Madison Park, which would cross the Center City Connector study area. The project will extend the streetcar system in Seattle by approximately 0.5 mile north, through Capitol Hill, and will include two or three new stops, which is the northeast extension of First Hill Streetcar linking to Center City Connector. Proposal to develop 956 housing units and 25,000 square feet of ground level retail space, including a neighborhood grocer, shops, a restaurant, more than 1 acre of semipublic and private open space, and 1,035 automobile parking spaces, 500 of which would replace the site's existing public parking. This is four blocks south of the Center City Connector study area. Develop an open space created by closure of the north portal of the Battery Street Tunnel. This is four blocks north of the Center City Connector study area. Construct a new stadium in the SoDo area for professional basketball and hockey. This is four blocks south of the Center City Connector study area. Upgrade the antiquated sewer line that follows First Avenue adding an internal seal inside the existing pipeline. This project will precede the Center City Connector to avoid conflicting construction activities. Develop new residential and commercial space in downtown Seattle, comprising an estimated development of 4,500 residential units, 2,500 hotel rooms, 2 million square feet of office space, and 65,000 square feet of ground-floor retail. These are mostly one to four blocks north of the Center City Connector study area. Completion Year 2018 depending on Alaska Way demolition Transportation Economics Noise and Vibration Cultural, Historic, and Archaeological Resources Energy Resources Land Use, Shorelines, and Parks and Public Services and Utilities Social Resources and Environmental Justice X X X X 2019 X X X X X X X X X X X X X X X X X X X Unknown X X X X X X X X X X X X X X X X X X X X X X X 2017 X X X 2016 ongoing X X X X X X X X X X X X X X Visual Resources Fish, Wildlife, and Vegetation Water Resources Contaminated Materials Geology and Soils Air Quality TBG SEA MARCH 2016 ENVIRONMENTAL ASSESSMENT PAGE 5-8
265 CUMULATIVE IMPACTS 5.4 Cumulative Impact Assessment Direct and indirect impacts of the Center City Connector project that could contribute to future cumulative impacts and mitigation measures to address these impacts are discussed in Chapter 4 and briefly summarized in Appendix D4.15, Table D4.15-1, which summarizes the project s operational impacts, and Table D4.15-2, which summarizes similar information for the construction phase. A complete list of all mitigation measures can be found in Chapter 6 of this EA. The following sections discuss expected operational and construction cumulative impacts for each environmental discipline analyzed when Center City Connector impacts are combined with RFFAs Transportation The study area for the transportation cumulative impacts analysis is bounded by Stewart Street to the north, Fifth Avenue to the east, S Jackson Street to the south, and Alaskan Way to the west. The existing transportation system within Seattle includes regional and interstate travel along I-5 and SR 99; transit systems, including a transit tunnel, monorail, ferries, and major roadway transit corridors throughout downtown; non-motorized facilities, including pedestrian and bicycle facilities; and parking facilities. Operational Impacts The overlapping streetcar operation north to Republican Street would result in the intersection at Westlake Avenue and Republican Street operating at LOS F or a delay of 2½ minutes. This intersection is also projected to degrade to LOS F under the No Build Alternative with a 2- minute delay at the intersection. The City is developing improvements along to this Westlake Avenue that would change traffic patterns and improve intersection operations. One of these improvements is the re-channelization of Westlake Avenue to allow bus and streetcar priority within the corridor. These improvements along with the Center City Connector would have a positive effect on transit reliability and encourage people to use transit rather than drive. Operation of the Center City Connector in combination with other RFFAs such as Sound Transit s multiple Link (light rail) Extension projects, Madison Corridor Rapid Ride transit projects, Third Avenue Corridor Improvements, and Next Gen Intelligent Transportation System would augment transit ridership and enhance transit interconnectivity, overall mobility within the City of Seattle and between other transit modes, such as light rail and bus transit. The LPA and several RFFAs would enhance accessibility and safety for pedestrians and bicyclists as well as implement upgrades to be ADA compliant. The LPA along with Pike and Rennaissance, Union Street Gondola and Waterfront Promenade would improve intersections that have increased pedestrian volumes with wider sidewalks to ensure pedestrian safety at crosswalks and would provide or update pedestrian and wayfinding signage. While the Center City Connector, Westlake Avenue transit improvements, and the Madison Street Rapid Ride bus improvements would reduce on-street parking, the analysis of the Center City Connector project and the RFFAs reveals that existing off-street parking facilities can accommodate the demand for parking in the study area. Operation of Center City Connector, TBG SEA MARCH 2016 ENVIRONMENTAL ASSESSMENT PAGE 5-9
266 CUMULATIVE IMPACTS along with multiple other RFFA transit improvements would result in substantial beneficial cumulative impacts for persons desiring to move within the City Center without having to move their car. Collectively, RFFAs and Center City Connector are removing parking and eliminating some general purpose travel lanes in downtown Seattle. To address the cumulative effects of multiple changes to the roadway network and transit systems and improve regional connections in downtown Seattle, SDOT is jointly developing a Center City Mobility plan with King County, Sound Transit, and the Downtown Seattle Association. The plan will establish a transportation vision for 2035 and create a near-term transit operations and transportation management plan by mid-2016, along with a public realm plan for enhancing the right-of-way to better serve residents, employees, shoppers, and visitors. Construction Impacts Construction of several projects along the waterfront could overlap with construction of the Center City Connector. If this were to happen, the combined impacts of these projects could increase transportation impacts related to the Central City Connector, including additional delays in travel time along First Avenue and Alaskan Way. Cumulative transit impacts would include temporary detours of bus routes and ETB deadheading on First Avenue, as well as relocations of stops from the Center City Connector construction and from the two planned detour projects to accommodate changes along the Waterfront. These detour projects are the Two-way Columbia Street Pathway Project and the Interim South Downtown Pathways Project. The latter foresees using First Avenue to detour transit from Alaskan Way, whereas the Center City Connector proposes the opposite. If both projects are under construction, additional detours around the construction area may be necessary, including Alaskan Way, Western Avenue, Fourth Avenue and the Alaskan Way Viaduct. The Center City Connector project s diversion of northbound traffic around Pioneer Square (Segment 1) for up to 8 months may worsen congestion on Alaskan Way due to other overlapping RFFA construction schedules. This could affect access to the Seattle Port for both labor and freight, passengers accessing Seattle Colman Dock Ferry Terminal, and normal commuting patterns using Alaskan Way. With the current construction schedules of the Seawall and Alaskan Way Viaduct demolition, access points to Alaskan Way as a detour around Pioneer Square may degrade below City standards. However, depending on the timing of RFFAs, Alaskan Way could temporarily be restored to its original four- to five-lane configuration, which would be able to absorb the detours with a minimal reduction in traffic operations along Alaskan Way If construction of RFFAs overlap in time, and if Alaskan Way is still in the current two- to threelane configuration, the projected northbound volumes on Alaskan Way with the detoured northbound traffic around Pioneer Square together with congestion from other RFFAs projects would exceed 1,000 vehicles per hour in the PM peak hour. This would cause the Alaskan Way/Marion Street intersection to fail (operate at LOS F with average delay of approximately 170 seconds per vehicle) and cause queues to spill back to adjacent intersections on Alaskan Way. This would also affect freight traffic as well as general purpose traffic to and from the Ferry Terminal. Approximately 40 percent of the northbound traffic in the PM peak hour that would otherwise use First Avenue would have to find other detours to allow intersections on Alaskan Way to operate above the city s standard (LOS E or better). During construction of the TBG SEA MARCH 2016 ENVIRONMENTAL ASSESSMENT PAGE 5-10
267 CUMULATIVE IMPACTS Pioneer Square segment, the potential impacts of a northbound detour route would be mitigated through construction phasing and interagency coordination (see Section 5.5 Mitigation for details on proposed mitigation measures). Temporary construction haul routes for the Center City Connector along Westlake Avenue and Stewart Street for the north segments and Yesler Street and First Avenue S for the southern segments may temporarily overlap with other local private development haul routes and transit plans but are unlikely to conflict with waterfront projects. Parking and loading zones would be displaced along First Avenue and Stewart Street during construction. The impact would be the same as during operation of the Center City Connector. Overlapping construction for multiple projects may also create conflicting detour routes (i.e., automobile, transit, and bicycle routes), which would affect traffic flow and travel times in downtown Seattle. In Seattle, there are relatively few north-south routes (Alaska Way, First, Second, Third, Fourth, Fifth and Sixth Avenues) and some are one way, and Third Avenue is dedicated to Transit during peak commute hours. Therefore, there is a likelihood of several projects diverting traffic to the same roads, thus compounding traffic congestion. Adverse cumulative impacts associated with transportation during construction would be temporary and limited to periods of overlapping construction. For instance, the impact on traffic along Alaskan Way while the Pioneer Square Segment is under construction would be of high intensity before mitigation. However, the construction detour would likely only be in place for a short duration of approximately 6 months and could be phased so as not to conflict with other projects. Close coordination with other major projects and development of a collaborative detour plan would mitigate much of the traffic impacts; therefore, the magnitude would be low. To address potential cumulative construction impacts SDOT will convene a project coordination committee consisting of representatives from SDOT, the Washington State Department of Transportation, King County Metro, Washington State Ferries, the Port of Seattle, and Community Transit (agencies that participated in the Regional Transit Coordination for Downtown Seattle Committee). This committee will be responsible for resolving potential schedule conflicts between major public projects. SDOT will coordinate construction activities through the SDOT Street Use Construction Hub Coordination Program. The HUB team consists of project and on-site coordinators who assess work throughout construction in areas where multiple, simultaneous construction projects (both public and private) are occurring (see Chapter 6 for additional information on construction mitigation measures). Measures to mitigate parking during construction will be the same as those listed under operational impacts Air Quality and Greenhouse Gas The study area for the air quality and greenhouse gas cumulative impacts analysis is measured at the regional level. Many of the transit improvement and roadway RFFA projects are enhancing transit or nonmotorized transportation which reduce GHG and other pollutants. The operation of the Center City Connector in combination with other RFFAs (Link Extension, Madison Corridor Rapid Ride bus improvements, Third Avenue improvements, and implementation of the Bicycle Master Plan) would result in long term cumulative benefit in air quality and reduced GHG emissions. TBG SEA MARCH 2016 ENVIRONMENTAL ASSESSMENT PAGE 5-11
268 CUMULATIVE IMPACTS Increased air pollutants would occur during the construction period of any of the waterfrontrelated (including the demolition of the Alaska Way Viaduct), transit, roadway and development RFFAs. Typical air quality impacts during construction include fugitive dust particles, engine exhaust from construction vehicles, and VOCs and odorous compounds during asphalt paving. Each project would implement BMP measures to reduce fugitive dust during construction. Still, overlapping construction schedules could have a short-term cumulative air quality impact of high intensity but low magnitude because of the short duration and because air quality would improve from these projects during operation. Similarly, overlapping construction schedules would result in a slight, temporary cumulative increase in GHG emissions in the immediate area, resulting in low magnitude and intensity of impact with long-term operations resulting in beneficial impact Noise and Vibration The study area for the noise and vibration cumulative impacts analysis is the same as that for the Center City Connector: 125 feet for noise and 50 to 200 feet for vibration, depending on receptor category. In accordance with the FTA s Transit Noise and Vibration Guidance Manual (FTA, 2006), hourly sound data were collected for not less than 24 continuous hours. Throughout the corridor, existing noise measurements reached exterior sound level limits as delineated in the Seattle Municipal Code for each land use type (residential, commercial and industrial), reflecting an urban environment of heavy traffic, ongoing construction projects, and other background noise. Vibration was measured at below FTA thresholds near similar land uses. While the interior noise and vibration impacts of the Center City Connector can be mitigated to meet FTA and City code requirements, the Center City Connector streetcar combined with other transportation and transit RFFAs would still add background traffic noise to the urban environment. Since these combined noise effects are not expected to be perceptible in the noisy urban environment, these are considered to be low magnitude and intensity of impact. Vibration from passing streetcars would be similar to a passing bus and likely not perceptible to most persons. These conditions would not constitute a cumulatively significant change in the urban setting. The construction of the Center City Connector together with that of any overlapping RFFAs has the potential to contribute to cumulative noise impacts resulting from construction generated disturbance. However, a cumulative noise impact is dependent on two variables: proximity to similar sensitive receptors and construction occurring at the same time period. There are only a few projects that would overlap both physically and in the same time period with the Center City Connector. These projects consist of land use development projects along or nearby First Avenue, which may or may not be under construction at the same time. Other RFFAs are located farther way from the sensitive receptors common to the Center City Connector. Since all projects must meet the SMC noise ordinance, noise is expected to result in a moderate to low intensity, and since these are short-term impacts, a low magnitude of impact. Vibration is evaluated as an event and thus, unless multiple construction projects create vibration at precisely the same time, no cumulative vibration impacts are likely during construction or operation of the Center City Connector. TBG SEA MARCH 2016 ENVIRONMENTAL ASSESSMENT PAGE 5-12
269 CUMULATIVE IMPACTS Land Use The land use study area for cumulative impacts includes the area within a quarter mile of the Center City Connector and within 1,000 feet of the OMF expansion sites. During operation, the Center City Connector in conjunction with RFFAs would not change land use patterns or convert existing land uses. Temporary impacts to adjacent land uses during the relatively short construction period would vary depending on the neighborhood location but would not result in permanent land use changes or changes to land use patterns. There would be no cumulative land use impact from either operation or construction phases Economics The study area for the cumulative impacts analysis ranges across four Forecast Analysis Zones that cover the Center City of Seattle (see Figure 4.5-1). During operation, the Center City Connector and other RFFAs would generally enhance connectivity between employment centers within the study area and maintain mobility in the face of continued Seattle economic expansion. The cumulative loss of on-street parking would not affect businesses because there is ample off-street parking available downtown and multiple transit options to and within the City. The post-construction benefits to the economy would be driven by improved public safety, mobility, and accessibility, which would help to accommodate the growth in the number of residents and visitors, and associated revenues. Together, there would be cumulative economic benefit from the increased accessibility that the Center City Connector and the RFFAs would provide. All federally funded RFFAs, including the Center City Connector, have the potential to infuse the local Seattle economy with new money for construction, which would result in construction jobs and other employment related to local purchases by persons employed for construction of the project. There would be substantial economic benefits from increased construction jobs and local spending in the study area from multiple simultaneous construction activities in downtown Seattle. However, construction activities tend to reduce visits to local restaurants and retail stores when persons choose alternative locations to avoid traffic delays, reduced parking, or interference with access. The Seawall Project mitigation included compensating several local waterfront businesses for closing during construction; therefore, no additional impacts can burden those specific businesses. However, due to the numerous construction projects planned over the near future, there are potentially cumulative economic impacts on nearby businesses from a prolonged and expanded geographic area of construction; detours, reduced travel lanes and construction obstructions make accessing business that stay open difficult and thus businesses may suffer reduced patronage for a longer duration. The severity of reduced patronage may be worsened by increased difficulties in access and compounded construction nuisances. Several of these cumulative impacts may result from postponed SR 99 tunnel boring and the demolition of the Alaskan Way Viaduct and other waterfront-related RFFAs for waterfront businesses as well as businesses in the Pioneer Square and Commercial Core portions of the Center City Connector study area. A cumulative economic impact may occur where construction activities overlap near business areas, such as Pioneer Square and economic impacts from delays of freight movement from the Port of Seattle and associated freight traffic movements. TBG SEA MARCH 2016 ENVIRONMENTAL ASSESSMENT PAGE 5-13
270 CUMULATIVE IMPACTS While RFFA economic impacts along the waterfront is currently of high intensity and magnitude due to project delays and continued difficulties in circulation, the increment of cumulative construction impact from Center City Connector on businesses may be attributable to 4 to 6 months of increased traffic along the waterfront (see transportation mitigation in Section 5.5). In Pioneer Square, access to businesses would be maintained throughout all RFFA construction periods; therefore, the intensity of cumulative construction would be considered moderate, whereas other RFFAs would not directly affect the same businesses but would potentially indirectly affect the degree of visitors to this area; therefore, the RFFA construction period may result in a medium magnitude of impact Social and Community Impacts The study area for the social and community cumulative impacts analysis is the area within a quarter mile (5- to 10-minute walk) of the Center City Connector and within 1,000 feet of the proposed OMF expansion sites. The cumulative loss of parking could affect social and community resources; however, there is ample off-street parking available (albeit at higher rates than on-street parking), and existing PM peak-restricted parking stalls do not support residential parking needs. No displacements would occur as a result of the Center City Connector. The project, together with the transit, bike, and transportation RFFAs, would provide cumulative beneficial impacts on the area by providing connections between neighborhoods and enhancing public accessibility to multiple destinations (jobs, parks, community resources) and intermodal connectivity. The potentially overlapping construction periods could somewhat worsen economic impacts (reduced retail sales as a result of customers avoiding construction areas); increase noise, vibration, and dust; cause changes to traffic and transit patterns; and cause changes to visual settings. Residents in Belltown, South Lake Union, Pioneer Square, and the Chinatown- International Districts would be inconvenienced by construction activities, including the shortterm rerouting of bicycle and bus routes and potential short-term utilities disconnections. However, while residents and businesses adjacent to the project area may experience these impacts, the neighborhood cohesion and community resources would not be degraded. Therefore, there may short periods of high intensity of disturbance, but maintaining conformance with SMCs and mitigation measures would result in a low magnitude of social and community impacts Visual and Aesthetics Resources The study area for the cumulative impacts analysis is the viewshed from and of the Center City Connector corridor. Its visual character has largely been influenced by the City s historic orientation toward Elliott Bay, strong periods of urbanization through the Yukon gold rush of the late 1890s, timber industry development through the mid-1970s, and more recent high-rise development in response to a concentration of corporate headquarters and high-tech centers of business. The construction phase poses a potential for cumulative visual impacts. The adjacency of the waterfront-related projects (specifically with the demolition of the Alaskan Way Viaduct and staging areas for the SR 99 Tunnel Project), whose construction periods may overlap with that of the Center City Connector project, would result in broader areas of ongoing visual nuisance TBG SEA MARCH 2016 ENVIRONMENTAL ASSESSMENT PAGE 5-14
271 CUMULATIVE IMPACTS during construction in the Pioneer Square areas, where views of the waterfront projects are visible from First Avenue. Improvements at Pike Place Market (such as the Pike Place Renaissance) and other private development projects may require cuts in the roadway and staging areas nearby, resulting in cumulative visual impacts during construction. Similarly, there are multiple private development projects along Stewart Street that may be occurring while Center City Connector is under construction. However, visual impacts during construction would be approximately 4 to 8 months of overlap with Center City Connector segments and vary in severity depending on location and proximity to residences and tourist destinations, such as Pike Place Market and Pioneer Square. If construction projects overlap in the study area, elongating the periods of visual nuisance, the staging and construction areas adjacent to residences would cause short-term cumulatively adverse visual impacts during construction of high intensity but low magnitude because they are relatively short period of time and none of the visual impacts during construction would be permanent Stormwater/Water Quality The study area for water quality consists of the area that may be drained into two primary CSO basins and one storm drain system serving the Belltown neighborhood, all of which drain into Elliott Bay. Elliott Bay has historically been and is currently the receiving water body for final water discharge within the downtown area. Seattle Public Utilities, through its Combined Sewer Overflow Projects, has been updating most of the stormwater system so that downtown discharge water flows through the West Point Wastewater Treatment Plant before discharging into Elliott Bay. The Center City Connector and each of the RFFA are incrementally contributing to improving water quality by implementing Seattle s Stormwater Manual (City of Seattle, 2014) for stormwater quality and flow control. Collectively, these RFFAs would result in long term cumulative benefits to water quality, reversing the trend of water quality degradation in Elliott Bay that began in the early 1900s. Simultaneous construction of the Center City Connector and multiple RFFAs (most importantly, the Seawall Project and Alaskan Way Utility Relocation Project) may result in temporary adverse cumulative effects on water resources. In particular, demolition of the Alaskan Way Viaduct would result in extensive dust and debris at street level that could be washed into Elliott Bay during storm events, causing occasional turbidity plumes and potentially a local increase in the ph of nearshore water from concrete dust. In addition, work is continuing to cap contaminated sediment (see Section 4.10, Hazardous Materials) at the Colman Dock. These actions will eliminate long standing contaminant sources and contaminated sediments and benefit water quality. However, construction activities increase the risk of accidental spills, which could result in surface water contamination. The Center City Connector and the RFFAs would be required to meet City stormwater standards, implement stormwater BMPs, and implement spill prevention plans during construction, and to meet state water quality standards. Thus, cumulative effects of RFFAs in combination with the Center City Connector would likely be limited to occasional exceedances of water quality standards and would be cumulatively negligible intensity and magnitude. TBG SEA MARCH 2016 ENVIRONMENTAL ASSESSMENT PAGE 5-15
272 CUMULATIVE IMPACTS Utilities, Energy, and Electromagnetic Fields The study area for the utilities cumulative impacts analysis includes the public right-of-way where the project tracks and stations are proposed, and the OMF expansion sites. The Center City Connector in combination with improved transit and mobility RFFAs would assist in providing the avenue for a substantial shift from single occupancy vehicle travel to public transit for future conditions, which would be cumulatively more energy-efficient. The Center City Connector would include the relocation of utilities as needed to avoid long-term conflicts with maintenance or access, or to provide energy needed for construction activities. Utilities are expected to remain operational during RFFA construction phases, except for temporary short-term disruptions. These infrequent disruptions do not contribute to cumulative effects. BMPs would avoid construction-related EMF impacts. During construction of the Center City Connector and RFFAs energy would be expended. However, increased energy efficiency in building codes, and increased opportunities for bicycle, pedestrian, and transit use would result in a net reduction in long-term energy use. Although temporary cumulative energy impacts would be of moderate intensity, the addition of the Center City Connector construction and RFFAs would not cumulatively stress the existing energy systems in the region or in the study area, and, therefore, the impact would be of low magnitude Hazardous Materials The study area for the hazardous materials cumulative impacts analysis is the area adjacent to and within 1/8th of a mile from the proposed tracks and OMF sites. The potential for accidental spills at OMF sites together with other RFFA risks for spills can be avoided and are not anticipated to have a cumulative impact on the potential release of hazardous materials. The likelihood of impacts, both beneficial and adverse, on hazardous materials during temporary construction periods depends on the extent and characteristics of the hazardous materials at each site. Potential impacts related to construction include releasing, uncovering, or spreading of hazardous materials into the environment through disturbance of contaminated soils or groundwater, or by removal of existing contaminant sources for cleanup or prevention purposes. Many of the RFFAs and regulation driven cleanup and restoration projects are under way in the study area. As a consequence of the Center City Connector construction and the other RFFAs, contaminated materials would be removed and/or remediated within the work areas, in compliance with State and federal environmental regulations. Projects that have a potential for cumulative impacts include S Main and S Washington Street improvements, Central Waterfront CSO, Seattle Multimodal Terminal at Colman Dock, Union Street pier replacement and pedestrian projects, Pier 62 and 63 replacement, Elliott Bay Seawall Project (Phase 2), Battery Street Portal Park, and Alaskan Way Promenade (Phase 2). The cumulative effects of this work in conjunction with that of the other RFFAs and cleanup efforts in the vicinity should result in an overall improvement in conditions related to hazardous materials. TBG SEA MARCH 2016 ENVIRONMENTAL ASSESSMENT PAGE 5-16
273 CUMULATIVE IMPACTS Public Services and Safety The study area for the public services and safety cumulative impacts analysis is the area within 0.5 mile of the project components. The operations of the Center City Connector, combined with other RFFAs, is reducing safety hazards by making it easier for more people to travel via transit, which can reduce the number of potential collisions and provide safe modes of transportation and less burden on the emergency service providers on a per capita basis. With the RFFAs and Center City Connector in operational phase, there may less than a half-minute increased delay at intersections within the study area compared to what they area today and slightly improved compared to the No Build Alternative in Following mitigation measures, no cumulative adverse effects are expected on public services. Depending on the amount of overlap of RFFAs and Center City Connector construction periods, emergency service vehicles may experience delays in response times and the potential for heightened construction-related accidents. However, construction-related activities would not result in adverse cumulative impacts if projects are properly coordinated with emergency service providers per prescribed mitigation measures and if safety procedures are followed. Additionally, responding to the impacts of a natural event such as a tsunami or earthquake may be more difficult with the construction of multiple large projects occurring at the same time. However, the City has a streetcar system safety plan which will be expanded to include the Center City Connector as well as a City-wide Disaster Readiness and Response Plan that includes natural disaster planning. For this reason, and because construction impacts are temporary, cumulative emergency service impact would be of low intensity and magnitude during construction Park and Recreational Resources The study area for the park and recreational resources cumulative impacts analysis is the area adjacent to and within one city block of the proposed Center City Connector project components. Several RFFAs would augment the development of existing and new parks, such as Alaskan Way Promenade, Seattle Aquarium expansion, and Battery Street Portal Park. The Center City Connector and many of the RFFAs would cumulatively enhance accessibility to park resources. Therefore, the RFFAs in combination with the Center City Connector would result in beneficial impacts on park and recreational resources. Construction periods would have short-term negative impacts on use of park resources, such as noise, dust and visually unpleasant activities or material related to the project. However, none of the parks within the study area would be closed during construction of the Center City Connector or RFFAs. For this reason, and because construction impacts are temporary, cumulative parks impact would be of low intensity and magnitude during construction Historic, Archaeological, and Cultural Resources The area of potential effect for historic, archaeological, and cultural resources is within which lie the Pike Place Market Historic District, the Chinatown-International Historic District, and the Pioneer Square-Skid Road Historic District, as well as associated contributing historic properties TBG SEA MARCH 2016 ENVIRONMENTAL ASSESSMENT PAGE 5-17
274 CUMULATIVE IMPACTS and those properties eligible for or listed on the NRHP. Also included is the soil beneath this study area, where excavations would occur during construction. Operational Impacts A number of the projects along the waterfront would affect cultural, historic, and archeological resources. The cumulative impacts of these projects on historic resources were evaluated in environmental documents for the Elliott Bay Seawall, SR 99 Tunnel Project, and Waterfront Seattle and concurred on by the State Historic Preservation Officer. These analyses are incorporated by reference. Many of the RFFAs, including the Center City Connector, provide enhanced visual and physical access to Pioneer Square Historic District and Waterfront attractions, which is beneficial to maintaining the integrity and long-term use of the properties and historic districts. Clips on historic buildings to support the OCS support wires and other streetcar elements, such as stations, different pavement and streetcars would be added to those elements already in place for the ETBs. These are minor effects that would not affect the eligibility of historic buildings for the NRHP. Construction Impacts Although construction can lead to damage from any of the RFFAs, by implementing proper BMPs, the impacts are expected to be of low intensity and magnitude on historic resources. With each RFFA, there is high probability for discovery of archaeological resources during construction (although the soil has already been disturbed because of multiple deep excavation projects such as the Seawall Project, transit tunnel, and utilities). Archaeological resources are likely to be limited to items that reflect eras of construction, but such items are rarely of historical significance for preservation in place. Loss or degradation of these cultural resources would contribute to the cumulative reduction in the finite number of potential archaeological sites associated with waterfront-related RFFAs Environmental Justice The study area for Environmental Justice is 0.25 mile around the centerline of the alignment, 1,000 feet around the existing South Lake Union and Chinatown-International District OMFs, and 1,000 feet around proposed turnback tracks along Republican Street. This area has approximately 10 percent higher concentration of minority persons compared to the City of Seattle as a whole and more than twice the number of low-income population (28.5 percent) compared with Seattle as a whole (13.2 percent). The context is that this population is located in the area of Seattle with highest density, which means these populations have higher access to community resources, employment, and transit opportunities. The operations phase of the Center City Connector, together with RFFAs, would result in a cumulative improvement on transit circulation and access for all populations within the study area. This may be of higher benefit to low-income and transit-dependent populations, making it easier to access jobs, health care, and services. Cumulative construction traffic, noise, dust, and visual impacts would not be predominantly borne by a minority or low-income population for any of the RFFAs; the identified impacts TBG SEA MARCH 2016 ENVIRONMENTAL ASSESSMENT PAGE 5-18
275 CUMULATIVE IMPACTS would not be greater in magnitude than the impacts that would be experienced by the nonminority and non-low-income populations in the study area; and the project would not result in adverse impacts on cultural and social resources especially important to minority and lowincome populations. Any impacts during construction and operation would affect all populations to the same degree. Construction impacts would be limited in duration and would be further reduced by implementing the proposed mitigation measures. For this reason, and because construction impacts are temporary, compared to individuals elsewhere in the city, the minority and low-income populations in the study area would not suffer high and adverse cumulative effects from the construction of the project. 5.5 Mitigation Measures for Cumulative Effects During operation, the Center City Connector would result in predominantly beneficial effects and would not require mitigation measures. When combined with the RFFAs, the Center City Connector does have the potential to contribute to the cumulative impacts during construction. In this case, mitigation measures for the Center City Connector would substantially reduce potential impacts to less than significant. The following measures to minimize harm would be added when collaborating with other project construction planning efforts for impacts related to transportation, air quality, noise, and economics disciplines. Transportation. SDOT will convene a project coordination committee consisting of representatives of SDOT, the Washington State Department of Transportation, King County Metro, Washington State Ferries, the Port of Seattle, and Community Transit (agencies that participated in the Regional Transit Coordination for Downtown Seattle Committee). This committee will be responsible for resolving potential schedule conflicts between major public projects. As necessary, private development contractors will be included in coordination and construction phasing strategies. Issues for this project coordination committee include traffic circulation, detour routes, or staggered construction sequencing in efforts to avoid concentrations of congestion, overlap in transit detours, and relocated stops, and managing loss of parking and changes to bike routes during construction, as warranted. Additionally, SDOT will coordinate construction activities through the SDOT Street Use Construction Hub Coordination Program. The HUB team consists of project and on-site coordinators who assess work throughout construction in areas where multiple, simultaneous construction projects (both public and private) are occurring. The HUB team also coordinates with other City departments. Specific impacts due to construction of the Pioneer Square segment from the northbound detour route would be mitigated by SDOT (1) conducting an updated traffic evaluation of construction period-specific detours and implementing the potential traffic diversions identified below and (2) collaborating with other construction projects leaders to review how detour routes for Center City projects are collectively functioning for best traffic flow. Additional detours for northbound traffic flow around Pioneer Square and the Waterfront could include the following: Alaska Way viaduct (SR 99) via Dearborn Avenue (for traffic coming from south Seattle) and exit at First Avenue and Seneca. Wayfinding signage would be placed at S Holgate Street or S Atlantic Street in order to provide drivers enough time to use these detours. Alaskan Way to Marion Street for trips into downtown. Alaskan Way to Yesler Way or Western Avenue for shorter trips to the north end of Pioneer Square. TBG SEA MARCH 2016 ENVIRONMENTAL ASSESSMENT PAGE 5-19
276 CUMULATIVE IMPACTS South on Jackson Street and northbound on Second Avenue or south on Washington Street and northbound on Occidental Avenue when the construction zone is from limited to the area between Jackson Street and Yesler Street Air Quality. No mitigation is required as long as BMPs are applied. Noise. Construction activities would comply with all applicable noise regulations. SDOT will coordinate with the Department of Planning and Development to identify and work with private development contractors who will be working in the project area. Economics. To avoid overly straining retail, restaurant, and other business during construction periods, SDOT will coordinate through a project coordination committee made up of construction project managers and agencies with jurisdiction over the projects to provide a robust construction mitigation plan to address the needs of the businesses. The construction mitigation plan will include the following mitigation measures (these augment those mitigation measures listed in Section 5.4, Economics): Coordinate two-way communication between collective construction projects and businesses on construction schedules, changes, and potential detour routes, and provide regularly scheduled construction updates. Stagger projects and construction staging to maintain continued access, and provide directional signage that clearly directs visitors to businesses in the study area. Communicate and coordinate with public and private entities that own and operate various retail establishments and tourist activities in and around the study area to develop incentive programs or advertisements that encourage local residents and visitors to continue to visit and patronize the businesses. Social and Community Impacts. Most mitigation measures for other elements of the environment would benefit residents and businesses. In addition to implementing the proposed mitigation measures for noise and air quality, SDOT will coordinate through a project coordination committee made up of construction project managers and agencies with jurisdiction over the projects to manage conflicting construction schedules, as well as to provide a collective communication program that includes routine updates on construction sequencing and short-term utility interruptions and/or detours that may affect their transportation routines, as well as a onepoint hotline where local businesses and neighborhoods can inquire about multiple construction issues regardless of which project the issue concerns. Visual. SDOT will coordinate with simultaneous construction projects to shield staging areas, stagger construction periods when possible, and provide distractions in the form of community art or learning opportunities. Public Services. SDOT will coordinate through a project coordination committee made up of construction project managers and agencies with jurisdiction over the projects to discuss circulation as it relates to emergency service routes and confirm that adequate accessibility can be maintained throughout construction. TBG SEA MARCH 2016 ENVIRONMENTAL ASSESSMENT PAGE 5-20
277 6 MITIGATION MEASURES Mitigation is an important mechanism federal agencies can use to minimize potential adverse environmental impacts associated with project actions. Agencies can use mitigation to reduce environmental impacts in several ways: Avoid an impact by not taking a certain action or parts of an action. Minimize an impact by limiting the degree or magnitude of the action and implementation. Rectify an impact by repairing, rehabilitating, or restoring the affected environment. Reduce or eliminate an impact over time, through preservation and maintenance during the life of the action. Many of the project s potential impacts have already been eliminated or mitigated by elements that are now included in the definition and design of the project. Table 6-1 summarizes the mitigation measures that SDOT will implement to avoid, minimize, rectify, or compensate for impacts identified in previous chapters. For each resource, mitigation measures are provided for operational impacts, construction impacts, and cumulative impacts. If FTA makes a Finding of No Significant Impact, it will condition the finding on the implementation of appropriate mitigation and incorporate the mitigation into any future grant agreement that it may award the City of Seattle for construction of the Center City Connector. The City of Seattle will track the mitigation measures and report regularly to FTA to assure that it is meeting the mitigation commitments. TBG SEA MARCH 2016 ENVIRONMENTAL ASSESSMENT PAGE 6-1
278 MITIGATION MEASURES Table 6-1 Mitigation Measures by Discipline Impact Type Mitigation Measure Responsibility General Construction Construction To avoid and/or minimize impacts during construction, SDOT will develop a construction management plan that would require the contractor to follow industry best practices and specific construction mitigation measures as outlined herein for each resource. The construction management plan will be structured as follows: A transit and traffic control plan An air quality control plan A noise and vibration control plan A business retention during construction plan A public information plan Visual nuisance screening plan A temporary erosion and sediment control plan and a stormwater pollution prevention plan A utility relocation plan A standard, project-specific geotechnical investigation A spill prevention plan Emergency route plan An archaeological monitoring and inadvertent discovery plan SDOT will minimize the duration of construction impacts: Through construction phasing and scheduling that provides the most efficient schedule opportunities for a given segment. Through coordination with other projects in the area (see cumulative impacts coordination) SDOT and Contractor Phase of Implementation Construction TBG SEA MARCH 2016 ENVIRONMENTAL ASSESSMENT PAGE 6-2
279 MITIGATION MEASURES Impact Type Mitigation Measure Responsibility Transportation Operational Regional Roadways No mitigation will be required beyond the project design to improve intersection operations and general traffic operations with the LPA. Transit To mitigate conflicts with bus operations: Continue coordinating plan review with King County Metro, Sound Transit and Community Transit through final design through circulation of plans at the 60 percent and 90 percent design milestones and comment resolution. Plan bus service changes and stop locations to help alleviate passenger confusion. Design Streetcar and electric trolley bus interface electrical systems consistent with the existing South Lake Union and First Hill streetcar segments. Consult and coordinate with King County Metro to facilitate rerouting of Routes 16 and 66 to Third Avenue. Develop a joint use stop on First Avenue between Madison and Spring Streets to serve Route 12. This would be completed as part of the Madison Street BRT project. Prior to implementation of the BRT, Route 12 would be accommodated through design of the Center City Connector. Alternatively, SDOT is examining the option of early implementation of the joint use stop. Use coordinated signal timing developed as part of SDOT s The Next Generation ITS project to provide reliable north-south travel times along First Avenue and limit special streetcar signal phases to those that are required for a streetcar-only movement. Eliminate the inefficiencies of permissive left-turn movements along the First Avenue alignment and provide protected left-turn signal phases in locations where left turns are not restricted. To mitigate conflicts with electric trolley buses OCS systems and the Center City Connector: Maximize the use of battery drive to operate the streetcars through the Stewart Street and First Avenue segments. SDOT SDOT, Contractor, King County Metro, Sound Transit, Community Transit Phase of Implementation Final Design Final Design TBG SEA MARCH 2016 ENVIRONMENTAL ASSESSMENT PAGE 6-3
280 MITIGATION MEASURES Impact Type Mitigation Measure Responsibility Amend the existing inter-local agreement with King County that provides funding for the inspection and maintenance of joint use streetcar and electric trolley bus OCS system crossing hardware to incorporate Center City Connector project. Provide special crossing hardware and/or shift the electric trolley bus wires to allow movement of both the streetcar and electric trolley bus systems through the intersection. Shift or replace existing electric trolley bus crossing to accommodate new streetcar crossing hardware. Arterial and Local Roadways Phase of Implementation To maintain safe access to adjacent properties: Modify the first driveway south of Pike Street on the east side of First Avenue to right-in/right-out access (due to the proposed streetcar station located in the median at Pike Street). Provide signage and striping to the four remaining driveways to modify access to right-in/right-out movements to avoid left turns across the exclusive streetcar lane. Freight SDOT Final Design No mitigation will be required. Not applicable Not applicable Nonmotorized Facilities To help ensure pedestrian safety at crosswalks near stations: Locate crosswalks accessing the streetcar station median platforms at signalized intersections with signal phases provided for pedestrians. Add curb extensions and pedestrian signal improvements, such as leading pedestrian interval. Existing and future bicycle lane facilities would cross the streetcar tracks at a 90 degree angle (i.e., at Fifth, Fourth, and Second Avenues on Stewart Street). To avoid conflicts between streetcars and bicycles: Plan and implement existing and future bicycle lane facilities to cross the streetcar tracks at a 90 degree angle (i.e., at Fifth, Fourth, and Second Avenues on Stewart Street). SDOT Final Design TBG SEA MARCH 2016 ENVIRONMENTAL ASSESSMENT PAGE 6-4
281 MITIGATION MEASURES Impact Type Mitigation Measure Responsibility Direct bicyclists from Stewart Street and Olive Way via the existing bikeway at Seventh Avenue to the proposed Pike Street protected bike lane between Broadway and First Avenue, via the existing bikeway at Seventh Avenue. Update bicycle wayfinding signage. Parking Phase of Implementation To mitigate reduced on-street parking: Expand e-park participation and implement additional e-park wayfinding signage in the study area to help drivers navigate to offstreet parking garages, including to garages participating in the parking programs sponsored by Commute Seattle (where garages offer low or flat-rate parking options). To mitigate for the reduced availability of commercial vehicle and passenger loadings zones: Maintain existing all-day loading zones where possible. Create new all-day, on-street loading zones close to the corridor. Provide loading zones on side streets. Allow businesses to use alleys for deliveries or loading zone access. Allow on-street loading access during early morning and late evening hours. SDOT Construction and Operation Construction Regional Roadways No mitigation will be required. Not applicable Not applicable Transit To avoid conflicts between streetcar construction and bus operations: Coordinate in advance with King County Metro and Community Transit to plan bus service changes and stop locations during the construction of the project. Provide advanced notice to passengers, signs at bus stops, and signs along sidewalks that redirect passengers to the correct stops to help alleviate passenger confusion. To minimize impacts to electric trolley buses, SDOT, King County Metro, Community Transit, and Contractor Construction TBG SEA MARCH 2016 ENVIRONMENTAL ASSESSMENT PAGE 6-5
282 MITIGATION MEASURES Impact Type Mitigation Measure Responsibility Install infrastructure at strategic locations (to be developed with King County Metro) that will allow King County Metro to use battery power when these deadheading buses are following a detour route around the construction zone., Limit construction primarily to weekends to limit the need for deenergization outside standard King County Metro de-energization windows, along Stewart Street and Olive Way and consult with the King County Metro Construction Coordination Office to determine the best times for de-energizing. Apply best practices for temporary de-energizations, bus reroutes, and temporary bus stop closures/relocations that the City and King County Metro s Construction Coordination office have applied and refined through construction of the City s downtown paving program and First Hill Streetcar project. Arterials and Local Roadways Phase of Implementation Contractor will develop a traffic control plan to be approved by SDOT. In addition, to address event traffic during construction, SDOT will: Coordinate with the City s Special Events Committee and Seattle Police Department traffic control to provide enhanced public awareness of congestion and alternative modes for accessing events in addition to posting travelers advisories on the SDOT Blog and Website ( On the Move ) and include special events on the City Traveler s Map. Provide signing and wayfinding to help travelers access key destinations Provide flaggers and/or uniformed police officers at key intersections when needed to facilitate the movements of freight and generalpurpose traffic and expedite emergency vehicles. Coordinate traffic management through the SDOT HUB program. Freight SDOT and Contractor Construction No mitigation will be required. Not applicable Not applicable TBG SEA MARCH 2016 ENVIRONMENTAL ASSESSMENT PAGE 6-6
283 MITIGATION MEASURES Impact Type Mitigation Measure Responsibility Parking Measures to mitigate loss of parking during construction will be the same as those listed under operational impacts. Also, temporary loading zone designations could be used on a case-by-case basis to maintain commercial vehicle and passenger loading zones in reasonable proximity to businesses along the alignment, although this would lead to a reduction in paid parking spots. SDOT and Contractor Phase of Implementation Construction Nonmotorized facilities To avoid conflicts with nonmotorized facilities: Divert bicyclists from Stewart Street and Olive Way bikeways to one block north to Eighth Avenue and connect with the Bell Street bikeway and place detour signage in advance of the existing bikeway and along all decision points on the detour route. Place warning and detour signs will be placed without obstructing the pedestrian and bicyclist flow. SDOT and Contractor Construction Cumulative To mitigate against the potential for multiple construction projects to overlap in affecting similar areas of downtown Seattle, SDOT will: Require that the Center City Connector project manager will participate in the development of the Center City Mobility plan. To address multiple changes to the roadway network and transit systems and make better regional connections in downtown Seattle, SDOT is jointly developing a Center City Mobility plan with King County, Sound Transit, and the Downtown Seattle Association. The plan will establish a transportation vision for 2035 and create a nearterm transit operations and transportation management plan by mid- 2016, along with a public realm plan for enhancing the right-of-way to better serve residents, employees, shoppers and visitors. Convene a project coordination committee consisting of representatives of SDOT, the Washington State Department of Transportation, King County Metro, Washington State Ferries, Sound Transit, the Port of Seattle, and Community Transit (agencies that participated in the Regional Transit Coordination for Downtown Seattle Committee). This committee will be responsible for resolving potential schedule conflicts between major public projects. As SDOT, Contractor with other construction managers (capital improvement managers and private developers wherever construction project overlap occurs) Construction TBG SEA MARCH 2016 ENVIRONMENTAL ASSESSMENT PAGE 6-7
284 MITIGATION MEASURES Impact Type Mitigation Measure Responsibility necessary, private development contractors will be included in coordination and construction phasing strategies. Coordination issues for this committee include traffic circulation, detour routes, or staggered construction sequencing in efforts to avoid concentrations of congestion, overlap in transit detours, and relocated stops, and managing loss of parking and changes to bike routes during construction, as warranted. Coordinate construction activities through the SDOT Street Use Construction Hub Coordination Program. The HUB team consists of project and on-site coordinators who assess work throughout construction in areas where multiple, simultaneous construction projects (both public and private) are occurring. The HUB team also coordinates with other City departments. Specific impacts due to construction of the Pioneer Square segment from the northbound detour route would be mitigated by SDOT: Conducting an updated traffic evaluation of construction periodspecific detours and implementing the potential traffic diversions identified below, Collaborating with other construction projects leaders to review how detour routes for Center City projects are collectively functioning for best traffic flow. Additional detours for northbound traffic flow around Pioneer Square and the Waterfront could include the following: Alaska Way viaduct (SR 99) via Dearborn Avenue (for traffic coming from south Seattle) and exit at First Avenue and Seneca. Wayfinding signage would be placed at S Holgate Street or S Atlantic Street in order to provide drivers enough time to use these detours Alaskan Way to Marion Street for trips into downtown Alaskan Way to Yesler Way or Western Avenue for shorter trips to the north end of Pioneer Square South on Jackson Street and northbound on Second Avenue, or south on Washington Street and northbound on Occidental Avenue when the construction zone is limited to the area between Jackson Street and Yesler Way Phase of Implementation TBG SEA MARCH 2016 ENVIRONMENTAL ASSESSMENT PAGE 6-8
285 MITIGATION MEASURES Impact Type Mitigation Measure Responsibility Air Quality and Greenhouse Gas Phase of Implementation Operations No mitigation will be required. Not applicable Not applicable Construction During construction, impacts on air quality will be reduced and controlled in accordance with the City s Standard Specifications for Road, Bridge, and Municipal Construction (Section (3) and dust control BMPs described in the City s Construction Stormwater Control Technical Requirements Manual Volume 2 (Seattle Public Utilities, 2009). To reduce air quality impacts during constructions, BMPs will include: Spray exposed soil with water or other suppressants to reduce emissions of PM10 and deposition of particulate matter during dry periods. Use phased development to minimize disturbed areas. Use wind fencing to reduce disturbance to soils. Minimize dust emissions during transport of fill material or soil by wetting down or by providing adequate freeboard (i.e., space from the top of the material to the top of the truck bed) on trucks. Promptly clean up spills of transported material on public roads. Schedule work tasks to minimize disruption of the existing vehicle traffic on streets. Restrict traffic on the site to reduce soil upheaval and the transport of material to roadways. Locate construction equipment and truck staging areas away from sensitive receptors as practical and in consideration of potential impacts on other resources. Provide wheel washers to remove particulate matter that will otherwise be carried off the site by vehicles to decrease deposition of particulate matter on area roadways. Cover dirt, gravel, and debris piles as needed to reduce dust and wind-blown debris. Minimize odors on the site by covering loads of hot asphalt. Emissions of PM2.5, PM10, VOCs, NOX, SO2, and CO will be minimized by maintaining machinery engines in good mechanical condition to minimize exhaust emissions, which will be verified through yearly maintenance SDOT and Contractor Construction TBG SEA MARCH 2016 ENVIRONMENTAL ASSESSMENT PAGE 6-9
286 MITIGATION MEASURES Impact Type Mitigation Measure Responsibility records. In addition, contractors will reduce idling time of equipment and vehicles and use newer construction equipment or equipment with add-on emission controls, to be defined prior to issuing construction permits. Phase of Implementation Cumulative No additional mitigation is required. Not applicable Not applicable Noise and Vibration Operations Noise No mitigation is proposed at this time. However, streetcar bells noise impacts at stations will be verified with final operating parameters and if noise impacts result, the City will reduce the bell sound levels, or relocate the bells, to reduce noise to below FTA impact levels. Vibration Physical vibration impacts may occur at one property (401 Terry Avenue), which has existing South Lake Union streetcar track and crossover tracks adjacent to the building. The Center City Connector is not expected to increase this existing condition. If determined necessary, SDOT will conduct a more detailed vibration assessment during final design to confirm the results of the initial modeling. If it confirms the existing impact, SDOT will reduce the vibration to acceptable levels by relocating the crossover, using spring-loaded frogs to reduce the gap size between rails, or using resilient track fasteners. SDOT SDOT Final Design Final Design Construction Noise To satisfy Seattle Municipal Code for construction activities, a noise control plan will be developed and implemented to reduce community annoyance. This plan will include, but not be limited to, the following: Maintain a 1-foot-thick layer of muck or dirt in the bottom of haul truck beds. Use only ambient-sensing broadband backup alarms and minimize backing up. Limit engine idling to 5 minutes or less. Use radios for long-range communication; only use raised voices and public address systems in an emergency. SDOT and Contractor Construction TBG SEA MARCH 2016 ENVIRONMENTAL ASSESSMENT PAGE 6-10
287 MITIGATION MEASURES Impact Type Mitigation Measure Responsibility Use upgraded engine exhaust mufflers, engine shrouds, or sound enclosures on noisier equipment. Install portable sound barrier around noisier equipment. Use electric and hydraulic equipment instead of diesel or pneumatic equipment. Require the contractor to develop a noise control plan to identify and mitigate noise impacts based on specific means and methods. Develop noise limits, address complaints, and monitor noise levels during construction. Obtain a noise variance for work performed at night Vibration Phase of Implementation To minimize annoyance from construction-related vibration, develop and implement a vibration control plan. The plan will require that the contractor: Select haul routes to avoid areas with higher residential density, as feasible. Phase vibration-producing activities so they do not occur simultaneously, as feasible. Schedule vibration-producing activities outside time periods where sensitive receptors are most sensitive to vibration, as feasible. For example, execute vibration-producing work near residential buildings during daytime hours and commercial buildings during nighttime hours. Minimize the use of impact tools, such as hoe rams and jackhammers; use lower-vibration equipment, such as concrete saws, for demolishing existing pavement. Use lower power settings on vibratory rollers or large static rollers, as feasible. To completely avoid risk of cosmetic damage to areaways, heavy/strong vibratory construction equipment will maintain a buffer around the areaways of 8 feet to 15 feet, depending on the equipment being used. This buffer will limit vibration in areaways to 0.2 PPV (inches/second). SDOT and Contractor Construction TBG SEA MARCH 2016 ENVIRONMENTAL ASSESSMENT PAGE 6-11
288 MITIGATION MEASURES Impact Type Mitigation Measure Responsibility Cumulative Land Use/ Property Acquisition Construction activities will comply with applicable noise regulations. SDOT will coordinate with the Department of Planning and Development to identify and work with private development contractors who will be working in the project area. SDOT and Contractor Phase of Implementation Construction Operations No mitigation will be required. Not applicable Not applicable Construction No mitigation will be required. Not applicable Not applicable Cumulative No mitigation will be required. Not applicable Not applicable Economics Operations No mitigation will be required. Not applicable Not applicable Construction Cumulative SDOT will work directly with affected businesses to develop a business mitigation plan. At a minimum, this plan will include: Provide signage alerting potential customers that businesses are open during construction, and clearly mark detours as appropriate. Provide the public with construction updates, alerts, and schedules through informational meetings, a project website, and other forms of communication. Develop a promotion and marketing plan to help affected businesses maintain their customer base during construction. Maintain access to each business as much as possible during construction and coordinate with businesses during times where access might be limited. Coordinate construction activities with other capital improvement projects to minimize construction impacts and competing needs for detour routes. Implement parking and access mitigation strategies described in the Transportation, Parking Operations Mitigation section above. To avoid overly straining retail, restaurant, and other businesses during construction periods, SDOT will coordinate through a project coordination committee made up of construction project managers and agencies with jurisdiction over the projects to provide a robust construction mitigation plan to address the needs of the businesses by implementing construction SDOT and Contractor SDOT, Contractor with other construction managers (capital improvement managers and private Construction Construction TBG SEA MARCH 2016 ENVIRONMENTAL ASSESSMENT PAGE 6-12
289 MITIGATION MEASURES Impact Type Mitigation Measure Responsibility Social and Community Effect measures (these augment those economics construction mitigation measures listed above): Coordinate two-way communication between collective construction projects and businesses on schedule, changes, and potential detour routes, among other potential impacts on businesses. Stagger projects and construction staging to maintain continued access and directional signage that clearly directs visitors to businesses in the study area. Communicate and coordinate with public and private entities that own and operate various retail establishments and tourist activities in and around the study area to develop incentive programs or advertisements that encourage local residents and visitors to continue to visit and patronize the businesses. developers wherever construction project overlap occurs) Phase of Implementation Operations No mitigation will be required. Not applicable Not applicable Construction SDOT will develop and implement a Public Information Plan, which would include the following elements: Build routine communication programs with community organizations and service providers in the project area to make them aware of construction activities that may affect the community and service providers. Provide targeted outreach to businesses and individuals directly affected (fronting construction areas) by the project. Hold regular coordination meetings with project team and public outreach staff so that messages to the public are accurate, timely, and, to the extent possible, provide advanced warning of construction activities that may affect routine daily activities. SDOT and Contractor Construction Cumulative SDOT will coordinate through a project coordination committee made up of SDOT, Contractor with Construction construction project managers and agencies with jurisdiction over the projects other construction to manage conflicting construction schedules, as well as a collective managers (capital communication program, including routine updates on construction improvement sequencing and short-term utility interruptions and/or detours that may affect managers and private their transportation routines, and provide a one-point hotline where local developers wherever businesses and neighborhoods can inquire about multiple construction issues regardless of which project the issue concerns. TBG SEA MARCH 2016 ENVIRONMENTAL ASSESSMENT PAGE 6-13
290 MITIGATION MEASURES Impact Type Mitigation Measure Responsibility construction project overlap occurs) Phase of Implementation Visual and Aesthetic Resources Operations No mitigation will be required. Not applicable Not applicable Construction Temporary visual impacts during construction will be mitigated by screening construction zones and staging areas. Nighttime lighting will be directed downward to reduce the impacts of light on adjacent residences. SDOT and Contractor Construction Cumulative SDOT will coordinate with simultaneous construction projects to shield staging areas, stagger construction periods when possible, and provide distractions in the form of community art or learning opportunities. SDOT and Contractor Construction Stormwater/Water Quality Operations No mitigation will be required. Not applicable Not applicable Construction SDOT will obtain a National Pollutant Discharge Elimination System Program General Permit for Stormwater Discharges Associated with Construction Activities prior to commencing construction. One of the permit requirements is a project-specific Stormwater Pollution Prevention Plan and Sediment Control Plan, which would comply with the NPDES permit and employ BMPs during construction to minimize the potential for soil erosion and sediment to enter the stormwater system. SDOT and Contractor Final Design Construction Cumulative No mitigation will be required beyond measures listed for construction period. Not applicable Not applicable Utilities, Energy, and Electromagnetic Fields (EMF) Operations No mitigation required for utilities, energy or EMF. Not applicable Not applicable Construction No mitigation required for energy or EMF. To mitigate risk of disrupting utilities during construction, SDOT will develop a utility relocation plan prior to construction, which will include: Coordination with utility providers to minimize potential disruptions through detailed construction schedules and sequencing. Contingent temporary connections to businesses and residences when more than a short service disruption is anticipated. SDOT and Contractor Construction TBG SEA MARCH 2016 ENVIRONMENTAL ASSESSMENT PAGE 6-14
291 MITIGATION MEASURES Impact Type Mitigation Measure Responsibility Phase of Implementation Cumulative No mitigation will be required beyond measures listed for construction period. Not applicable Not applicable Hazardous Materials Operations Construction SDOT will continue to manage the hazardous material site at the Chinatown- International District OMF expansion site. SDOT will employ BMPs (including implementation of a spill prevention plan and emergency response procedures) to avoid or minimize potential releases of hazardous materials into the environment from accidental spills at the OMF sites. Avoidance or minimization through implementing BMPs (site avoidance, clean-up prior to construction) and development of a spill prevention plan and emergency response procedures to guide the characterization, management, and disposal of contaminated materials, if encountered, will be employed. A Spill Prevention Plan will be developed meeting City standards to control spills on site (Standard specifications A (1)8-01.3(2)C), and a waste management plan will be developed, following City Standard Specification Discoveries of Contaminated Materials, Dangerous Waste(s) and TSCA Waste(s), which includes procedures for identifying and characterizing unanticipated hazardous materials. SDOT SDOT and Contractor Final Design Construction Cumulative No mitigation will be required beyond measures listed for construction period. Not applicable Not applicable Geology and Soils Operations No mitigation will be required Not applicable Not applicable Construction No mitigation is required. Not applicable Not applicable Cumulative No mitigation will be required beyond measures listed for construction period. Not applicable Not applicable Public and Emergency Services Operations Potential operational impacts on public service and emergency service will be mitigated with the following measures: To minimize effects of delay in emergency response, the streetcar exclusive-transit lane will include a mountable curb for emergency vehicles to use or cross over at their discretion. To mitigate for loss of commercial loading zones, SDOT will provide all-day loading zones along the corridor where additional right-of-way is available and on side streets. Additionally, SDOT will allow on- SDOT Final Design TBG SEA MARCH 2016 ENVIRONMENTAL ASSESSMENT PAGE 6-15
292 MITIGATION MEASURES Impact Type Mitigation Measure Responsibility Construction street loading/unloading during early morning or late evening hours (outside of streetcar operating hours), and designate alleys for deliveries or loading zone access. Solid waste removal will be limited to access via alleyways and side streets; where curbside service is the only option, solid waste removal will be limited to hours when the streetcar is not operating and nonoperational hours. To address safety and emergency response coordination with the addition of the Streetcar service, the Seattle Streetcar System Safety Program Plan (Seattle, 2013) will be expanded for the Center City Connector with input from public service providers. It will address procedures relevant to fire and emergency medical services, including a fire/life safety committee; safety, security, and emergency plans; and emergency preparedness (i.e., exercises and drills) to provide a safe environment for passengers, employees, and persons interacting with the streetcar, in addition to adhering to the required City s Disaster Readiness and Responsiveness Plan. To adequately respond to fires on either side of the streetcar track, final design will review whether hydrants may have to be added so that both sides of the roadway are served. Potential construction impacts on public service and emergency service will be mitigated with the following measures: Prior to construction, applicable agencies will review and approve construction activities and traffic control plans. Emergency service providers will be provided with information on lane closures, detour routes, and construction schedules. SDOT will coordinate with SPD and SFD to maintain reliable access for emergency services during construction and to minimize delays in response times from construction activities and detours. Relocation of access for deliveries and pick-up services will be implemented prior to construction. Relocation strategies for access and delivery include using alleyways, allowing early and late delivery periods that avoid construction periods, and making special provisions for nearby loading zones outside of construction areas. SDOT and Contractor Phase of Implementation Construction TBG SEA MARCH 2016 ENVIRONMENTAL ASSESSMENT PAGE 6-16
293 MITIGATION MEASURES Impact Type Mitigation Measure Responsibility Cumulative SDOT will coordinate through a project coordination committee made up of construction project managers and agencies with jurisdiction over the projects to discuss circulation as it relates to emergency service routes and confirm that adequate accessibility can be maintained throughout construction. Parks and Recreational Resources Operations To mitigate locating a TPSS on Westlake Square, SDOT will either select another one of the other five sites analyzed or the TPSS enclosure will be designed to provide a point of interest consistent with Seattle s design plans for the Square. Placement of the TPSS will not inhibit pedestrian circulation on the Square. SDOT, Contractor with other construction managers SDOT Phase of Implementation Construction Final Design Construction No mitigation will be required. Not applicable Not applicable Cumulative No mitigation will be required Not applicable Not applicable Historic, Cultural, and Archaeological Resources/Section 106 Operations Historic Resources No mitigation will be required. Not applicable Not applicable Archaeological Resources No mitigation will be required. Not applicable Not applicable Construction Historic Resources No mitigation will be required. Not applicable Not applicable Archaeological Resources To mitigate the potential for archaeological site discovery during ground disturbance, a draft Archaeological Monitoring and Inadvertent Discovery Plan has been prepared, in consultation with the SHPO. SDOT and FTA will consult with the SHPO, interested Indian tribes, and other interested parties, as appropriate, regarding eligibility for listing in the NRHP, project impacts, necessary mitigation, and other treatment measures. SDOT, FTA, and Contractor Construction TBG SEA MARCH 2016 ENVIRONMENTAL ASSESSMENT PAGE 6-17
294 MITIGATION MEASURES Impact Type Mitigation Measure Responsibility Phase of Implementation Cumulative No mitigation will be required. Not applicable Not applicable Environmental Justice Operations No mitigation will be required. Not applicable Not applicable Construction SDOT will implement the City s requirement of an inclusive outreach and public engagement (IOPE) plan that outlines how the City will continue to provide outreach to traditionally underrepresented populations, including lowincome, minority, homeless, and LEP individuals. Materials, including project notices, will be translated into Chinese, Vietnamese, and Spanish, and distributed at social service agencies and at affordable housing sites and offices throughout downtown. No other mitigation specific to Environmental Justice would be required. SDOT and Contractor Construction Cumulative No mitigation will be required. Not applicable Not applicable TBG SEA MARCH 2016 ENVIRONMENTAL ASSESSMENT PAGE 6-18
295 7 PUBLIC, TRIBAL, AND AGENCY COORDINATION AND INVOLVEMENT Public involvement and participation are integral parts of the transportation planning process. Federal guidelines and procedures have been developed to involve the public throughout the life of a project and are derived from several federal laws and regulations. The major requirements for public involvement and participation come from NEPA 1 and from laws and regulations related to the NEPA process. 2 Involvement of affected tribes and agencies with jurisdiction or expertise is also an essential part of planning and project development. There are several objectives of engaging the public, tribes, and agencies in the planning and environmental review of the Center City Connector streetcar: Incorporate input on the range of reasonable alternatives. Seek input regarding potential issues surrounding the project and related to project effects. Learn how the project might affect the social, economic, and environmental resources in the area. Provide information about the project. 7.1 Overview of Phased Outreach Efforts Public and agency input was sought at several distinct stages of the project: project introduction; development of the range of alternatives; review evaluation of screening measures; development of draft recommendations; and environmental review. Outreach strategies included stakeholder interviews, four public open houses held at several Center City locations, comment cards, online materials and surveys, media events, and briefings with community organizations. Figure 7-1 outlines the phases and timing of key project milestones during which the S engaged in public and agency outreach efforts. The Seattle Center City Connector Transit Study Detailed Evaluation Report, Volume II (included as Appendix B2 of this Environmental Assessment) describes the public engagement process (in Appendix N.8), summarizes the open houses (in Appendix P), and provides the stakeholder outreach interview (in Appendix Q). Together, these activities helped inform the development of alternatives considered and the screening and identification of the LPA (SDOT, 2014). 1 Planning-level requirements come from the Intermodal Surface Transportation Efficiency Act (ISTEA), the Transportation Equity Act (for the 21st Century (TEA-21), and the Safe, Accountable, Flexible, Efficient Transportation Equity Act: A Legacy for Users (SAFETEA-LU). 2 Other regulatory requirements of several laws, such as Section 106 of the National Historic Preservation Act and Section 4(f) of the U.S. Department of Transportation Act, must be completed as part of the NEPA environmental review process. TBG SEA MARCH 2016 ENVIRONMENTAL ASSESSMENT PAGE 7-1
296 PUBLIC, TRIBAL, AND AGENCY COORDINATION AND INVOLVEMENT Figure 7-1 Phased Outreach Milestones Stakeholder Interviews During the initial stages of the project, interviews were conducted with 40 stakeholders over the course of more than two dozen meetings between November 28 and November 30, 2012 (SDOT, 2014 [Appendix Q]). During the development of the LPA and through the early environmental review process, the SDOT held additional meetings with stakeholders to discuss urban design opportunities, construction phasing options, and east-west alignment alternatives. Stakeholders included representatives from local and citywide bodies, such as community councils, chambers of commerce, major institutions, human service and housing organizations, local business leaders, and other cultural and community organizations. Examples of stakeholders included Seattle Chinatown International District Preservation and Development Authority (SCIDpda), Chinatown-International District Business Improvement Area (CIDBIA), Downtown Seattle Association, Seattle Housing Authority, Pike Place Market Preservation and Development Authority (PDA), and Seattle Streetcar Coalition. SDOT also consulted with the Pike Place Market and Pioneer Square Preservation boards, which are made up of citizens who oversee and provide reviews and in some cases, approvals in accordance with processes and criteria established by City ordinance. Findings from stakeholder interviews can be found in Appendix P of the Seattle Center City Connector Transit Study Detailed Evaluation Report, Volume II, available on SDOT s project website: Table 7-1 lists stakeholder meetings and other events held to support the Center City Connector environmental process. TBG SEA MARCH 2016 ENVIRONMENTAL ASSESSMENT PAGE 7-2
297 PUBLIC, TRIBAL, AND AGENCY COORDINATION AND INVOLVEMENT Table 7-1 List of Stakeholder Meetings Date of meeting(s) Representative / Organization Meeting Objective 24 meetings between November 28 and November 30, Stakeholder groups, including: Pike Place Market PDA Seattle Streetcar Coalition Historic South Downtown CIDBIA Alliance for Pioneer Square SCIDpda Interviews to identify project benefits and interest in/support for the project; preference for mode and alignment; potential traffic, pedestrian, and safety conflicts; and potential equity and environmental justice concerns. June 9, 2013 City Council Transportation Council Review of transportation effects and benefits. June 5, 2014 Seattle Design Commission Overview of the project development process and emphasis of urban design issues and opportunities. October 1, 2014 Downtown Transportation Alliance (DTA) Overview of the project development process and emphasis of urban design issues and opportunities October 1, 2014 Pioneer Square Preservation Board Overview of the project development process and emphasis of urban design issues and opportunities. October 17, 2014 Seattle Streetcar Coalition Overview of the project development process and emphasis of urban design issues and opportunities November 12, 2014 Pike Place Market Historical Commission Overview of project development and design considerations. September 16, 2015 Pioneer Square Preservation Board Design updates. October 28, 2015 Pike Place Market Historical Commission Design updates Public Open Houses and Comment Cards Public open houses were held at locations to attract participation from diverse stakeholders. Project staff received feedback through open discussions at the meetings and through comment forms that were completed either in person or online. The open houses listed in Figure 7-1 and Table 7-2 were held at key project milestones to keep the public and other stakeholders involved and to allow them the opportunity see the results of their previous feedback. Input gathered through the public involvement activities informed development of the initial screening alternatives and was considered as a criteria in the evaluation of each of the alternatives in the initial screening, Tier 1, and Tier 2 phases of analysis (see Chapter 3, Alternatives). A summary of these open houses is provided in Appendix P of the Seattle Center City Connector Transit Study Detailed Evaluation Report, Volume II (SDOT, 2014). TBG SEA MARCH 2016 ENVIRONMENTAL ASSESSMENT PAGE 7-3
298 PUBLIC, TRIBAL, AND AGENCY COORDINATION AND INVOLVEMENT Table 7-2 List of Open Houses Date of meeting(s) Meeting Forum Public Meeting Objective February 6, 2013 City Hall Project development; opportunity to provide input on range of alternatives. June 6, 2013 South Lake Union Discovery Center Project development; opportunity to provide input on initial screening of alternatives October 29, 2013 Pike Place Market Project development; opportunity to provide input on second screening of alternatives. November, 19, 2014 Pike Place Market Project development; opportunity to provide input on second screening of alternatives. September 29 and 30, 2015 Bertha Knight Landis Room, Seattle City Hall Online Materials and Surveys Project update, design refinements; preliminary environmental impacts; opportunity to comment. SDOT created a web page dedicated to the Center City Connector and posted project development progress materials and schedule updates. Items available included public meeting materials and current reports showing study results. As part of the alternatives analysis, surveys were posted to provide interested members of the public the opportunity to have input on the alternatives development and screening criteria. The environmental document and supporting study materials will also be available on the website ( Targeted Outreach SDOT provided targeted public outreach for residents, business owners, property owners, and interest groups with a stake in transportation in the Center City and South Lake Union areas. Outreach included: Briefings to: o Neighborhood and community organizations, including the Belltown Community Council, West Edge Neighborhood Association, Denny Triangle Neighborhood Association, Pioneer Square Community Council, Commute Seattle, and the Downtown Residents Council; o Business organizations, including the Seattle Metropolitan Chamber of Commerce, Downtown Seattle Association, Waterfront Merchants Association, Seattle Art Museum and Alliance for Pioneer Square Door-to-door outreach along the alignment within a block of the project to distribute the project folio and open house invitation, and confirming contact information: o Large and small businesses, particularly in those areas that would be affected by a reduction in street parking o Residential property owners and building management on the corridor, including the Four Seasons, 98 Union, Madison Tower, the Watermark, and Merrill Place Part of the targeted outreach was directed at engaging minority and low-income populations. Open house invitations were translated into Chinese, Vietnamese, and Spanish, and distribution TBG SEA MARCH 2016 ENVIRONMENTAL ASSESSMENT PAGE 7-4
299 PUBLIC, TRIBAL, AND AGENCY COORDINATION AND INVOLVEMENT of these materials included in-person drop-offs at social service agencies and at affordable housing sites and offices throughout downtown. SDOT dropped off information materials to social services providers, low-income housing providers, and homeless shelters, including the Union Gospel Mission, Pike Place Market Foundation, Plymouth Housing, Bread of Life Mission, Yesler Community Center, Plymouth Housing Group Rental Office, the Josephinum, Women s Wellness Center, Plymouth on Stewart, Yesler Terrace Apartments, Gatewood Hotel, Sanitary Market, Livingston Baker, Bell Tower Apartments, Hotel Scargo, Kasota, Oxford Apartments, Market House Condominium, Pike Market Senior Center, and Lewiston Apartments. In addition, SDOT is working with Operation Sack Lunch to make and deliver lunches for the homeless population near the construction zone and future streetcar route. Information sheets will be stapled to the lunch bags letting recipients know that construction is coming, how to get their belongings if left in the work zone, and information about resources and shelters in the area. SDOT will engage local news channels, the Seattle Times, Puget Sound Business Journal, Crosscut, Publicola, and Seattle Transit Blog, as well as other publications that serve low-income and/or homeless populations, such as Real Change. SDOT will include media that addresses minority communities within the study area. 7.2 Agency Coordination Prior to project initiation, the SDOT, as the local project sponsor, began to coordinate with federal, regional, and local agencies on the Center City Connector Project. Discussions were held on project timing, location, and operational parameters, as well as on proposed development and zoning in the study area. As part of the environmental process, the SDOT and FTA invited affected agencies and other agencies with jurisdiction and experience to review and comment on the environmental analyses. The following sections outline the roles and engagement activities of federal agencies, Native American tribes, and state and regional agencies Federal Agencies and Native American Tribes FTA is the federal lead for this project, with responsibility for compliance with consultation requirements under NEPA, Section 106 of the NHPA, and the federal Endangered Species Act regulations. In addition, FTA holds government-to-government responsibility for coordinating with affected Native American tribes. The study area does not include tribal lands, but the tribes may have interests regarding natural and cultural resources. FTA initiated consultation with the tribes listed below, contacting them by letter, in telephone conversations, and, if needed, at inperson meetings: Muckleshoot Indian Tribe Snoqualmie Tribe Stillaguamish Tribe Tulalip Tribes Confederated Tribes and Bands of the Yakama Nation Duwamish Tribe (not federally recognized) TBG SEA MARCH 2016 ENVIRONMENTAL ASSESSMENT PAGE 7-5
300 PUBLIC, TRIBAL, AND AGENCY COORDINATION AND INVOLVEMENT FTA has continued to consult with the tribes regarding potential cultural resource impacts of concern to the tribes throughout project development. Under Section 106, FTA is required to involve the State Historic Preservation Officer (SHPO) and the tribal preservation officers for Native American tribes in a process to identify historic properties and cultural resources potentially affected by the project. Additionally, FTA consulted with the U.S. Department of the Interior/National Park Service (NPS) because the Klondike Gold Rush National Historical Park and the Pioneer Square National Historic Landmark are located in the study area. The NPS concurred with conclusions in the EA on October 1, This process is discussed in more detail in the Appendix H14, City Center Connector Cultural Resources Technical Report, and summarized in Section 4.15, Historic, Cultural, and Archaeological Resource/Section Regional, State, and Local Agencies FTA has delegated most technical coordination work to the City of Seattle but has participated in meetings to provide strategic support and confirm interagency agreements, as appropriate. On transportation issues, the City of Seattle works closely with WSDOT, King County Metro, Community Transit, Washington State Ferries (WSF, a department of the Washington State Department of Transportation) and Sound Transit to collaborate on strategies for minimizing the construction-induced transit delays, to establish coordination in support of transit operation, and to maximize efficiency for downtown Seattle streets. In addition to these agencies, the Port of Seattle was provided an opportunity to review the EA technical reports on transportation and cumulative impacts that served as the basis of the EA. For issues concerning Seattle historic landmarks and local Chinatown/International, local Pioneer Square, and local Pike Place Market historical districts, the City has worked closely with Seattle s historic preservation boards and the City s Historic Preservation Officer. These efforts included providing periodic updates on development of project alternatives and seeking input on the urban design elements to meet historical district design guidelines. Prior to construction, SDOT will apply for project design approval from the historic district preservation board. SDOT has also consulted with the City s Office of Historic Preservation. Preservation staff have reviewed and concurred with findings in the cultural resources sections of the EA. As mentioned in Section 7.2.1, Federal Agencies and Native American Tribes, per federal Section 106 regulations, FTA consulted the SHPO regarding the significance of the resources and the nature and magnitude of the potential impacts. SHPO concurred with the Area of Potential Effect on December 3, 2014, and the determination of No Adverse Effects on October 27, TBG SEA MARCH 2016 ENVIRONMENTAL ASSESSMENT PAGE 7-6
301 Cover image from SDOT
 684-ROAD (7623) www.seattle.")
302 The Seattle Department of Transportation th Avenue, Suite 3800 PO Box Seattle, WA (206) 684-ROAD (7623)