Data, tables, statistics and maps ENERGY IN DENMARK
|
|
|
- Hortense Hunter
- 5 years ago
- Views:
Transcription

1 Data, tables, statistics and maps ENERGY IN DENMARK 216
2 Energy in Denmark, 216 Contents General information on Denmark 3 Energy production 4 Imports and exports of energy 8 Electricity and heat 9 Danish energy flows Renewable energy 14 Energy consumption 16 Emissions 19 Energy economy and prices 2 International comparisons 22 Danish key figures 23 Design Danish Energy Agency Edition Internet Printing Quotations may be made from this publication with appropriate acknowledgement of source. Internet Available at Sources Danish Energy Agency Energy statistics 216 Statistics Denmark Danish Meteorological Institute Danmarks Nationalbank Danish Energy Agency Danish Ministry of Energy, Utilities and Climate Phone: E mail: statistik@ens.dk July 218 2
3 GENERAL INFORMATION ON DENMARK Aalborg 1 1 Aarhus Esbjerg Copenhagen Odense Geography (217) Area, km 2 Coastline, km Number of islands Forest area, % Climate (216) Average temperature: January July Sunshine, hours Precipitation, mm Population (217) Population (Jan. 217) By age: -19 years, % 2-59 years, % 6- years, % Population density, per km C 16.4 C Currency (216) 1 Krone (DKK) 1 USD 1 EURO 1 GBP Economics (216) GDP, billion DKK Exports, billion DKK Imports, billion DKK = = = = 1 øre 6.73 DKK 7.45 DKK 9.11 DKK Constitution and Government (217) Denmark is a constitutional monarchy Monarch is Queen Margrethe II The present government consists of: Venstre - The Liberal Party of Denmark The Conservative Party Liberal Alliance Labour Market (216) Labour force, Employed, Employed in industry, % Employed in agriculture and fishing, % Employed in commercial and public services, % Note: Adjusted means adjusted for climate and fuels for net electricity exports 3
. Seven fields are situated in the northern part of the Central Graben, while all the other fields are situated in the southern region of the Central Graben.")
4 ENERGY PRODUCTION Danish oil and gas fields and pipelines North Sea Pipeline: Gas Pipeline: Crude oil Oil and gas fields In 216, there were nineteen oil and gas fields of varying size (fifteen oil and four gas fields). Seven fields are situated in the northern part of the Central Graben, while all the other fields are situated in the southern region of the Central Graben. Denmark is the third largest oil producer in Western Europe trailing only UK and Norway. Energy production [PJ] Total production Crude oil Natural gas Waste, non-renewable Renewable energy Oil and gas reserves and resources (Ultimo) Crude Oil, Million m3 Natural Gas, Billion Nm3 4
5 ENERGY PRODUCTION Energy production and energy consumption PJ 14 Degree of self-sufficiency 25% 12 2% % 6 1% 4 2 5% 199 '95 ' '5 '1 '16 Renewable energy etc. Natural gas Crude oil Gross energy consumption (adjusted) % 199 '95 ' '5 '1 '16 Total energy Oil Natural gas Renewable energy production by type PJ Consumption of renewable energy share of total energy consumption 3% 25% 2% % 1% 4 2 5% Wind Straw Wood Biogas Waste, renewable Others % 199 '95 ' '5 '1 '16 Share covered by net imports Share covered by indigeneous production 5
6 ENERGY PRODUCTION 6
7 7 ENERGY PRODUCTION
8 IMPORTS AND EXPORTS OF ENERGY Imports and exports of energy products, 216 Imports Exports Crude oil [1 tonnes] Oil products [1 tonnes] Natural gas [million Nm 3 ] Coal [1 tonnes] Electricity [GWh] Imports of coal and exports of crude oil by country, 216 Imports of coal Exports of crude oil South Africa 6% Poland Norway 5% 6% Other 4% Colombia 14% UK 7% Other 2% Finland 7% Netherlands 9% Germany 4% Russia 64% Sweden 71% Net exports of electricity PJ '95 ' '5 '1 '16 In Denmark, the foreign trade in electricity varies more than in any other European country. Foreign trade is strongly affected by price trends at the Nordic Electricity Exchange, Nord Pool, which is significantly influenced by the varying precipitation conditions in Norway and Sweden where electricity generation is dominated by water power. In 216, the Danish net imports of electricity totalled 18.2 PJ. It was the result of net imports of 18.2 PJ from Norway and 7.8 PJ net imports from Germany, whilst the net export to Sweden was 7.8 PJ. Total Germany Norway Sweden 8
9 ELECTRICITY AND HEAT Number of wind turbines by size Onshore Onshore Offshore Onshore Offshore Total turbines turbines turbines turbines turbines Total Total kw kw kw kw Total capacity of wind turbines by size [MW] Onshore Onshore Offshore Onshore Offshore Total turbines turbines turbines turbines turbines Total Total kw kw kw kw Number of wind turbines and size of capacity Number 7 MW 7 Production of wind power PJ '9 '95 ' '5 '1 ' '95 ' '5 '1 '16 Number of wind turbines Production of wind power Capacity of wind turbines 9
10 ELECTRICITY AND HEAT Electricity production by fuel [PJ] Total gross production Oil Natural gas Coal Wind Other Electricity capacity (ultimo) [MW] Total electricity capacity Large-scale units Small-scale units Autoproducers Wind Solar Hydro Electricity production by type PJ % Electricity generated by renewables: Share of domestic electricity supply '95 ' '5 '1 '16 CHP Other Wind power 1994 ' '5 '1 '16 Wind power Wood, straw, biogas etc. Waste, renewable 1
11 ELECTRICITY AND HEAT District heating by fuel [PJ] Total gross production Oil Natural gas Coal Surplus heat Waste, non-renewable Renewable energy of which: - Straw Wood Biofuels 2 - Waste, renewable Biogas Other 2 District heating production by type of producer PJ CHP shares of electricity and district heat production 9% 8% 7% 6% 5% 4% 3% 2% 1 1% Large-scale CHP units Small-scale CHP units Autoproducers District heating units % 199 '95 ' '5 '1 '16 District heating Electricity, shares of thermal production 11
12 DANISH ENERGY FLOWS 12
13 13 DANISH ENERGY FLOWS
14 RENEWABLE ENERGY 14

15 15 RENEWABLE ENERGY
16 ENERGY CONSUMPTION Gross energy consumption by fuel Adjusted [PJ] Total gross energy consumption Oil Natural gas Coal and coke Waste, non-renewable Renewable energy Final energy consumption by sector Climate adjusted [PJ] Total final energy consumption Non-energy use Transport Industry and agriculture Commerce and public services Households Gross energy consumption and final energy consumption (Adjusted) PJ Index 199=1 1 GDP, gross energy consumption and energy intensity (Adjusted) '95 ' '5 '1 '16 Transformation and distribution losses Energy sector Final energy consumption '95 ' '5 '1 '16 GDP Gross energy consumption Gross energy consumption/gdp 16
17 ENERGY CONSUMPTION Final energy consumption by fuel (Climate adjusted) PJ 8 Final energy consumption by sector (Climate adjusted) PJ '95 ' '5 '1 '16 Oil Natural gas Coal and coke Renewable energy etc. Electricity District heating Gas works gas Households Commerce and public services Industry and agriculture Transport Non-energy use Final energy consumption (Climate adjusted) PJ 25 Electricity consumption (Climate adjusted) PJ '95 ' '5 '1 '16 Road transport Manufacturing Commerce and public services Households '95 ' '5 '1 '16 Manufacturing Commerce and public services Households 17
18 ENERGY CONSUMPTION Energy consumption for space heating in households (Climate adjusted) Index 199=1 13 Heating installations in households 1 Units '95 ' '5 '1 '16 Heated floor space Final energy consumption Final energy consumption per m Oil Natural gas District Heating Others Energy intensities (Climate adjusted) TJ per DKK million gross value added (21-prices) 1, Shares of renewable energy in final energy consumption (Climate adjusted) 3%,9,8,7,6,5 25% 2% 15%,4,3,2,1, 199 '95 ' '5 '1 '16 Manufacturing Commerce and public services 1% 5% % 199 '95 ' '5 '1 '16 Manufacturing Commerce and public services Households 18
19 EMISSIONS CO 2 emissions from energy consumption [Million tonnes] Observed CO 2 emissions Energy sector Transformation sector Final energy consumption Adjusted CO 2 emissions Energy sector Transformation sector Final energy consumption Total emissions from greenhouse gases 9 CO 2 emissions per fuel unit and per kwh of electricity (Adjusted) Million tonnes CO 2 equivalent Kilogram per GJ Gram per kwh * Observed Adjusted '95 ' '5 '1 '16 CO2 emissions per fuel unit [kilogram per GJ] CO2 emissions per kwh electricity sold [gram per kwh] *) Preliminary emission inventory 19
20 ENERGY ECONOMY AND PRICES Energy expenses by industry and households Billion DKK, current prices Index 199= '9 '95 ' '5 '1 '15 Commerce and public services Industry and agriculture Energy supply Households Source: Statistics Denmark GDP index (right axis) Economic key figures [Billion DKK, current prices] Total energy expenditures 13.2 Revenues from energy, CO 2 and sulphur taxation Expenditures to public service obligations on electricity Value of crude oil and natural gas production 24.8 Exports of energy technology and equipment Billion DKK, current prices Exports of energy technology and equipment, Billion DKK Share of Denmark's total exports of commodities, % 16% 14% 12% 1% 8% 6% 4% 2% % 2
 21")
21 ENERGY ECONOMY AND PRICES Electricity prices for industrial consumers (Annual consumption 2-2 GWh) DKK per kwh 1,6 1,4 1,2 1,,8,6,4,2, Source: Eurostat Energy prices for households, 216 DKK Euro Gasoline regular [per litre] Heating gas oil [per litre] Natural gas [per Nm 3 ] Electricity [per kwh] Decomposition of the electricity price for households, 216 (%) 21
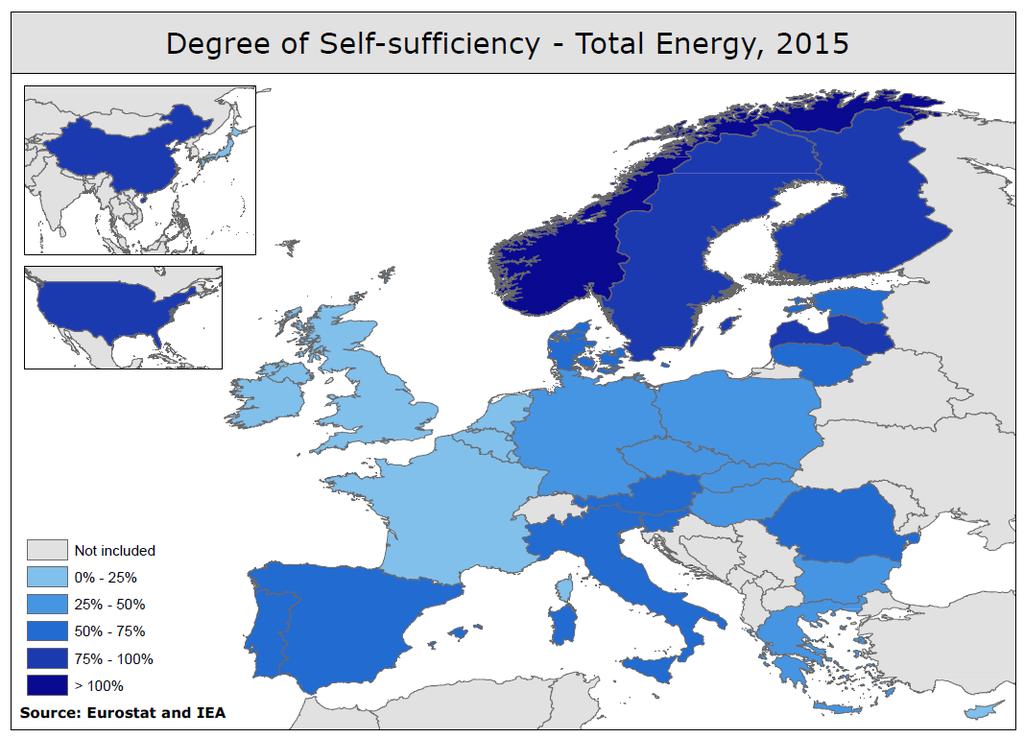
22 INTERNATIONAL COMPARISONS 215 Degree of selfsufficiency [%] Renewable energy and waste: Share of gross energy consumption [%] Gross energy consumption per capita [GJ] Energy intensity [TOE per million EUR GDP (21 prices)] Denmark Estonia Romania Sweden Poland Czech Republic Bulgaria UK Netherlands France Latvia Finland Slovenia Croatia EU Hungary Slovakia Germany Austria Greece Spain Italy Portugal Lithuania Belgium Ireland Cyprus Luxembourg Malta Norway USA Japan Source: Eurostat and IEA. 22
23 DANISH KEY FIGURES Gross energy consumption per capita [GJ] Final energy consumption per capita [GJ] Energy intensity, gross energy consumption [TJ per million GDP] Energy intensity, final energy consumption [TJ per million GDP] Degree of self-sufficiency [%] Dependency of oil [%] Renewable energy: Share of gross energy consumption [%] Refinery capacity [million tonnes per year] Electricity capacity [MW] Wind turbine capacity: Share of total electricity capacity [%] Net electricity exports: Share of domestic supply [%] CHP production: Share of thermal electricity production [%] CHP production: Share of district heating production [%] Renewable energy: Share of total domestic electricity supply [%] CO 2 emissions per capita [tonnes] CO 2 emissions per kwh sold [gram per kwh] CO 2 emissions per consumed unit of district heating [kilogram per GJ] CO 2 emissions per GDP [kilogram per DKK] Note: Data on energy consumption and CO 2 emissions are adjusted
24 Do you need more data? Energy Statistics 216 Publication as.pdf Figures in Powerpoint Time series and tables Danish energy flows Data Oil and gas production in Denmark Monthly energy statistics Wind turbine data Maps Key maps showing aspects of the Danish energy sector Danish Energy Agency Amaliegade 44 DK København K Tlf ens@ens.dk CVR-nr: