LSPC Watershed Modeling
|
|
|
- Christal Ellis
- 5 years ago
- Views:
Transcription

1 LSPC Watershed Modeling A Case Study of the North Saskatchewan River Watershed John Riverson February 21, 212 Kalispell, MT
2 Presentation Outline Background and Objectives LSPC Model Overview Constraining Uncertainty ( top down approach) Calibration Sequence: Snow Hydrology Water Quality Results Interpretation Lessons Learned 2
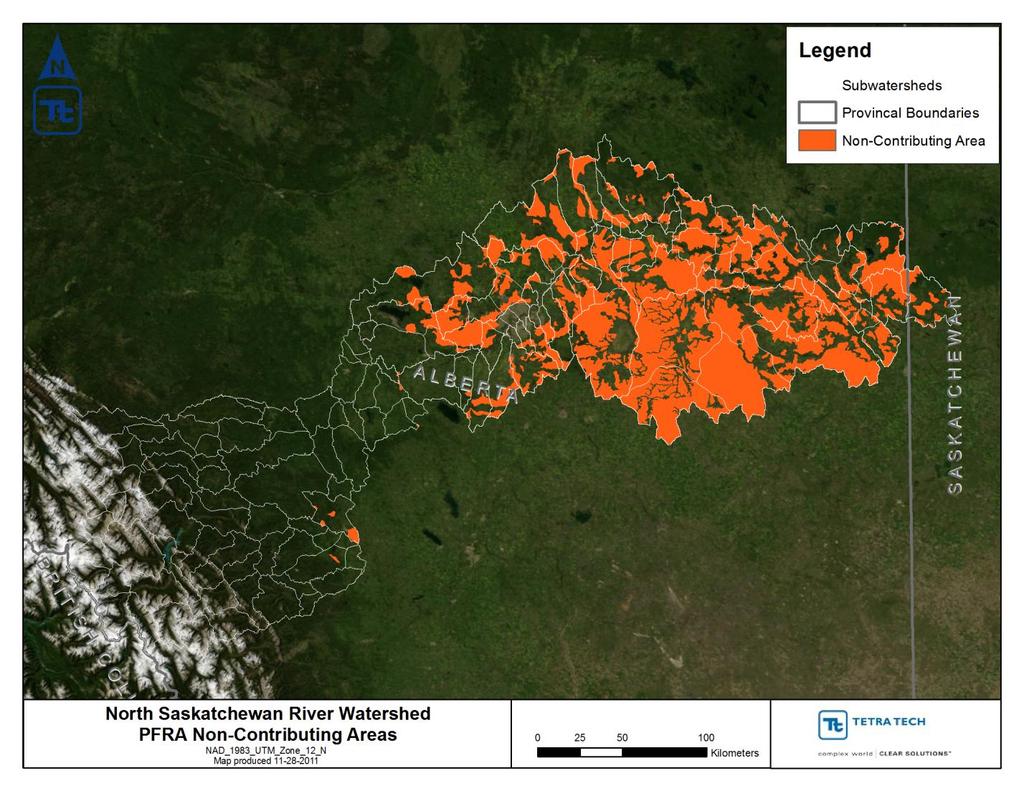
3 NSR Watershed Previous Modelling Activities EFDC mainstem model and two lakes LSPC watershed model calibrated for mountain regions 3
4 Management Objectives Model hydrology Simulate surface water quality Represent effects of drivers such as: Land use change Alternative reservoir operating scenarios 4
5 Loading Simulation Program in C++ (LSPC) Streamlined Hydrologic Simulation Program Fortran (HSPF) Snow, flow, temperature, quality (SEDMNT/GQUAL/RQUAL) Coded in a Visual C++ object-oriented environment No limit on model operations Relational database for organizing, archiving, and retrieving watershed data Potential for very large-scale modelling (Provincial scale) Streamlined model input and output formats Tailored for TMDL development Handles point and nonpoint sources Convenient platform for administrative record keeping 5
: Hydrology Sediment yield Pollutant load")
6 LSPC Model Structure Land use (physical attributes): Average slope Average length of overland flow Model Parameters Unique by Subwatershed: Land use distribution Average elevation Weather data assignment Representative reach segment Land use (physical processes): Hydrology Sediment yield Pollutant load generation

7 7 Watershed Elevation
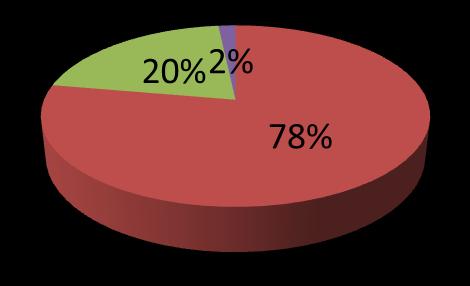
8 Average Subwatershed Elevatation (m) Evergreen Forest 79% Barren 7% Grassland 5% 1,6 m Barren Water Bedrock Developed Shrubland Wetland Herbaceous Cropland Grassland Pasture Evergreen Forest Deciduous Forest Non-Contributing Elevation: >1,6 m Parameter Group 1 Parameter Group 2 Parameter Group 33 Break Points 3, 2,5 2, 1,5 8 m 1, Cumulative Subwatershed Area (1, km 2 )


9 Average Subwatershed Elevatation (m) Deciduous Forest 12% Evergreen Forest 57% Wetland 7% Herbaceous 7% 1,6 m Pasture 11% Barren Water Bedrock Developed Shrubland Wetland Herbaceous Cropland Grassland Pasture Evergreen Forest Deciduous Forest Non-Contributing Elevation: 8-1,6 m Parameter Group 1 Parameter Group 22 Parameter Group 3 Break Points 3, 2,5 2, 1,5 8 m 1, Cumulative Subwatershed Area (1, km 2 )

10 Average Subwatershed Elevatation (m) Non- Contributing 4% Deciduous Forest 8% 1,6 m Cropland 2% Pasture 21% Barren Water Bedrock Developed Shrubland Wetland Herbaceous Cropland Grassland Pasture Evergreen Forest Deciduous Forest Non-Contributing Elevation: < 8 m Parameter Group 11 Parameter Group 2 Parameter Group 3 Break Points 3, 2,5 2, 1,5 8 m 1, Cumulative Subwatershed Area (1, km 2 )
11 11
12 Model Calibration Potential Sources of Uncertainty: Physical representation of the system Meteorological forcing functions Point source inputs and/or withdrawals Snow pack accumulation and melting Overland flow (DCIA, surface abstractions) Subsurface influences (sources and sinks) Instream flow dynamics (ice impacts, channel geometry) Pollutant generation/transport mechanisms More Certain Less Certain Calibration Parameter Focus: Processes Order Matters 12


13 Snow Calibration: Test the model at various locations and elevations: volume/timing of snow accumulation and melting. Land Hydrology: Identify influential land use features and factors. Define parameter groups. Check base flow, runoff, seasonal. Snow Telemetry Data Focus: Upstream Flow Gages 13
 4.")
14 Stream Transport: Include special hydraulic features of stream routing network (i.e. point sources, reservoirs, diversions). Water Quality: 1. Water Temperature 2. Sediment 3. Nutrients (associated) 4. Bacteria and metals Focus: Downstream Flow Gages Instream Monitoring Gages 14
15 Precipitation Potential ET Temperature Wind speed Solar radiation Dew point Cloud cover Refined Meteorological Representation Data source (table legend): Data were available - Data not available Partially available CDCD CWEEDS * - - Climate Data Online Calculated Values * Hourly intensity index was available for precipitation. These were used to disaggregate nearby daily data to hourly

16 16 Stations Reviewed

17 17 Stations Selected for Use
18 Gage Elevation (m) Average Annualized Precipitation (cm/year) Meteorological Data Quality: Precipitation Gage Elevation (m) Missing or Extended Precipitation Estimate Recorded Precipitation (1/1/1988-9/3/21) 3, 2,8 2,6 2,4 2,2 The selected stations are highlighted in Red/Orange for recorded/repaired , 1,8 1,6 1,4 1,2 1,

19 19 Meteorological Data Quality
 C31815: Measured Total Precipitation (cm/year) 1 9 8 P A 1 n n i 1 N N A i P i 1% 9% 8% 7 7% 6 6% 5 5% 4 4% 3 2 1 BRETON Gage (C31815) 3% 2% 1% % 2")
20 Total Precipitation (cm/year) Missing (solid) / Estimated (hashed) Data Quality Control: Normal Ratio Method C31815: Processed Total Precipitation (cm/year) C31815: Measured Total Precipitation (cm/year) P A 1 n n i 1 N N A i P i 1% 9% 8% 7 7% 6 6% 5 5% 4 4% BRETON Gage (C31815) 3% 2% 1% % 2 Missing data estimated using nearby gages
21 1/1/2 2/1/21 6/1/21 1/1/21 2/1/22 6/1/22 1/1/22 2/1/23 6/1/23 1/1/23 2/1/24 6/1/24 1/1/24 2/1/25 6/1/25 1/1/25 2/1/26 6/1/26 1/1/26 2/1/27 6/1/27 1/1/27 2/1/28 6/1/28 1/1/28 2/1/29 6/1/29 1/1/29 2/1/21 6/1/21 Temperature (Deg C) Percent Missing Data Quality Control: Temperature C31228: Measured Minimum Daily Temp (Deg C) C31228: Measured Maximum Daily Temp (Deg C) C31228: Processed Minimum Daily Temp (Deg C) C31228: Processed Maximum Daily Temp (Deg C) 1% 9% 8% 7% 6% 5% 4% 3% 2% Edmonton City Centre (C31228) 1% % Min/max temperature disaggregated to hourly 21

22 22 Weather Station Assignments
23 Total Snow Pack Snow: Evaporation from Snow Pack Precipitation Snow or Rain Atmospheric Conditions Snow Ice Liquid Ground 23
24 O-2 D-2 F-3 A-3 J-3 A-3 Volume (cm) Snowpack Water Depth (cm) O-2 D-2 F-3 A-3 J-3 A-3 Volume (cm) Temperature (Deg C) Rainfall (cm) Snowfall Water-Equivalent (cm) Air Temp (Deg C) Snowfall Temp (Deg C) SNOTEL Temperature (Deg C) Modeled Snowpack as Water (cm) Snowfall as Water (cm) Snowmelt (cm) 3. Water Yield From Snow Pack (cm) Observed Snowpack (cm) LSPC snow calibration at Edmonton City Centre (1/1/22 to 9/3/23)
25 O-98 D-98 F-99 A-99 J-99 A-99 O-99 D-99 F- A- J- A- O- D- F-1 A-1 J-1 A-1 O-1 D-1 F-2 A-2 J-2 A-2 O-2 D-2 F-3 A-3 J-3 A-3 O-3 D-3 F-4 A-4 J-4 A-4 O-4 D-4 F-5 A-5 J-5 A-5 O-5 D-5 F-6 A-6 J-6 A-6 Volume (cm) Snowpack Water Depth (cm) O-98 D-98 F-99 A-99 J-99 A-99 O-99 D-99 F- A- J- A- O- D- F-1 A-1 J-1 A-1 O-1 D-1 F-2 A-2 J-2 A-2 O-2 D-2 F-3 A-3 J-3 A-3 O-3 D-3 F-4 A-4 J-4 A-4 O-4 D-4 F-5 A-5 J-5 A-5 O-5 D-5 F-6 A-6 J-6 A-6 Volume (cm) Temperature (Deg C) Rainfall (cm) Snowfall Water-Equivalent (cm) Air Temp (Deg C) Snowfall Temp (Deg C) SNOTEL Temperature (Deg C) Modeled Snowpack as Water (cm) Snowfall as Water (cm) Snowmelt (cm) 3. Water Yield From Snow Pack (cm) Observed Snowpack (cm) LSPC snow calibration at Edmonton Woodbend (1/1/1998 to 9/3/26)
 Line of Equal Value Best-Fit Line y =.9466x + 2.46 R 2 =.")
26 Flow (cms) Precipitation (cm) Average Modelled Flow (cms) Flow (cms) Precipitation (cm) Ram River Gage (5DC6) Streamflow Observed vs. Modelled 6 Avg Flow (1/1/1999 to 9/3/28) Line of Equal Value Best-Fit Line y =.9466x R 2 = Avg Precipitation (cm) Avg Observed Flow (1/1/1999 to 9/3/28) Avg Modelled Flow (Same Period) O N D J F M A M J J A S seasonal / monthly flow Average Observed Flow (cms) Month Average Precipitation (cm) Observed (25th, 75th) Observed Median Modelled (Median, 25th, 75th) O N D J F M A M J J A S 2 quartile variation Month 12
27 27 Error Statistics: Ram River (LSPC) Hydrologic Indicator Observed (cm/year) Simulated (cm/year) Error Statistics Error (%) Goal (%) Total In-stream Flow: ±1 Total of lowest 5% flows: ±1 Total of highest 1% flows: ±15 Summer (months 7-9): ±3 Fall (months 1-12): ±3 Winter (months 1-3): ±3 Spring (months 4-6): ±3 Total Storm Volume: ±2 Summer Storm Volume (7-9): ±5 Nash-Sutcliffe Coefficient of Efficiency, E:.54 Model accuracy increases Baseline adjusted coefficient (Garrick), E':.44 as E or E' approaches 1. Metrics: HSPEXP, Nash-Sutcliffe, Garrick
 9 8 2 7 4 6 6 5 8 4 1 3 12 2 14 1 16 18 Jan Feb Mar Apr May Jun Jul Aug Sep Oct Nov Dec Avg Precipitation (cm) Avg Observed Flow (1/1/23 to 12/31/23 ) Avg Modelled Flow")
 Avg Observed Flow (1/1/21 to 12/31/21 ) Avg Modelled Flow (Same Period) 9 8 2 7 4 6 6 5 8 4 1 3 12 2 14 1 28 Jan Feb Mar Apr May Jun Jul Aug Sep Oct Nov Dec 16")
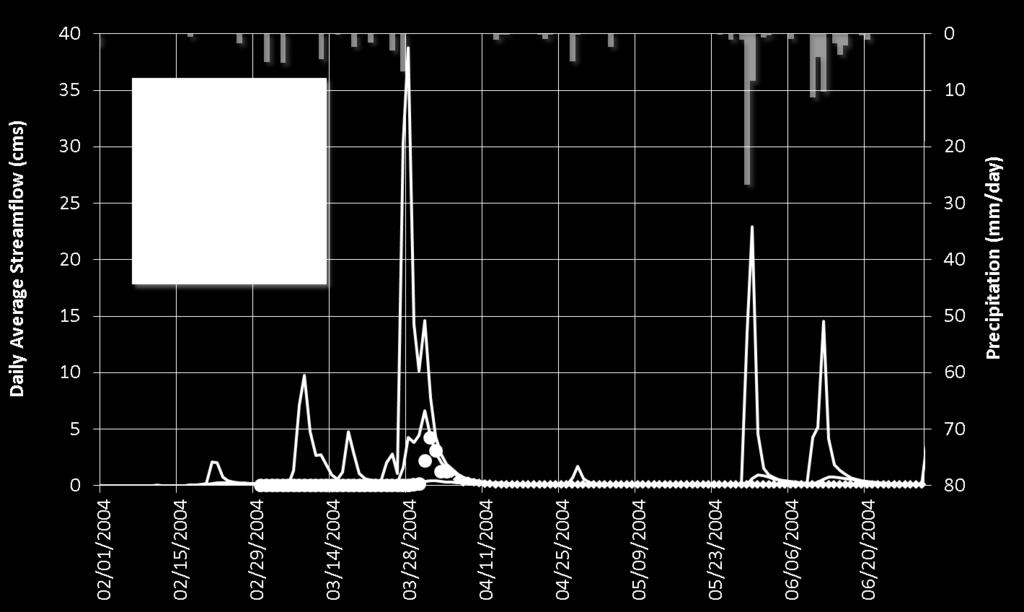
28 Flow (cms) Precipitation (cm) Flow (cms) Precipitation (cm) Flow (cms) Precipitation (cm) Avg Precipitation (cm) Avg Observed Flow (1/1/25 to 12/31/25 ) Avg Modelled Flow (Same Period) Jan Feb Mar Apr May Jun Jul Aug Sep Oct Nov Dec Avg Precipitation (cm) Avg Observed Flow (1/1/23 to 12/31/23 ) Avg Modelled Flow (Same Period) Jan Feb Mar Apr May Jun Jul Aug Sep Oct Nov Dec Wet Year, 25 Daily flow validation at Ram River Gage Average Year, 23 Avg Precipitation (cm) Avg Observed Flow (1/1/21 to 12/31/21 ) Avg Modelled Flow (Same Period) Jan Feb Mar Apr May Jun Jul Aug Sep Oct Nov Dec Dry Year, 21
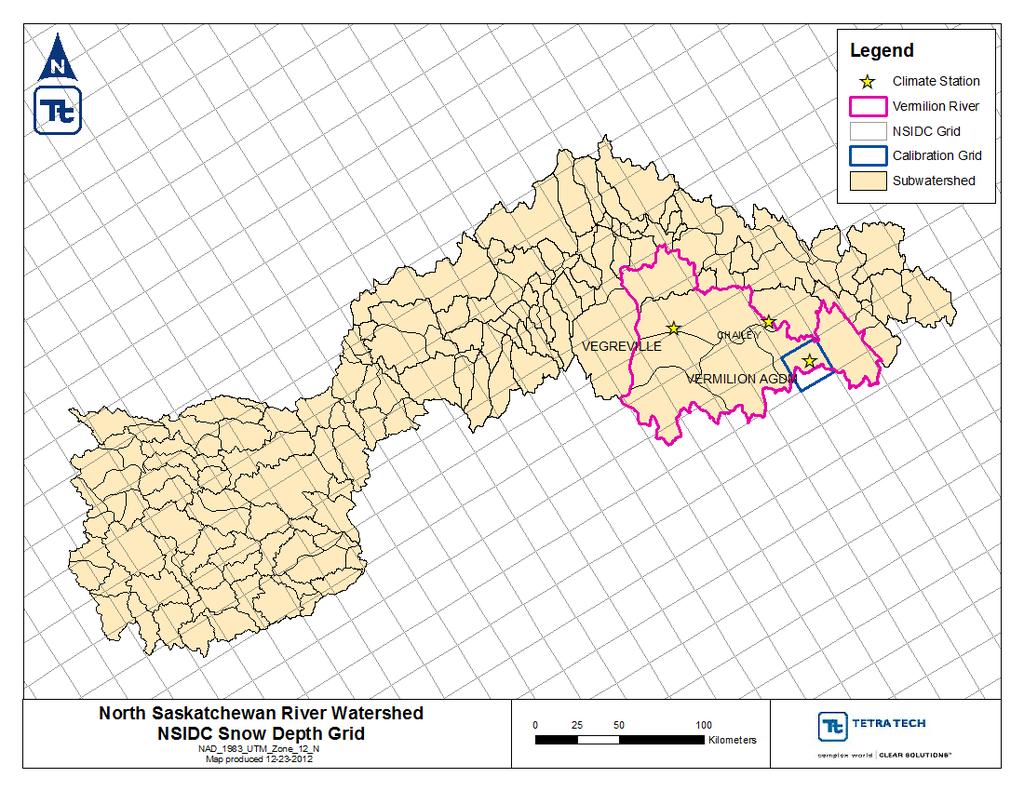
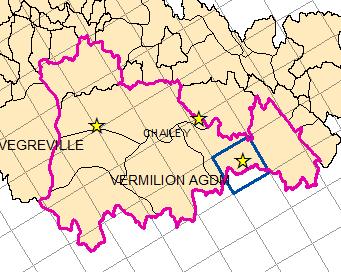
29 29 Vermillion River Watershed
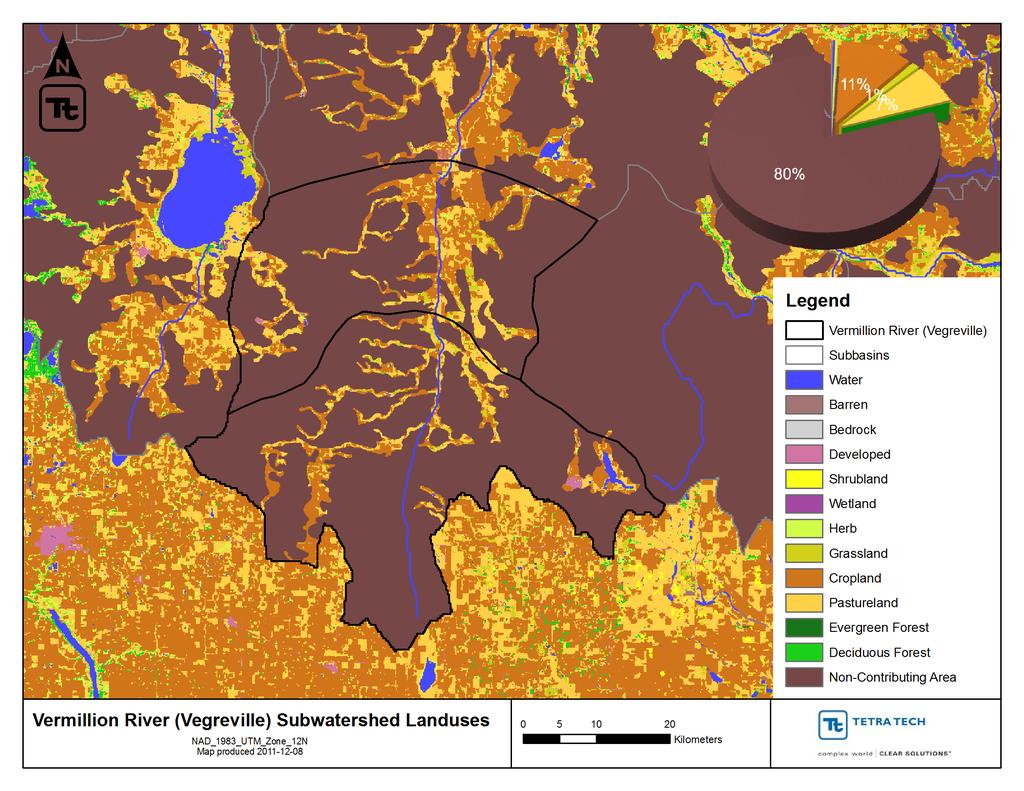
30 3
31 Sensitivity Analysis: Parameter Ranges HSPF Parameter Units Initial Value Low Value High Value Sensitivity FZG 1/mm , High FZGL fraction High LZSN mm Medium UZSN mm Medium INFILT mm/hr High CEPSC mm Low SLSUR m/m.5..5 Low LSUR m Low 31 DEEPFR fraction High


32 Synthesis Range that tends to match observed spring snowmelt Using default parameter values Isolated NCA component of model response Summer issues remain 32

33 33 NCA Water Budget
34 Water Quality Calibration 34 Land simulation: Sediment, Total Nitrogen, Total Phosphorus, BOD, bacteria Instream fate and transport Sediment transport Nutrient transformations, BOD/DO, algae interactions Bacteria die-off Top down approach: natural anthropogenic Calibration considerations Water quality data assessment Literature review of export coefficients and EMC s recorded for locations in the watershed

35 35 28 Synoptic Monitoring Dataset

36 36 28 Synoptic Monitoring Dataset

37 37 LSPC Sediment Model
38 TSS (kg/ha/year) Land Model Calibration: Sediment Export 1 25th to 75th Percentile Min/Median/Max Literature Values Forest Pasture Cropland Urban NCA
39 Sediment over Space and Time Loading (selected points) Average loading (at the mouth) Net deposition/resuspension 39
40 Sediment over Space and Time Loading (selected points) Average loading (at the mouth) Net deposition/resuspension 4
 Net")
41 Sediment over Space and Time Loading (selected points) Average loading (at the mouth) Net deposition/resuspension 41
 42 14 12 1 8 6 4 2 8/14/1994 7/7/28 37")
42 Number of Samples 1. Source Characterization/Data Analysis 16 Flow Distribution for Strawberry Creek (AB5DF2) /14/1994 7/7/28 37 samples taken March October Observed Flow Exceedence at Strawberry Creek (5DF4)
43 Flow-Weighted Concentration Flow (cms) 1 a. Flow Relationship Total Dissolved Phosphorous (mg/l) 5DF4 (cms) (Min, Mean, Max) Percentile Ranges for Associated-Flow Measurements
44 Flow-Weighted Concentration Flow (cms) 1 b. Seasonal Variation Total Dissolved Phosphorous (mg/l) Mean Flow at 5DF4 (cms) Jan Feb Mar Apr May Jun Jul Aug Sep Oct Nov Dec.1 44 Month
45 2. Water Quality Calibration Sequence Instream Temperature Kinetic rates and transformations Total Nitrogen and Phosphorus: Baseflow: Concentrations assigned based on observed data at each calibration location. Interflow near or slightly higher than groundwater. Surface: Literature based total export coefficients for initial values for build-up and washoff processes. Nutrient Speciation: surface, interflow, and groundwater layers Total Nitrogen - ammonia, nitrate-nitrite, and organic nitrogen components Total Phosphorus - orthophosphate and organic phosphorus 45
46 Water Quality Calibration Sequence, cont d Default kinetic rates and constants. Kinetic processes not very active in colder NSR streams (i.e. nitrification, denitrification). Phytoplankton, BOD and Dissolved Oxygen Sensitive to temperature and nutrient inputs Simulated and compared during & after calibrating dependents Fecal coliform bacteria: Baseflow-associated concentrations 1 #/1mL (conservative estimate for trace quantities during baseflow) Interflow concentrations 4 #/1mL Build-up/washoff rates by land use published values, calibrated first-order decay rate for die-off.8/day (with a temperature correction coefficient of 1.5) 46
 Observed (AB5DE1) Water Quality Calibration Results Rose Creek 3 25 2 15 Temperature 1 5 O-98 A-99 J- A-1 F-2 D-2 O-3 A-4 J-5 M-6 M-7 J-8 Modeled (Reach 92)")

47 Dissolved NITROGEN Oxygen (mg/l) ORGANIC (ORG-N_CALCD) mg/l BOD5 - from TOC (mg/l) NITROGEN TOTAL (TN_CALCD) mg/l NITROGEN TOTAL (TN_CALCD) mg/l AMMONIA DISSOLVED mg/l PHOSPHORUS TOTAL (P) mg/l TEMPERATURE WATER deg C Modeled (Reach 92) Observed (AB5DE1) Water Quality Calibration Results Rose Creek Temperature 1 5 O-98 A-99 J- A-1 F-2 D-2 O-3 A-4 J-5 M-6 M-7 J-8 Modeled (Reach 92) Observed (AB5DE1) TN 1.2 Modeled (Reach 92) Observed (AB5DE1) O-98 A-99 J- A-1 F-2 D-2 O-3 A-4 J-5 M-6 M-7 J Modeled (Reach 92) Observed (AB5DE1) Modeled (Reach 92) Modeled (Reach 92) Observed (AB5DE1) Observed (AB5DE1) TP O-98 6 A-99 J- A-1 F-2 D-2 O-3 A-4 J-5 M-6 M-7 J O-98 A-99 J- A-1 F-2 D-2 O-3 A-4 J-5 M-6 M-7 J O-98 A-99 J- A-1 F-2 D-2 O-3 A-4 J-5 M-6 M-7 J O-98 A-99 J- A-1 F-2 D-2 O-3 A-4 J-5 M-6 M-7 J-8 12 Modeled (Reach 92) Observed (AB5DE1) Dissolved Oxygen O-98 A-99 O-98 J- A-99 A-1 J- F-2 A-1 D-2 F-2 O-3 D-2 A-4 O-3 J-5 A-4 M-6 M-7 J-5 J-8 M-6 M-7 J-
48 Wetland Shrubland Grassland Pasture Herbaceous Annual Evergreen Deciduous NCA Barren Bedrock Developed Total Nitrogen (kg/ha/year) Export Coefficients: Total Nitrogen 1 Interquartile Range Min/Median/Max Grass/Wetland Cropland Forest Other 48
 Export Coefficients: Total Phosphorus 1 Interquartile Range Min/Median/Max 1 1.1.1.1 Grass/Wetland Cropland Forest Other 49")
49 Wetland Shrubland Grassland Pasture Herbaceous Annual Evergreen Deciduous NCA Barren Bedrock Developed Total Phosphorus (kg/ha/year) Export Coefficients: Total Phosphorus 1 Interquartile Range Min/Median/Max Grass/Wetland Cropland Forest Other 49
 Export Coefficients: Fecal Coliform 1,, 1, 1, 1, 1 1 1 Interquartile Range Min/Median/Max Grass/Wetland Cropland")
50 Wetland Shrubland Grassland Pasture Herbaceous Annual Evergreen Deciduous NCA Barren Bedrock Developed Fecal Coliform (Million/ha/year) Export Coefficients: Fecal Coliform 1,, 1, 1, 1, Interquartile Range Min/Median/Max Grass/Wetland Cropland Forest Other 5

51 51 LSPC-EFDC Linkages for Reservoirs

52 52 LSPC-EFDC Linkages for Reservoirs
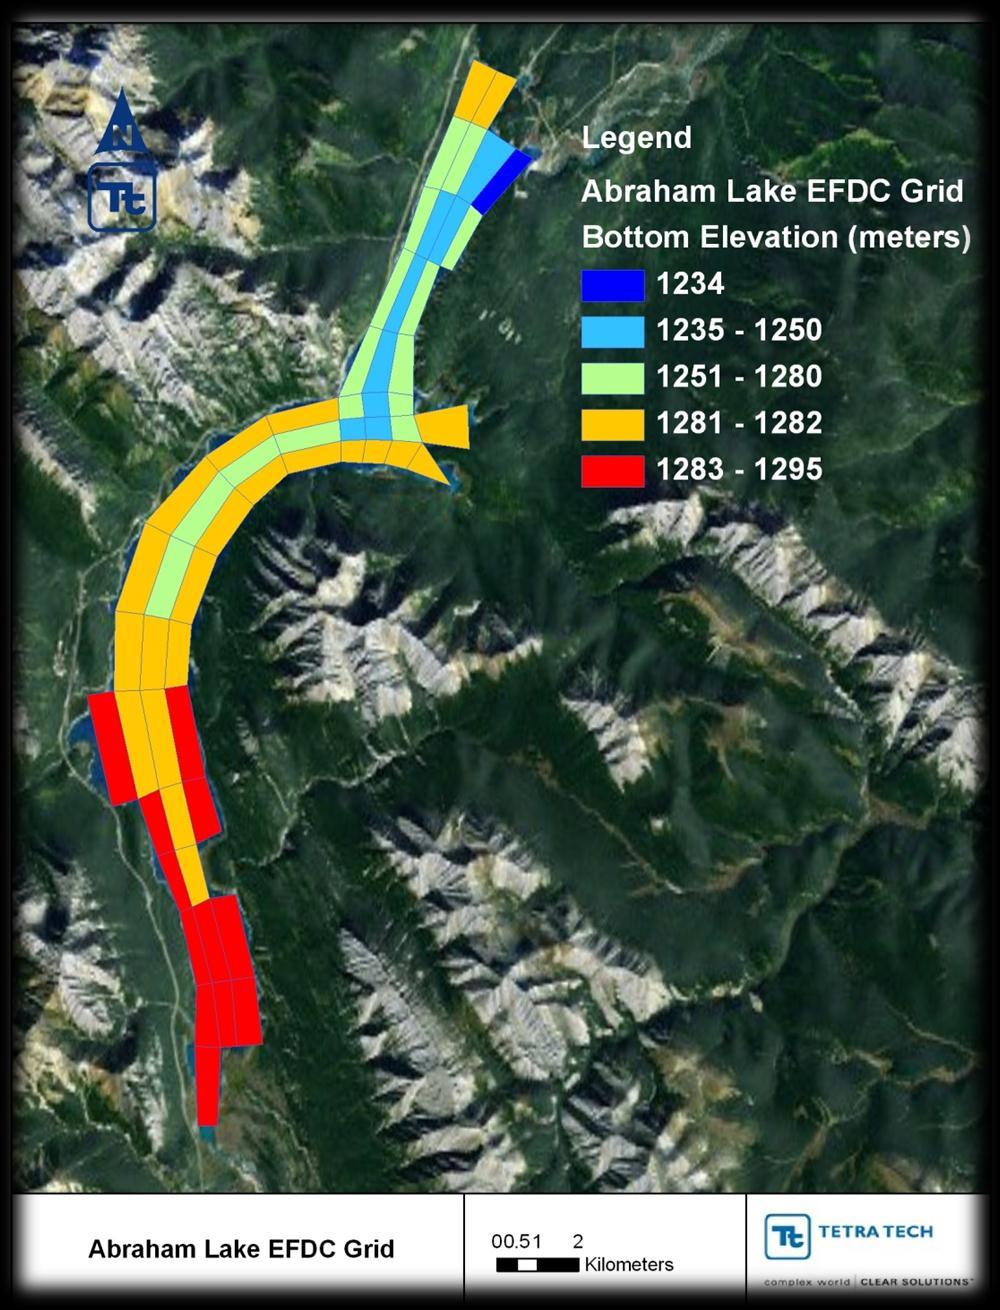
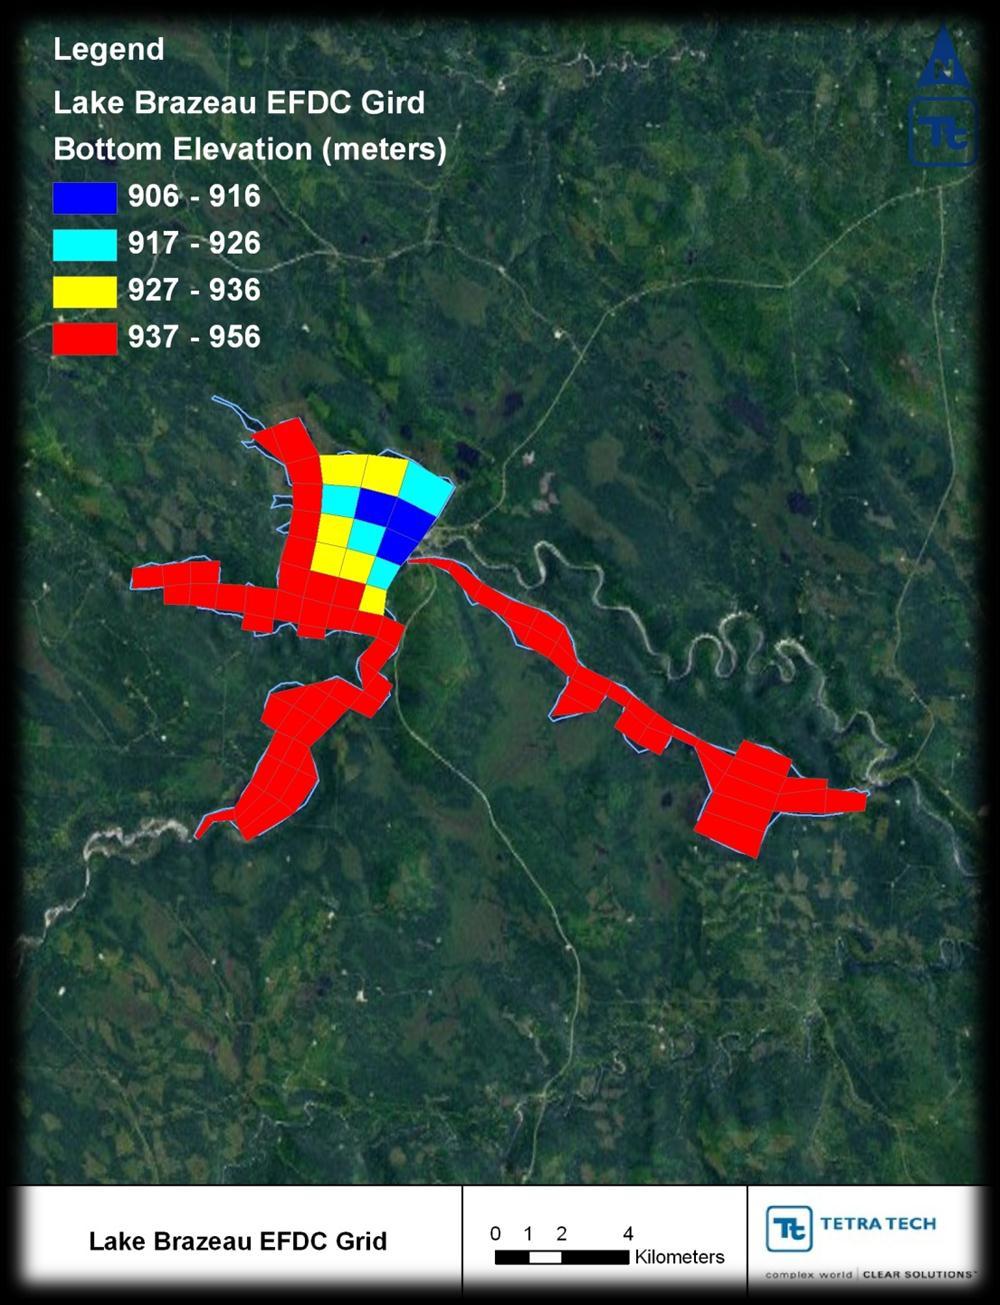
53 53 Bathymetry
54 Summary and Conclusions 54 What is a model? A theoretical construct of a natural system. The modeling process provides an opportunity to investigate and understand the behavior of a natural system. A representative model can be used to evaluate what if? scenarios for water resource management. The modeling process can highlight knowledge deficiencies to inform targeted monitoring and follow-up watershed analyses. All models are wrong, but some are useful. George E. P. Box, Statistician, May 1979