ATMOSPHERE GASES, LAYERS, TEMPERATURES
|
|
|
- Francis Atkins
- 5 years ago
- Views:
Transcription
1 ATMOSPHERE GASES, LAYERS, TEMPERATURES 2/27/2007 1

2 EARTH S S ATMOSPHERE FROM SPACE 2/27/2007 Vicki Drake, SMC 2

3 COMPONENTS OF THE GLOBAL CLIMATE SYSTEM 2/27/2007 Vicki Drake, SMC 3
4 WHAT IS THE ATMOSPHERE? The atmosphere is a gaseous realm Humans live at the bottom of an ocean of air Atmospheric conditions can exert an influence on the Earth s s surface 2/27/2007 Vicki Drake, SMC 4
5 ORIGIN OF EARTH S ATMOSPHERE Original atmosphere developed approximately 4.6 billion years ago Two main gases: Helium and Hydrogen Water vapor (H 2 O) and Nitrogen (N) introduced later Water Vapor sources Outgassing from volcanoes introduced water vapor (H 2 O) Water trapped in mantle rocks percolated to the surface Condensation and precipitation formed world s s ocean - Other possible water source: Comets and Meteors Nitrogen introduced soon after Helium and Hydrogen 2/27/2007 Vicki Drake, SMC 5
6 CONTEMPORARY ATMOSPHERE Contemporary atmosphere developed approximately Billion years ago with introduction of a toxic, corrosive and explosive ( combustible )) gas: OXYGEN (O 2 ) Released by photo-dissociation of H 2 O Produced by Blue-green algae (Stromatolites( Stromatolites) Oxygen constituted a wholesale pollution of the environment; a "holocaust" for all living things on Earth. Oxygen needed for ozone shield protecting Earth surface from damaging ultra-violet rays Ozone shielding allowed life to move into shallow water and eventually onto land. Oxygen build-up up allowed the appearance of the first eukaryotic cells (PLANTS, FUNGI, AND ANIMALS) Eukaryotic cells require oxygen for their more complicated and more efficient metabolism. 2/27/2007 Vicki Drake, SMC 6
7 COMPOSITION OF ATMOSPHERE Permanent Gases Nitrogen 78% by volume Oxygen 21% by volume Remaining gases - <1% by volume Argon Neon Helium Hydrogen Xenon Krypton 2/27/2007 Vicki Drake, SMC 7
8 COMPOSITION OF ATMOSPHERE Variable Gases (Also Greenhouse Gases) Water Vapor 0-4% by volume Carbon Dioxide (CO 2 ) 0.035% (350 parts per million) Methane (CH 4 ) % (0.17 ppm) Nitrous Oxide (N 2 O) % (0.03 ppm) Ozone (O 3 ) % (0.004 ppm) Chlorofluorocarbons (CFCs) % ( ppm) Particulates airborne solids Windblown dust Salt crystals from oceans Aerosols Solid or liquid particles less than 100 microns diameter Volcanic Ash Condensation aerosols Formed by condensations of vapor or reactions of gases Smoke/Soot Forest fires Industries 2/27/2007 Vicki Drake, SMC 8
9 GREENHOUSE EFFECT Energy from the sun (short-wave energy) heats the Earth s surface The Earth radiates long-wave infrared energy back into space. Absorption of Earth s s long-wave radiation by some atmospheric gases add additional heat energy to the atmospheric system. Warmer atmospheric greenhouse gas molecules radiate long- wave energy in all directions. Over 90 % of this emission of long-wave energy is directed back to the Earth's surface, where it once again is absorbed by the surface Without greenhouse effect, the heat would escape to outer space Average temperature of the Earth would drop from an average of +15 degrees Celsius to -18 degrees Celsius! Life as we know it could not survive 2/27/2007 Vicki Drake, SMC 9

10 GREENHOUSE EFFECT 2/27/2007 Vicki Drake, SMC 10
11 GREENHOUSE GASES CARBON CARBON DIOXIDE (CO 2 ) DIOXIDE (CO 2 ) A colorless, odorless gas, denser than air Absorbed and stored in vegetation during photosynthesis Stored in world s s oceans by phytoplanktons Carbonate Released: Main component of chalk, shells, coral reefs, limestone Respiration animal life (all forms) Volcanic eruptions Deforestation 35% of global CO 2 Conversion of forested lands, prairies and woodland into agricultural lands Natural release due to decay of dead vegetation Burning of fossil fuels 65% of global CO 2 Oil, Natural Gas, Coal 2/27/2007 Vicki Drake, SMC 11

12 RESPIRATION Respiration is a key component of the global carbon cycle. Plant respiration Animal respiration However, the direct contribution to atmospheric carbon dioxide concentrations via respiration is relatively insignificant Of more concern is the impact human-induced global warming could have on global respiration rates. Increasing temperatures means rates of respiration may also increase in many organisms. 2/27/2007 Vicki Drake, SMC 12


13 Volcanic Eruptions CO 2 Emissions CO 2 is the second most abundant gas released during volcanic eruptions Concentrated CO 2 emissions kill vegetation, animals and even humans near volcanic openings Volcanoes emit between about million tons of CO 2 into the atmosphere every year Emissions by human activities contribute about 24 billion tons every year 2/27/2007 Vicki Drake, SMC 13

14 DEFORESTATION CO 2 2/27/2007 Vicki Drake, SMC 14

 and other")

15 DEFORESTATION CAUSES AND CONSEQUENCES Deforestation due to: Logging timber or pulp Agricultural purposes Cultivation: Slash-Burn agriculture Cattle grazing World demand for beef Consequences: Increased carbon dioxide (CO 2 ) and other trace gases in the atmosphere billion metric tons of carbon stored in tropical forests worldwide 2/27/2007 Vicki Drake, SMC 15

16 FOSSIL FUEL CONSUMPTION 2/27/2007 Vicki Drake, SMC 16

 U.S.")

17 CO 2 FOSSIL FUEL SOURCES Emissions per ton of oil equivalent or toe (1 toe = kwh = the energy freed by the combustion of one ton of oil ) U.S. CO 2 Emissions vs. World California Fossil Fuel CO2 Emission Sources 2/27/2007 Vicki Drake, SMC 17

18 FOSSIL FUEL CONSEQUENCES 2/27/2007 Vicki Drake, SMC 18
19 FOSSIL FUEL CONSEQUENCES CO 2 is used as a common denominator, and values of other gases are expressed in CO 2 equivalents CO 2 may contribute to global warming Future carbon dioxide levels are expected to continue rising due to ongoing fossil fuel usage 2/27/2007 Vicki Drake, SMC 19
20 METHANE (CH 4 ) CH 4 is released in the decay process of organic material Most common sources: Wetlands Bacteria in rice paddies Wet anaerobic soils Biochemical reactions in stomach of ruminants and termites Landfills 2/27/2007 Vicki Drake, SMC 20
21 TABLE OF METHANE SOURCES TgCH 4 Source Category Landfills Natural Gas Systems Enteric Fermentation Coal Mining Manure Management Wastewater Treatment Petroleum Systems Rice Cultivation Stationary Sources Abandoned Coal Mines Mobile Sources Petrochemical Production Iron and Steel Agricultural Residue Burning Total for U.S /27/2007 Vicki Drake, SMC 21

22 METHANE - WETLANDS The largest sources of methane are the wetlands of the world One-fifth of all methane is emitted by wetlands 2/27/2007 Vicki Drake, SMC 22


23 RICE PADDIES More than 60 % of all rice paddies are found in India and China where scientific data concerning emission rates are unavailable. Contribution of rice paddies is large because this form of crop production has more than doubled since At between 50 and 100 million tons of methane a year, rice agriculture is a big source of atmospheric methane (possibly the biggest of man- made methane sources) 2/27/2007 Vicki Drake, SMC 23
24 BIOCHEMICAL SOURCES OF METHANE 2/27/2007 Vicki Drake, SMC 24
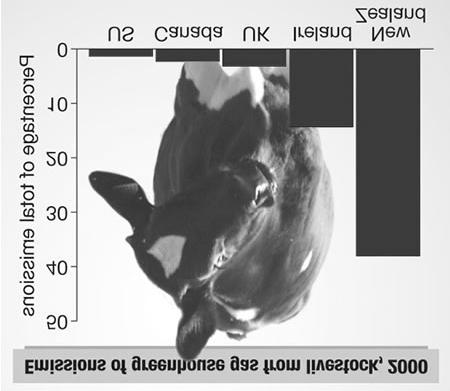
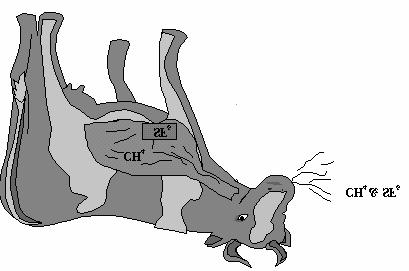
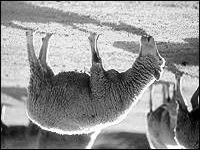
25 METHANE and LIVESTOCK Methane emission from ruminant livestock is currently estimated to be around 100 million tons each year Methane is produced in the guts of ruminant livestock as a result of methanogenic bacteria and protozoa. After rice agriculture, represents the biggest man-made made methane source Sheep can produce about 30 liters of methane each day and a dairy cow up to about /27/2007 Vicki Drake, SMC 25

26 METHANE AND TERMITES Global emissions of termites account for approximately 11% of the global methane emissions from natural sources. Methane is produced in termites as part of their normal digestive process, and the amount generated varies among different species. Termites produce methane in their gut as they digest woody plant material Ultimately, emissions from termites depend largely on the population of these insects, which can also vary significantly among different regions of the world. 2/27/2007 Vicki Drake, SMC 26


27 METHANE AND LANDFILLS In a landfill, biogenic waste is consumed by aerobic bacteria After oxygen is depleted, anaerobic bacteria take over Through fermentation processes, methane is produced Methane must be released carefully it is an explosive gas A grid system of perforated pipes connected to vacuum blowers collect and remove the gas. The landfill gas is either burned off in a flare, or used to generate electricity in a gas turbine 2/27/2007 Vicki Drake, SMC 27
28 NITROUS OXIDE (N 2 O) N 2 O forms in the soil as a result of bacteria and microbes interactions Sources include land-use conversion; fossil fuel combustion; biomass burning; and soil fertilization PRIMARY SOURCE: deforestation and the conversion of forest, savanna and grassland ecosystems into agricultural fields and rangeland The use of nitrate and ammonium fertilizers to enhance plant growth is another source of nitrous oxide. SECONDARY SOURCE: the presence or absence of control devices on combustion sources, such as catalytic converters on automobiles, can have a significant effect on the level of N 2 O emissions. 2/27/2007 Vicki Drake, SMC 28
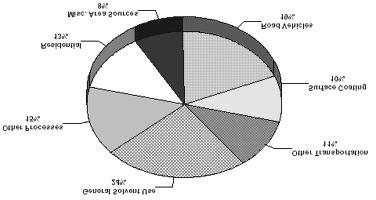
29 NITROUS OXIDE TABLE TgN 2 O Source Category Agricultural Soil Management Mobile Sources Manure Management Human Sewage Nitric Acid Stationary Sources Remaining Settlements Adipic Acid N2O Product Usage Waste Combustion Agricultural Residue Burning Remaining Forest Land Total for U.S /27/2007 Vicki Drake, SMC 29


30 NITROUS OXIDE SOURCES Natural sources: 10 million tons/yr Man-made sources: 8 million tons/yr 2/27/2007 Vicki Drake, SMC 30

31 NITROUS OXIDE (N 2 O CYCLE) 2/27/2007 Vicki Drake, SMC 31
 and ammonia")
32 NITROUS OXIDE CATALYTIC Nitrous oxide comprises 7.2% of global warming gases. Cars and trucks, most fitted with catalytic converters, produce nearly half of that gas Nitrous oxide is produced during the reaction of nitrogen oxide (NO) and ammonia (NH3) over the platinum in the catalytic converter CONVERTER 2/27/2007 Vicki Drake, SMC 32
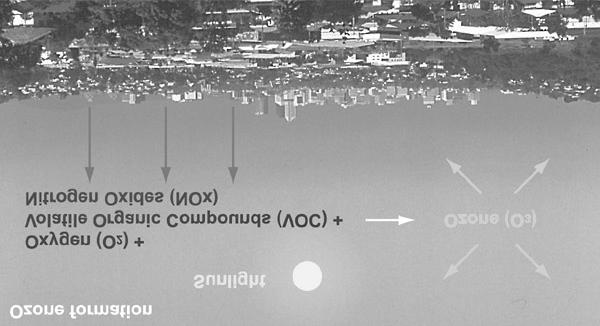
33 OZONE O 3 Ozone is formed naturally by chemical combination of O 2 and O in the presence of sunlight Ozone is a form of Photochemical pollution in lower atmosphere Ozone forms a protective layer in upper atmosphere Maximum Ozone concentration found approximately 30 kilometers above surface of Earth The ozone layer in the acts like a giant sunshade, protecting plants and animals from much of the sun's harmful ultraviolet radiation. 2/27/2007 Vicki Drake, SMC 33
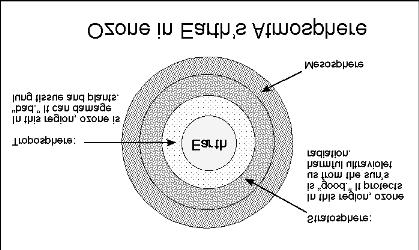
34 OZONE IN ATMOSPHERE 2/27/2007 Vicki Drake, SMC 34
35 DECLINE IN STRATOSPHERIC OZONE Global stratospheric ozone levels have declined Significant evidence of a thinning of the ozone layer during spring and summer Chlorofluorocarbons (CFCs), halons,, methyl chloroform, methyl bromide, carbontetrachloride and several other chemicals are ozone-depleting substances When CFCs and halons are released into the atmosphere, they rise slowly, taking up to seven years to reach the stratosphere. Under the influence of the sun's ultraviolet light, chlorine is released and reacts with ozone, with a depletion of the ozone layer as a consequence. This allows harmful solar UV radiation to pass through to the earth's surface Some of the ozone depleting substances are persistent, remaining active in the atmosphere for up to 50 years. 2/27/2007 Vicki Drake, SMC 35

36 OZONE AND CFCS 2/27/2007 Vicki Drake, SMC 36
37 CHLOROFLUOROCARBONS (CFCS) CFCs are man-made made compounds created for the following purposes: Propellants Hair spray, deodorant, spray paint Refrigeration Freon in refrigerators, freezers, air conditioners Solvents Cleaning materials especially dry cleaners Insulation Exhaust from some aircraft SSTs Concorde 2/27/2007 Vicki Drake, SMC 37
 The 2003 ozone hole covered 11.")
38 HOLE IN OZONE LAYER An ozone "hole" is what scientists call an "ozone depletion area" in that region of Earth's atmosphere The depletion area usually appears with the southern hemisphere spring (August - October) The 2003 ozone hole covered 11.1 million square miles, making it the second largest ever recorded The 2005 hole covered about 10 million square miles While the ozone hole may appear for as much as 40 more years, it is expected to improve Consequences: UV radiation exposure 2/27/2007 Vicki Drake, SMC 38

39 PARTICULATES 2/27/2007 Vicki Drake, SMC 39
40 PARTICULATES SOURCES Particulates introduced directly into the air can originate from natural fires, volcanic eruptions, the ejection of salt crystals by breaking ocean waves and as any sufferer of hay fever can tell you, by the entrainment of pollen by wind. Human activities, especially those involving combustion, produce primary and secondary particulates. 2/27/2007 Vicki Drake, SMC 40


41 HEALTH ISSUES Fine particulates are so small that they can easily be inhaled into the deepest reaches of our lungs, causing serious lung and heart disease. Fine particulates are linked with all sorts of health problems from a runny nose and coughing, to bronchitis, emphysema, asthma and even death. Fine particulates are also a visual blight, capable of reducing visibility so much that beautiful views are blotted out Electronmicrograph of flyash: trash incineration 2/27/2007 Vicki Drake, SMC 41

42 ATMOSPHERE LAYERS Troposphere: km Tropopause Stratosphere: km Stratopause Mesosphere: km Mesopause Thermosphere: 95 km- 200km? 400km? Exosphere Ionosphere 2/27/2007 Vicki Drake, SMC 42
43 LOWER ATMOSPHERE - TROPOSPHERE The lowest layer of the atmosphere All weather occurs here: clouds, winds, storms, etc Extends to an average of 11 kilometers above the surface Higher elevation near equator Lower elevation near poles Temperature decreases at a consistent rate in the troposphere Tropopause upper boundary of troposphere No temperature change in this boundary 2/27/2007 Vicki Drake, SMC 43
44 UPPER ATMOSPHERE STRATOSPHERE the beginning of the upper atmosphere at approximately 20 kilometers above surface Extends to 50 kilometers Ozone layer concentration at 30 kilometers above surface Temperature increases in this layer as UV radiation is absorbed by ozone Stratopause is the uppermost boundary No temperature change in this boundary 2/27/2007 Vicki Drake, SMC 44
45 UPPER ATMOSPHERE MESOSPHERE begins at approximately 55 kilometers above surface Extends to approximately 90 kilometers Atmosphere very thin, temperatures decrease with elevation Mesopause is uppermost boundary 2/27/2007 Vicki Drake, SMC 45
46 UPPER ATMOSPHERE THERMOSPHERE beginning at 95 kilometers above surface Temperature increases due to molecular Oxygen absorbing solar radiation Exosphere the final boundary between Earth s s atmosphere and outer space 2/27/2007 Vicki Drake, SMC 46
47 IONOSPHERE Not a true layer of atmosphere extends throughout much of upper atmosphere An electrified region consisting of IONS Ions are atoms that have lost or gained electrons The visible manifestation of the high-energy ions is seen in the auroras, the colorful Northern and Southern Lights that appear at 90 to 160 kilometers above Earth The light is emitted when charged particles from the sun are guided by the earth's magnetic field into the atmosphere near the poles. When the particles contact atmospheric molecules, primarily oxygen and nitrogen, at altitudes from 300 km down to 100 km, a part of the energy of the collisions transforms to visible light. 2/27/2007 Vicki Drake, SMC 47


48 AURORA BOREALIS AND AURORA AUSTRALIS 2/27/2007 Vicki Drake, SMC 48
 reach the magnetosphere of Earth having a velocity of some 350 to 400 kilometers per second.")
49 MAGNETOSPHERE AND AURORAS The sun spews out charged particles traveling at a million miles per hour known as the solar wind. Charged particles, mostly protons and electrons, emitted from the outer region of the Sun (corona) reach the magnetosphere of Earth having a velocity of some 350 to 400 kilometers per second. Particles which stream out of sunspots may be captured by the Earth's magnetic field and create the aurora. Electrons and protons collide with the gas particles in the outer atmosphere The excited electrons return to their normal states by emitting light of distinct wavelength and thus a distinct color 2/27/2007 Vicki Drake, SMC 49