Salt Lake County Watershed Water Quality Model
|
|
|
- Darren Warner
- 5 years ago
- Views:
Transcription


1 Salt Lake County Watershed Water Quality Model Watershed Symposium August 5, 2010 Presenters: Nicholas von Stackelberg Bryan Close Slide 1
2 Presentation Overview Background and Model Objectives (Nick) Model Capabilities (Nick) Potential Model Applications (Nick) Model Structure (Bryan) Model Calibration Hydrology (Bryan) Model Validation Water Quality (Bryan) Open Discussion Slide 2
3 Acknowledgements Slide 3 Funding South Valley Sewer District through grant administered by Utah Division of Water Quality Salt Lake County Project Team: Salt Lake County Jenni Oman, Project Manager Stantec Consulting Services Nicholas von Stackelberg, Project Manager (Former) Phyllis Mayhew, Project Manager (New) Karen Nichols, Principal (Former) Bryan Close, Lead Modeler Matt Davidson, Engineer Deidre Beck, GIS Expert Review Dr. Tony Donigian and Brian Bicknell, AquaTerra Consultants Dr. Bethany Neilson, Utah State University
4 Watershed Model Advisory Committee Meets every other month to review project and provide feedback Members Salt Lake County Brent Beardall Robert Thompson Marian Hubbard Dan Drumiler Steve Burgon Utah Division of Water Quality Hilary Arens Dave Wham Salt Lake City Public Utilities Florence Reynolds Greg Archuleta Utah State University Dr. Bethany Neilson Slide 4
5 Background Implementation recommendation in 2009 Salt Lake Countywide Water Quality Stewardship Plan Grant application and award 2008 Project initiated April 2009 Model build and calibration complete October 2010 Documentation complete March 2011 Slide 5
6 Project Overview Model Objectives Model Selection Model Build Approach Model Build Hydrology Calibration Hydrology Validation Water Quality Calibration Water Quality Validation Water Quality Management Tool Slide 6
7 Problem Statement How to evaluate the effect of management practices in the watershed on water quality in the tributaries and Jordan River given the complex hydrology of the Salt Lake Valley? Complexities: Water supply and flood control diversions Irrigation return flows Exchange flows Stormwater overflows from canals Stormwater management practices Wastewater treatment plant effluent Slide 7
8 Model Objectives 1. The watershed model will be an on-going drainage and water quality planning and management tool, including future updates to the Water Quality Stewardship Plan. 2. The watershed model will be a decision support tool for potential implementation strategies for the Jordan River Total Maximum Daily Load (TMDL) water quality study. The model may be used for pollutant load estimation, waste load allocation and implementation strategy evaluation for future TMDL water quality studies in Salt Lake County. 3. The watershed model will be a tool for Salt Lake County drainage, flood control and water quality permitting purposes. 4. The watershed model may be used for water quality impact assessments for subbasin-scale proposed actions. 5. The watershed model may be utilized to assess Water Quality Stewardship Plan strategic objectives, such as instream flow analyses and the effect of Utah Lake on the Jordan River and tributaries. Slide 8
9 Desired Model Capabilities Estimate pollutant loads from the watershed Simulate complex hydrology of the valley with diversions and return flows Continuous, dynamic model with capability of simulating multiple years, including dry and wet years Simulate constituents of concern Ability to evaluate best management practices (BMPs) Slide 9
10 HSPF Background Developers AquaTerra Consultants EPA and USGS maintained and distributed Core model in EPA BASINS and Army Corps of Engineers WMS Utilities for data management, pre- and postprocessing, parameter estimation, and help files Slide 10
11 HSPF Fundamentals Watershed model Simulates land surface and subsurface hydrology and quality processes Simulates pollutant transformation and transport through branching stream network Dynamic flow - non-uniform, unsteady flow is simulated. Continuous time scale typically hourly or daily. Lumped parameter areas within subbasin with similar hydrologic response are lumped together. Empirical model requires extensive calibration. One dimensional - channel is well-mixed vertically and laterally. Flow and concentration - Point and nonpoint loads and abstractions are simulated. Water quality kinetics temperature, ph, conservative constituents, sediment, organics, nutrients, DO, BOD, pesticide, metal, pathogen, algae, zooplankton, SOD. Slide 11

12 Nonpoint Pollution Sources Slide 12

13 Watershed Processes Slide 13
14 Salt Lake County Model Basics Continuous hourly simulation from 10/1/1994 through 9/30/2006 Calibration 10/1/1997 9/30/2004 Validation 10/1/1994 9/30/1997 & 10/1/2004 9/30/2006 Extents Salt Lake County including area tributary to Great Salt Lake and Jordan River Davis County area tributary to Jordan River Water quality constituents Temperature Sediment (sand, silt, and clay) Nitrate (NO3) Ammonia (NH3) Orthophosphate (PO4) Biochemical oxygen demand (BOD) Dissolved oxygen (DO) Slide 14
15 Potential Future Applications BMP Module simulates pollutant reduction from stormwater BMPs applied to land uses Low Impact Development (LID) Toolkit generates input to simulate hydrologic and water quality benefits of LID Climate Assessment Tool develops climate change scenarios for assessing hydrologic and water quality effects TMDL Application determine point and non-point source reductions to meet water quality endpoints Jordan River TMDL simulates the loading from the watershed, and the fate and transport of organic matter through the river Slide 15
16 Building the Model Model Segments Meteorology Land-use Drainage Basins Reaches Diversions Point Sources Data Output Slide 16

17 Model Segments Slide 17
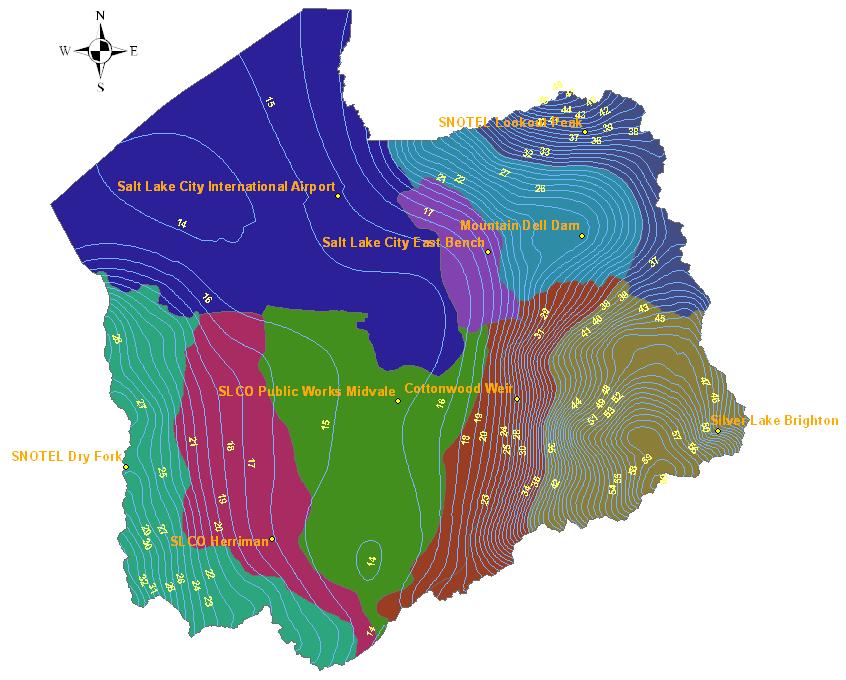
18 Model Segmentation Segment Met Station Recharge Zone 1 SNOTEL Lookout Peak Wasatch Bedrock NE Canyons 2 Mountain Dell Dam Wasatch Bedrock NE Canyons 3 Silver Lake Brighton Wasatch Bedrock SE Canyons 4 Cottonwood Weir Wasatch Bedrock SE Canyons 5 SLC East Bench East Bench Primary Recharge Basin Fill 6 Cottonwood Weir East Bench Primary Recharge Basin Fill 7 SLCO Midvale Secondary Recharge Basin Fill 8 SLCO Herriman West Bench Primary Recharge Basin Fill 9 SNOTEL Dry Fork Oquirrh Bedrock 10 SLIA Discharge Slide 18
19 Slide 19

20 Model Land Use/Land Cover Slide 20
21 Model Subbasins Slide 21

22 Model Reaches 273 total Attributes: 1. ID # 2. Downstream ID # 3. Length 4. Slope 5. Width 6. Depth 7. Min. Elevation 8. Max. Elevation 9. Stream Name Slide 22
 Canals same approach as for streams 5) Drains Use Mannings equation Inventory information: pipe diameter, pipe length, ground slope, pipe type Slide")
23 Reaches - Flow Tables 1) FTABLE: stage-storage-surface area-discharge 2) Ponds inventory information 3) Streams Rely on existing HEC-RAS/HEC-2 files, where available Use HEC-GeoRAS with 2-m terrain to generate HEC-RAS files for other streams 4) Canals same approach as for streams 5) Drains Use Mannings equation Inventory information: pipe diameter, pipe length, ground slope, pipe type Slide 23

24 Diversions 19 total 12 time series 7 constant rate Slide 24

25 Point Sources 6 total Attributes: 1. ID # Time Series: 1. Flow 2. Temperature 3. TDS 4. TSS 5. NH4, NO3, Organic N 6. PO4, Organic P 7. CBOD 8. DO 9. Total Coliform USGS LOADEST for Narrows Slide 25
26 Model Hydrology Calibration Snow SNOTEL Data Flows Gage Data Calibration Locations: Jordan River at 9000 S Combined Flow at Surplus Canal Jordan River at 500 N Mill Creek at Canyon Mouth Mill Creek at Jordan River Big Cottonwood at Canyon Mouth Slide 26
27 Calibration Locations - Flow Slide 27
28 Model Calibration Hydrology Snow Calibration Mill-D SNOTEL Site Slide 28
29 Model Calibration Hydrology Flow Calibration - Big Cottonwood Creek at Canyon Mouth Slide 29
30 Model Calibration Hydrology Flow Calibration - Jordan River at 9000 South Slide 30
31 Model Calibration Hydrology Flow Calibration - Jordan River at 9000 South Wet Year Slide 31
32 Model Calibration Hydrology Flow Calibration - Jordan River at 9000 South Dry Year Slide 32
33 Model Calibration Water Quality Calibration Constituents Sediment Temperature DO BOD Ammonia Nitrate Orthophosphate Calibration Locations: Jordan River at 9000 S Jordan River at 7800 S Combined Flow at Surplus Canal Jordan River at 1700 S Jordan River at Cudahy Lane Mill Creek at Canyon Mouth Big Cottonwood at Canyon Mouth Slide 33
34 Calibration Locations Water Quality Slide 34

35 Model Calibration Water Quality Inorganic Suspended Sediment Jordan River at 7800 South Slide 35
36 Model Calibration Water Quality Temperature Jordan River at 7800 South Slide 36
37 Model Calibration Water Quality Dissolved Oxygen Jordan River at 7800 South Slide 37
38 Open Discussion Jenni Oman Salt Lake County Engineering and Flood Control (801) Bryan Close Stantec Consulting Services Inc. (801) Slide 38