DRAFT 2011 CLIMATE ACTION STRATEGY for the Surface Transportation Sector SAN FRANCISCO, CALIFORNIA
|
|
|
- Victor Hill
- 5 years ago
- Views:
Transcription


1 DRAFT 2011 CLIMATE ACTION STRATEGY for the Surface Transportation Sector SAN FRANCISCO, CALIFORNIA
2 2
3 Outline of the talk 1. San Francisco at a glance 2. Proposition A city goals 3. What is sustainable transportation? 4. Six Strategies to reduce GHGs 5. Key findings 6. Audience and panel discussion 3
4 4

5 Climate Planning Strategies 5
6 6


7 2011 Citywide Climate Action Plan 2004 San Francisco CAP undergoing update in 2011 lead by SFE The SFMTA CAS is the transportation section All City Departments are required to develop a DepCap 7
8 Relationship to other Documents The SFMTA Climate Action Strategy links the city s climate planning work with city/ regional transportation investment plans SFMTA Strategic Plan SF Communitywi de Climate Action Plan Regional Transportatio n Plan/ Sustainable Communities Strategy SF Transportatio n Plan SFMTA and SF Capital Plan 2011 Transportation Climate Action Strategy

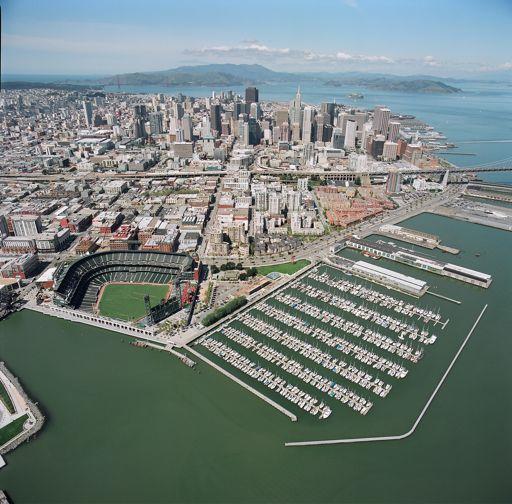
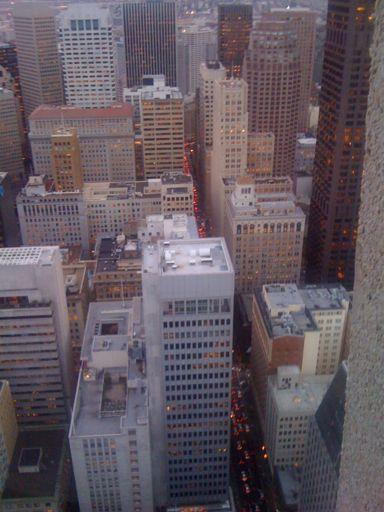
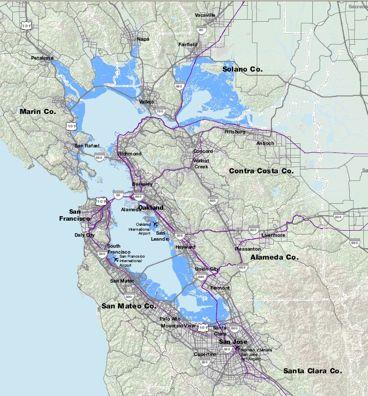
9 SF at a Glance 9
*&+,-./&0(1-+2&!3.")
*+,'! -#$%-#$%.")
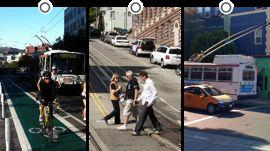
10 City of Short Trips!"#$%&'()*&+,-./&0(1-+2&!3.4&15/(6/718+./691-:;<.:*&! "#$%&#$%&#$'()*+,'! -#$%-#$%.#$'/,'&#-#'' 10
11 Proposition A 2007: Transit Reform, Parking Regulation & Emissions Reductions The voters find that reducing the carbon emissions from San Francisco's transit sector is fundamental to the City s health and well-being and shall be among the Agency s policy priorities. Because the Agency has significant influence on San Francisco's transportation sector, which is responsible for half of the carbon emissions within the City, the voters direct the Agency to develop and implement strategies for substantially reducing those emissions. The voters further affirm the goals of the City s Climate Action Plan. 11


12 1980 Is This Sustainable Mobility? That which is not sustainable, by definition, cannot continue. 12
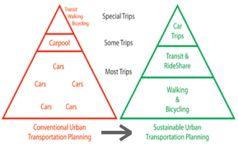
13 Sustainable Transportation! 13
14 14


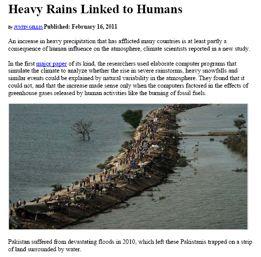
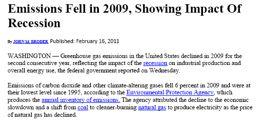
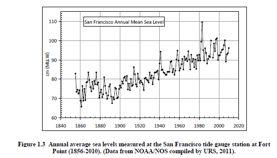
15 Climate Change Impacts Sea level rise Increase severity of storms and drought Regular delays and disruptions in travel Significant impacts and damage to infrastructure, business and human/biological well-being The greatest impacts will be caused by, and felt outside the industrialized world 15
16 GHGs by Sector Overall GHG reductions = increases in transit 51% or 43% 16
17 Greenhouse Gas Emissions Reduction Strategies 17
18 Greenhouse Gas Emissions Reduction Strategies 18
19 Greenhouse Gas Emissions Reduction Strategies 19
20 Greenhouse Gas Emissions Reduction Strategies 0+12' Produced By Timothy Papandreou
21 Interdependent CAS Strategies Transportation Demand Management Strategy 1: Travel Choice Strategy 2: Demand Pricing Strategy 3: Transit-Oriented Development Infrastructure Support Strategy 4: Transit Improvements Strategy 5: Complete Streets Strategy 6: Electric/Low Carbon Vehicles 21


22 Strategy 1: Travel Choice Expanding commuter, visitor and resident travel options Parking policy and cashout reforms Integrating information, payment and services Education and outreach to residents 22


23 Strategy 2: Demand Pricing Expand Sfpark, demandbased fees citywide to create supply and reduce VMT Implement variable rate road pricing (cordon, bridges regional partnerships and legislative actions needed) Implement Intelligent Transportation Systems and predictable travel routing 23


24 Westwood 10 blocks, 500 spaces 24
25 Cruising creates excess vehicle travel 1. 3 minutes to find a curb space, the turnover rate is 10 cars per space per day. 2. Cruising 3 minutes for parking 10 times a day creates 30 vehicle-minutes of travel per curb space per day. 3. Cruising for 30 minutes at 10 miles an hour creates 5 VMT per space per day. 4. Cruising 5 VMT a day for 500 spaces creates 2,500 VMT per day. 5. Cruising 2,500 VMT a day for 365 days creates 912,500 VMT per year.
26 How far is 912,500 VMT? 36 trips around the earth (25k miles) 4 trips to the moon (239k miles) It would take one person 10 years, 24 hours a day, to drive 912,500 miles. Wastes 47,000 gallons of gasoline Produces 730 tons of CO 2 One part, of one city, in one year
 Increase required parking for")

27 Strategy 3: Transit-Oriented Development Focus housing and job growth along existing transit lines (transportation nexus) Increase required parking for carshare and bicycles in new developments Remove parking requirements for new developments Require smart mobility passes as part of homeowners association fees and business leases. 27


28 Strategy 4: Transit Improvements Optimize the transit system for current/ projected demand Create new capacity for future growth and mode shift from TDM Strategies Expand regional transit capacity to serve growth, primary routes and allow mode shift Address system safety and state of good repair ($2.2B v $12.2B current and future) 28


29 Strategy 5: Complete Streets Dedicate transit only lanes Complete bicycle plan and develop cycle tracks network Enhance pedestrian safety features Phase implementation of slow zones, and complete green streets Implement bicycle sharing citywide and electric bicycle capacity 29


30 Strategy 6: Electric Vehicles Convert 100% of taxi fleet to low-carbon vehicles Build public charging infrastructure and incentivize shared low carbon vehicles Require charging infrastructure for new development Require smart grid networked vehicle charging systems for existing and new developments. 30
78'0459*' 34562)78'0459*' Metric")
<+?'@)+?")
31 Regional vs. San Francisco goals/contribution 34562)78'0459*' 34562)78'0459*' Metric Tons/Day (1000s) ~10% reduction from trend! :1;5<(5*'0459*' ABC'-DEF' ~ 50% reduction from trend! :1;5<(5*'0459*' NOBP' G)<+?'@)+?H' AI4*J'KLM#KF' =>?@& =>?@& Source: MTC, SF CHAMP 4.1 p2009

32 32
33 Achieving SF s Ambitious Goals (25% below 1990 by 2017 and 40% by 2025) 91% of emissions come from passenger vehicles (VMT) any real reduction must focus here. Significant political and financing challenges are major obstacles to GHG reductions and lifestyle changes If ALL local strategies are implemented and combined with our partners efforts - our goals might be attainable 33
34 Key Findings by Strategy getting to 50% below 1990 levels by 2035 Travel Choices/TOD policies: Cost effective to implement now Demand Pricing: Mode shifts generate new LOCAL revenue and demand for transit, bicycle and walking (politically challenging) Transit capacity: future growth and all mode shift strategies rely on core transit capacity and complete street buildout Electrification: EV adoption requires significant investment (public and private) 34
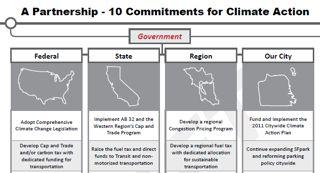
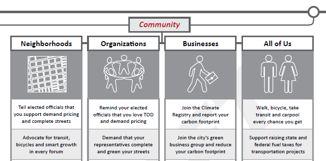
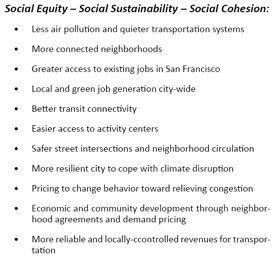
35 Government and Community roles 35

36 Q and A Transportation Panel: David Baker, SPUR and SF Bicycle Coalition Board Timothy Papandreou, SFMTA Deputy, Sustainable Streets Liz Brisson, Transportation Planner, SFCTA Peter Brown, Project Manager peter.brown@sfmta.com