Beyond Pipe and Pond. Research Based Stormwater System Design. August 9, 2010
|
|
|
- Madlyn Henderson
- 5 years ago
- Views:
Transcription
1 Beyond Pipe and Pond Research Based Stormwater System Design August 9, 2010
2 Agenda for the Day Introduction UNHSC: UNHSC: A Resource A for Independent Data Data Unit (UOPs) Unit Operations & Processes (UOPs) Break UNHSC UNHSC Performance Data Data Lunch Effective SWM Case Studies Studies Site Design Site Assessment Break Assessment Challenge Continued Group Group Debrief & Discussion 2

3 Introduction Name Affiliation What is YOUR biggest challenge in implementing advanced stormwater designs? 3

4 Why We re Here Goal of Clean Water Act is to delist Something isn t working Water Quality is Declining 4
5 What Can Be Done? EPA can/will enforce regulations Clean Water Act Phase II Antidegradation TMDLs Residual Designation Authority & Engineers can change the way they do business! 5

6 Why You re Here Gain a competitive advantage Overcome technical barriers to effective design Learn how to use UNHSC data to make your job easier Apply what you learn to real world designs 6


7 Materials We Will Use Today 7
8 Agenda for the Day Introduction UNHSC: UNHSC: A Resource A for Independent Data Data Unit Operations & Processes (UOPs) Break UNHSC Performance Data Lunch Effective SWM Case Studies Site Design Assessment Break Assessment Continued Group Debrief & Discussion 8

9 University of New Hampshire Stormwater Center Providing Data to Protect Water Quality Since


10 Why the Center Was Created Three-Year Study of Conventional Systems 10
11 Study Found That 34% Of the time systems offered some kind of treatment 26% Of the time systems did nothing 40% Of the time systems exported more pollutants Systems failed 2/3 of the time! 11


12 Outcome of Study Conventional approaches not adequate Innovative approaches could be more effective More science & evaluation was needed. UNHSC was created 12

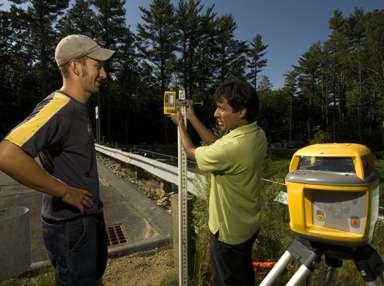
13 Who We Are scientists technicians educators 13

14 What We Do BMP Performance Monitoring 14

15 Site Location UNHSC Site 15

16 BMP Performance Monitoring Research Field Facility at UNH Tc ~ 19 minutes Watershed Boundary UNHSC Research Facility Bioretention Retrofit Tree Filter Porous Asphalt 16

17 BMP Performance Monitoring 17

18 BMP Performance Monitoring How We Evaluate Systems 18

19 BMP Performance Monitoring What We Look For 19


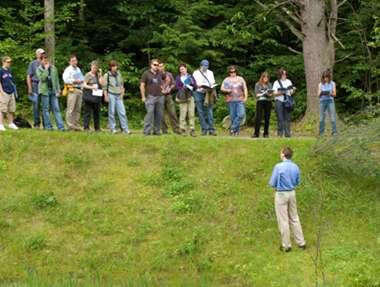
20 What We Do: Outreach Data Reports Web Resources BMP Fact Sheets Workshops Design Specs Journal Articles 20

21 Outreach Not a One Way Street 21


22 What We Do: Targeted Research pavement sealants cold climate thermal impacts 22


23 Training Partners 23

24 Questions? 24
25 Agenda for the Day Introduction UNHSC: A Resource for Independent Data Unit Operations Unit & Processes (UOPs) (UOPs) Break UNHSC Performance Data Lunch Effective SWM Case Studies Site Design Challenge Break Assessment Continued Group Debrief & Discussion 25
26 Stormwater Outreach Can Be Challenging Because we don t always speak the same language Swale Permeable Retention Interlocking Pond Concrete Detention Pavers Pond Permeable Subsurface Permeable Interlocking Detention Interlocking Concrete Water Concrete Pavers Quality Inlet Pavers Permeable Interlocking Concrete Pavers Downstream Defender Bio-Swale Naturalized Basin Permeable Interlocking Permeable Concrete Interlocking Pavers Concrete Pavers Storm Trooper Vort-Sentry V2B1 Permeable Interlocking Permeable Interlocking Concrete Pavers Concrete Bay Pavers Saver Bioretention Permeable Permeable Interlocking Rain Interlocking Garden Concrete Concrete Pavers Tree Filter Pavers Filtera Sand Filter Delaware Austin ADS StormTech Permeable Interlocking Concrete Pavers Gravel Wetland Permeable Stormwater Interlocking Wetland Concrete Surface PaversWetland Pervious Permeable Concrete Interlocking Porous Asphalt Concrete Pavers Constructed Wetland 26


27 Imagine the Ultimate System Sonic Swirl Enforcer It Cleans! It Disinfects! It Will Get eliminating everything in it s path You the Job! 27

28 Now Consider Bioretention 28

29 No Need to Reinvent this Wheel Use Unit Operations & Processes (UOPs) Physical Operations Biological Processes Chemical Processes Hydrologic Operations 29

30 Physical UOPs Sedimentation Enhanced Sedimentation Filtration Screening


31 Biological UOPs Vegetative Process Microbial Process


32 Chemical UOPs Sorption Antibacterial Flocculation Coagulation


33 Hydrologic UOPs Flow Alteration Volume Reduction

34 Using UOPs to Meet Your Challenges Number of UOPs that can Sediment solve & associated ALL of pollutants your problems: Sedimentation, filtration Nitrogen Vegetative uptake & microbial processes Phosphorus Sorption & vegetative processes Water quantity management flow alteration, volume reduction 34
35 Combining UOPs within Systems Contaminant 1 Contaminant 2 Contaminant 3 Pretreatment Primary Treatment Secondary Treatment 35

36 Combining Systems to Get the UOPs You Need 36

37 Questions? 37
38 Agenda for the Day Introduction UNHSC: A Resource for Independent Data Unit Operations & Processes (UOPs) Break UNHSC Performance Data Lunch Effective SWM Case Studies Site Design Assessment Break Assessment Continued Group Debrief & Discussion 38
39 Agenda for the Day Introduction UNHSC: A Resource for Independent Data Unit Operations & processes (UOPs) Break UNHSC UNHSC Performance Data Data Lunch Effective SWM Case Studies Site Design Assessment Break Assessment Continued Group Debrief & Discussion 39

40 Putting UOPs into Practice 40
41 Environmental Site Design Factors to Consider Resource conservation (watershed & site) Minimization (site level) Strategic timing (watershed & site level) Integrated management practices (site level) Pollution prevention 41

42 Conserve Good Soils Minimize Cut and Fill use existing contours to the maximum extent August 9, 2010 Conserve sensitive resources

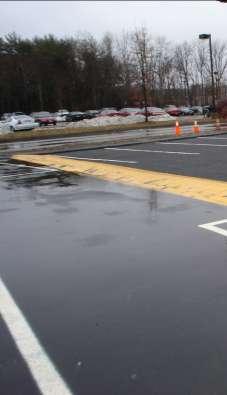
43 Minimize Impervious Surface Utilize or Infiltrate Rooftop Minimize end of pipe treatments
44 Systems We Will Cover Retention pond Swales Hydrodynamic separators Porous pavements Subsurface manufactured systems Bioretention systems Subsurface gravel wetland

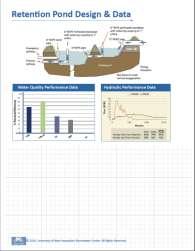
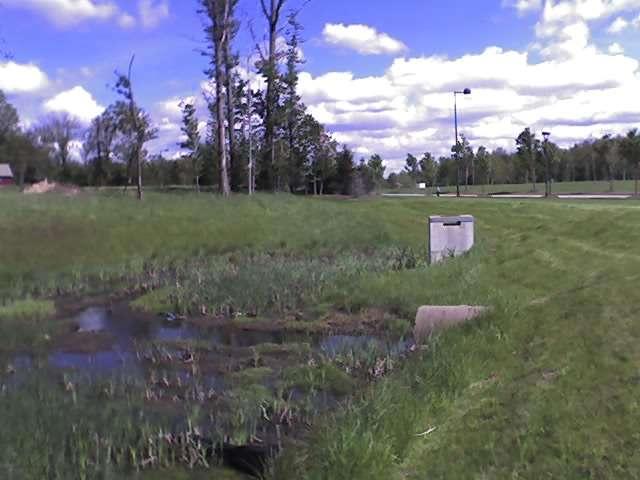
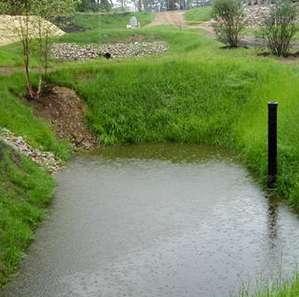
45 Retention Ponds 45

46 Pond Design 46

47 Retention Pond Hydraulic Performance 47
48 Retention Pond Water Quality Treatment % Removal Efficiency

49 Retention Pond Water Quality Treatment 49
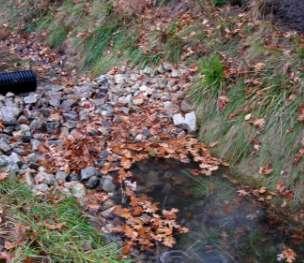

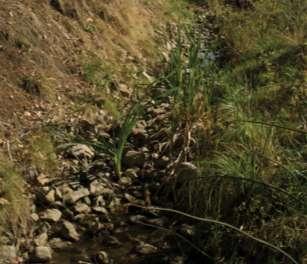
50 Swales stone-lined vegetated filter berm retrofit 50


51 Swale Design 51


52 Hydraulic Performance of Swales Vegetated Swale Hydraulic Performance Stone-lined Swale Hydraulic Performance Inflow Effluent 52
53 Swale Water Quality Treatment % Removal Efficiency Stone Swale Veg Swale Berm Swale

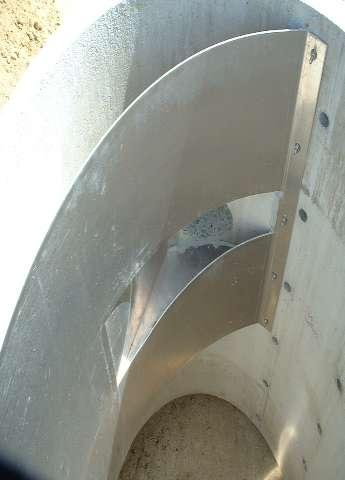
54 Hydrodynamic Separators (HDS) 54

55 HDS Design 55
![HDS Hydraulic Performance The effect of T and [Cl - ] is](/docs-images/86/93526014/images/56-0.jpg "to nearly double the settling time from 1.6 to 3.")
56 HDS Hydraulic Performance The effect of T and [Cl - ] is to nearly double the settling time from 1.6 to 3.4 cm/sec 56
57 HDS Water Quality Treatment % Removal Efficiency

58 58

59 Porous Pavements 59

60 Porous Pavements Design 60


61 Hydraulic Performance of Porous Pavements Pervious Porous Concrete Asphalt Hydraulic Performance 61
62 Subsurface Filtration/ Infiltration System Water Quality Treatment % Removal Efficiency Porous Asphalt Pervious Concrete 62


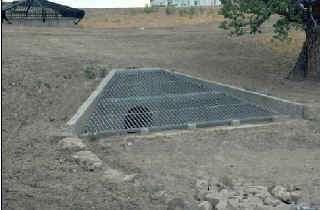
63 Subsurface Manufactured Systems filtration detention / infiltration 63

64 Stormtech Detention/ Infiltration System Design

65 Subsurface Detention / Infiltration Hydraulic Performance 65

66 ADS Detention / Infiltration Design

67 Subsurface Manufactured Filtration System Design
68 Subsurface Filtration/ Infiltration System Water Quality Treatment % Removal Efficiency ADS StormTech AquaFilter 68


69 Bioretention Systems tree filters bioretention 69
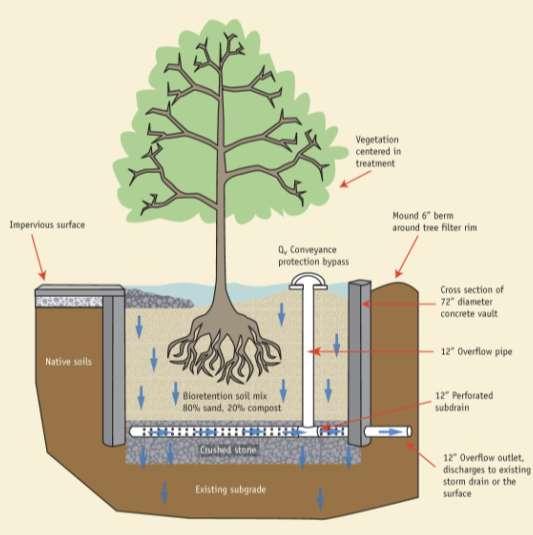
70 Bioretention System Design 70

71 Bioretention System Hydraulic Performance 71
72 Bioretention System Water Quality Treatment % Removal Efficiency NA Bio I Bio II Tree Filter 72

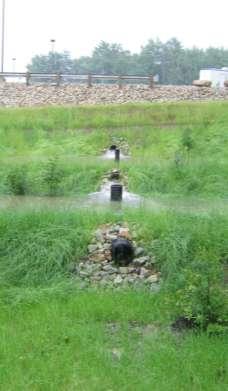
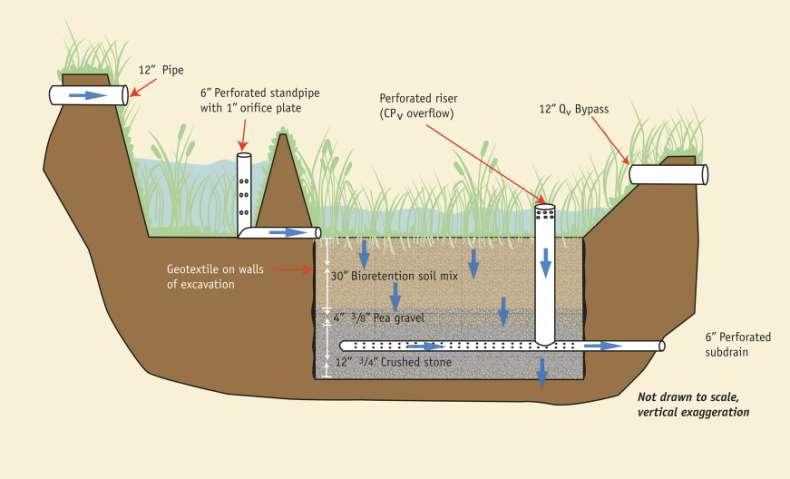
73 Subsurface Gravel Wetland 73

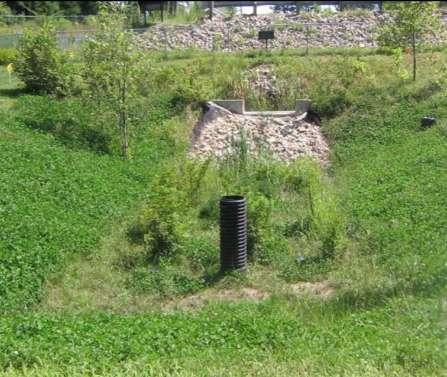
74 Subsurface Gravel Wetland Design 74

75 Subsurface Gravel Wetland Hydraulic Performance 75
76 Gravel Wetland Water Quality Treatment % Removal Efficiency
77 Side by Side. How do they compare?
78 TSS % Removal Efficiency TSS Removal Efficiencies
79 DIN % Removal Efficiency DIN Removal Efficiencies
80 TP % Removal Efficiency TP Removal Efficiencies

81 Questions? 81
82 Agenda for the Day Introduction UNHSC: A Resource for Independent Data Unit Operations & Processes (UOPs) Break UNHSC Performance Data Lunch Effective SWM Case Studies Site Design Challenge Break Assessment Continued Group Debrief & Discussion 82
83 Agenda for the Day Introduction UNHSC: A Resource for Independent Data Unit Operations & Processes (UOPs) Break UNHSC Performance Data Lunch Effective SWM Case Studies Study Site Design Assessment Break Assessment Continued Group Debrief & Discussion 83
84 Agenda for the Day Introduction UNHSC: A Resource for Independent Data Unit Operations & Processes Break UNHSC Performance Data Lunch Effective SWM Case Studies Site Design Site Assessment Break Challenge Continued Group Debrief & Discussion 84
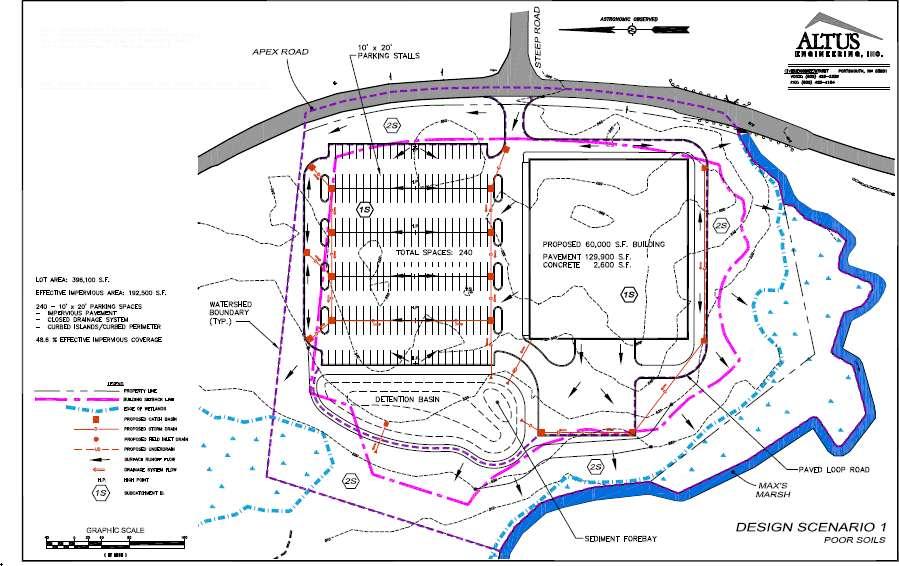
85 Site Design Assessment 85
86 Group Presentations
87 Predevelopment Conditions
88 Conventional Design

89 Hybrid Design

90 LID Design
91 Peak Flow Control (cfs) 2 YR YR YR YR YR 6.25 Predevelopment Conventional Hybrid LID
92 Groundwater Recharge Volume (cf) Required for 1 event Achieved Predevelopment NA NA Conventional 0 1,693 Hybrid 1,684 6,684 LID 1,087 8,232
93 Water Quality Treatment (%) Removal Efficiency TSS RE TN RE TP RE Postdevelopment Annual Load No BMPs (lbs) Conventional Annual Load (lbs) Hybrid Annual Load (lbs) LID Annual Load (lbs) % % 33% % 0% % % 54% % 60 97% % 55% %
94 Water Quality Treatment Total Nitrogen Compliance TN Difference Predevelopment Annual Load (lbs) % Conventional Annual Load (lbs) Hybrid Annual Load (lbs) LID Annual Load (lbs) ( lbs) ( lbs) ( lbs)
95 Installation Cost Comparison Paving Stormwater Combined Conventional $479,550 $100,150 $579,700 $479,550 $100,150 $579,700 Hybrid $467,010 $95,160 $562,170 $467,010 $95,160 $562,170 LID $412,720 $198,724 $611,444 $412,720 $198,724 $611,440
96 Review of the Day Introduction UNHSC: A Resource for Independent Data Unit Operations & Processes (UOPs) Break UNHSC Performance Data Lunch Effective SWM Case Studies Site Design Assessment Break Assessment Continued Group Report Group Debrief Out & Discussion & Discussion 96