Eyes Over Puget Sound: Producing Validated Satellite Products to Support Rapid Water Quality Assessments in Puget Sound
|
|
|
- Dinah Lawson
- 5 years ago
- Views:
Transcription
 May 2nd, 10:30 AM - 12:00 PM Eyes Over Puget Sound: Producing Validated Satellite Products to Support Rapid Water Quality Assessments in Puget Sound Brandon Sackmann Integral Consulting Inc.")

. Salish Sea Ecosystem Conference. 82. https://cedar.wwu.")
1 Western Washington University Western CEDAR Salish Sea Ecosystem Conference 2014 Salish Sea Ecosystem Conference (Seattle, Wash.) May 2nd, 10:30 AM - 12:00 PM Eyes Over Puget Sound: Producing Validated Satellite Products to Support Rapid Water Quality Assessments in Puget Sound Brandon Sackmann Integral Consulting Inc., bsackmann@integral-corp.com Christopher Krembs Washington (State). Department of Ecology Suzan Pool Julia Bos Tarang Khangaonkar Pacific Northwest Pollution Prevention Resource Center Follow this and additional works at: Part of the Terrestrial and Aquatic Ecology Commons Sackmann, Brandon; Krembs, Christopher; Pool, Suzan; Bos, Julia; and Khangaonkar, Tarang, "Eyes Over Puget Sound: Producing Validated Satellite Products to Support Rapid Water Quality Assessments in Puget Sound" (2014). Salish Sea Ecosystem Conference This Event is brought to you for free and open access by the Conferences and Events at Western CEDAR. It has been accepted for inclusion in Salish Sea Ecosystem Conference by an authorized administrator of Western CEDAR. For more information, please contact westerncedar@wwu.edu.

 Christopher Krembs, Suzan Pool, Julia Bos, and Tarang Khangaonkar 2 May 2014")
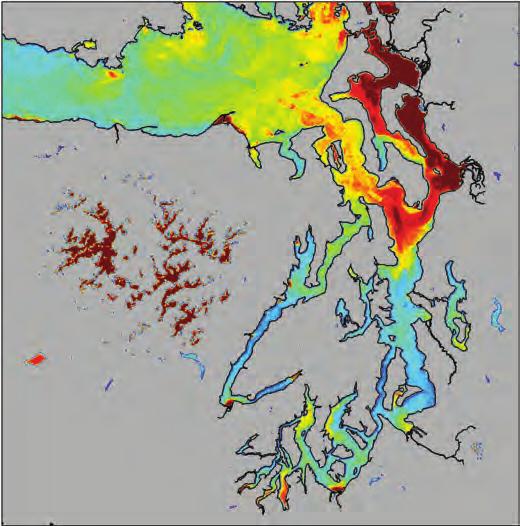
2 24 July 2011 Eyes Over Puget Sound Producing Validated Satellite Products to Support Rapid Water Quality Assessments in Puget Sound MODIS-Aqua 500-m Chlorophyll a product developed for Puget Sound, WA. Brandon Sackmann (bsackmann@integral-corp.com) Christopher Krembs, Suzan Pool, Julia Bos, and Tarang Khangaonkar 2 May 2014 Salish Sea Conference 2014

3 What is Eyes Over Puget Sound (EOPS) Communication/outreach product developed by WA Ecology with a focus on near-surface conditions Merges aerial photographs, satellite data, ferry observations, in situ CTD measurements, mooring data, and regional weather!!! 3+ yrs 640+ subscribers 1M+ downloads 2-day turn-around!!!
4 Ferries provide a novel source of ground truth information Satellite observations are most useful when they can be reconciled with ground truth observations Ferries provide a unique dataset that lets us do this in a scientifically-rigorous and cost-effective way Ferries Satellites PS-Wide Water Quality Products
 Turner Designs")
")

 Sea")

 Sea")

 Depth-resolved")
5 Ferries for Science (x2) Turner Designs C3 optical sensor (May 2010-present) Phytoplankton (chl a fluor.) Turbidity River water (CDOM fluor.) Sea Surface Temperature RDI Citadel Thermosalinograph (2012-present) Sea Surface Temperature Sea Surface Salinity RDI Workhorse Mariner ADCP 300 khz (May 2014) Depth-resolved currents Acoustic backscatter

 5 mile long transect (8-10 knots) 1-2 time daily")
6 Ferries for Science (x2) M/V Salish and Kennewick Victoria Clipper IV Cost-effective data collection 100 m spatial resolution (5 sec.) 300 m spatial resolution 4-hr temporal resolution ~1-hr temporal resolution Regular schedules/reliable 80 mile long transect (30 knots) 5 mile long transect (8-10 knots) 1-2 time daily (year-round) time daily (year-round) Daily data pickup (WSF data available via web)

 Algal Biomass (Chlorophyll a, FLH, MCI)")
 Combined approach using traditional ocean color sensors and")
7 What can be measured from space? Hi-res products for coastal and offshore applications Time period: 2000 Present (1-8 day revisit) Resolution: m, hi-res; >1 km, standard-res Water Quality Indicators Water Color (True Color/RGB) Algal Biomass (Chlorophyll a, FLH, MCI) Water Clarity (Turbidity) Freshwater Influence (CDOM) Sea Surface Temperature (nearshore) Combined approach using traditional ocean color sensors and terrestrial platforms (coastal/offshore) MERIS Ocean Color Sat.

")

 planned for 2015/2017; we need to be")
8 What can be measured from space? Hi-res products for coastal and offshore applications 23 April 2011 Multiple parameters from a single image MERIS (ESA) provided global, hi-res (300 m) ocean color products for coastal and offshore applications ( ) Follow-on missions (OLCI) planned for 2015/2017; we need to be able to take advantage of these datasets


9 Phytoplankton Bloom Off Bainbridge Island 22 August 12 September 2011 Ferry data corroborated satellite images. Merged dataset remotely defined temporal and spatial extent of the bloom! --- Fouling MERIS Chl 27 Aug


10 Hi-res satellite products can be challenging to produce due to optical complexity, lack of standard algorithms, and insufficient ground truth spanning large optical gradients. 23 April 2011
11 Partial Least Squares Regression Widely used in chemometrics, bioinformatics, sensometrics, neuroscience and anthropology Well suited when predictors are many and highly collinear Emphasis is on predicting the responses; not necessarily on understanding the relationship between variables Leverages information from all spectral channels (visible -> near IR) Can be used with a variety of ocean color sensors Requires no atmospheric correction (TOA radiances adjusted for Rayleigh scattering only) 5 n = 3495 >75% of variance explained using 5 PLS components
12 Partial Least Squares Regression
 NASA Kd490 (SeaWiFS Global Open")
13 Partial Least Squares Regression 23 April 2011 Integral Turb PLSR (Puget Sound) NASA Kd490 (SeaWiFS Global Open Ocean)


14 Partial Least Squares Regression
 Seasonal anomalies <-> climate change (e.")

15 Uses for validated satellite information products Retrospective Analyses <-> Real-time Monitoring <-> Forecasting/Risk Assessment Habitat characterization, ecological impact assessments, and permitting (e.g., aquaculture facilities) Seasonal anomalies <-> climate change (e.g., develop a comprehensive ocean color baseline for Puget Sound) Red tides and harmful algal blooms Eutrophication/shifting food webs Optimize field operations/sampling in dynamic areas Spill assessment and management Initial conditions and cal/val data for WQ modeling


16 Recommendations/Future Efforts Blend data from multiple sources to create value-added information products PLSR method refinements QA procedures for in situ data (including mid-day F quenching) Operational workflow for creating validated products Move beyond static maps of individual WQ indicators Characterize spatial variability/gradients Feature/anomaly detection