West Seattle and Ballard Link Extensions. Level 2 Evaluation Results September 2018
|
|
|
- Shavonne Tucker
- 5 years ago
- Views:
Transcription

1 West Seattle and Ballard Link Extensions Level 2 Evaluation Results September 2018
2 Agenda Introductions and purpose Community engagement update Alternatives development overview Level 2 alternatives evaluation Next steps 2

3 Community engagement and collaboration 3
4 SAG and ELG meetings SAG Meeting #8 Sept. 5, 2018 Community engagement and collaboration Level 2 evaluation results SAG Meeting #9 Sept 26, 2018 Community engagement and collaboration Level 2 recommendations ELG Meeting Oct. 5, 2018 Community engagement and collaboration Level 2 recommendations 4

5 Community Engagement Update 5
6 External Engagement Report: Jun-Aug comments and questions 8 festivals engaging more than 3,300 community members 6 updates engaging more than 4,000 subscribers 49 community briefings 4 Tweets engaging more than 82,000 users 2 Stakeholder Advisory Group meetings 5 posts engaging more than 30,000 users 1 Elected Leadership Group meeting 6
7 June briefings snapshot Chinatown-International District BIA (6/7) Seattle Design Commission (6/7) Pigeon Point Neighborhood Council (6/11) South downtown stakeholders (6/12) Seattle Planning Commission (6/14) Neighborcare Health Ballard (6/18) SODO BIA Transportation Committee (6/19) Ballard Food Bank (6/20) Sound Transit Citizen Oversight Panel (6/21) CID Framework Capital Projects Coordination Workgroup (6/22) UW Medicine (6/25) NSIA (6/26) Ethiopian Community in Seattle (6/26) West Seattle Food Bank (6/28) Southwest Youth & Family Services (6/29) 7
8 July briefings snapshot WSB Station Access Discussion (7/6) Mary s Place (7/10) Central Ballard Residents Association (7/12) South downtown stakeholders (7/12) SODO BIA Transportation Committee (7/13) Ballard Mill Marina (7/16) Western Towboat & American Waterway Operators (7/18) Ferguson Terminal (7/18) Fremont Tugboat (7/19) Transit Access Coalition (7/25) Plymouth Housing Group (7/25) Coastal Transportation (7/25) CID Forum (7/25) Neighborhood House at High Point (7/26) Seattle Maritime Academy (7/26) West Seattle JuNO (7/26) Downtown Residents Council / DSA (7/27) Chinese Information & Service Center (7/30) Mercer Corridor Stakeholders Committee (7/31) 8
9 August briefings snapshot Seniors in Action Foundation (8/1) NW Marine Trade Association (8/3) Seattle Yacht Club (8/3) Bowman Refrigeration (8/7) Drink & Link in Delridge (8/8) Labor organizations (8/8) Tugboat tour with Western Towboat (8/10) The Salvation Army (8/20) Wing Luke Museum (8/21) Seahawks/Public Stadium Authority (8/22) Housing Development Consortium (8/23) Downtown Emergency Service Center (8/28) St. Luke s Episcopal Church (8/29) SLU Community Council, Transportation Committee (8/29) United Indians of All Tribes Foundation (8/29) 9
 Delridge Day (8/11) Celebrate Little Saigon (8/26) Chinatown-ID Night Market (9/8) Fishermen s Fall Festival (9/15) Sustainable Ballard Festival (9/22) Magnolia Farmers Market (10/6) Dia de")
10 2018 Festivals Morgan Junction Festival (6/16) Festival Sundiata (6/16-6/17) West Seattle Summer Fest (7/13-7/15) Ballard Seafood Fest (7/13-7/15) Dragon Fest (7/14-7/15) South Lake Union Block Party (8/10) Delridge Day (8/11) Celebrate Little Saigon (8/26) Chinatown-ID Night Market (9/8) Fishermen s Fall Festival (9/15) Sustainable Ballard Festival (9/22) Magnolia Farmers Market (10/6) Dia de Muertos (10/27-10/28) 10

11 Station Charrettes Collaborative design sessions with agencies and community stakeholders 6/28: Ballard / Interbay 7/12: Seattle Center 7/20: Delridge 7/24: Alaska Junction / Avalon 7/30: Chinatown International District 8/2: Denny / SLU 8/28 SODO/Stadium 11
12 Neighborhood Forums / Open Houses West Seattle (Includes Delridge, Avalon and Alaska Junction stations) Downtown Seattle (Includes Denny, South Lake Union, Seattle Center, Midtown, Westlake, Chinatown-International District, Stadium and SODO stations) Ballard (Includes Smith Cove, Interbay and Ballard stations) Saturday, Sept :30 a.m. Seattle Lutheran High School Gym (4100 SW Genesee St., Seattle) Tuesday, Sept. 11 5:30 8 p.m. Ruth Fisher Boardroom, Union Station (401 S. Jackson St., Seattle) Monday, Sept. 17 5:30 8 p.m. Ballard Eagleson VFW (2812 NW Market St., Seattle) 12
13 Alternatives development overview 13
14 West Seattle project timeline PLANNING DESIGN CONSTRUCTION START OF SERVICE 2016 Alternatives development Board identifies preferred alternative Draft Environmental Impact Statement Final Environmental Impact Statement Board selects project to be built Final route design Final station designs Procure and commission station and public art Obtain land use and construction permits Conversations with property owners Groundbreaking Construction updates and mitigation Safety education Testing and pre-operations 2030 Federal Record of Decision PUBLIC INVOLVEMENT PUBLIC INVOLVEMENT PUBLIC INVOLVEMENT 14
15 Ballard project timeline PLANNING DESIGN CONSTRUCTION START OF SERVICE 2016 Alternatives development Board identifies preferred alternative Draft Environmental Impact Statement Final Environmental Impact Statement Board selects project to be built Final route design Final station designs Procure and commission station and public art Obtain land use and construction permits Conversations with property owners Groundbreaking Construction updates and mitigation Safety education Testing and pre-operations 2035 Federal Record of Decision PUBLIC INVOLVEMENT PUBLIC INVOLVEMENT PUBLIC INVOLVEMENT 15

16 PLANNING DESIG Alternatives development Board identifies preferred alternative Draft Environmental Impact Statement Final Environmental Impact Statement Board selects project to be built Federal Record of Decision PUBLIC INVOLVEMENT 16

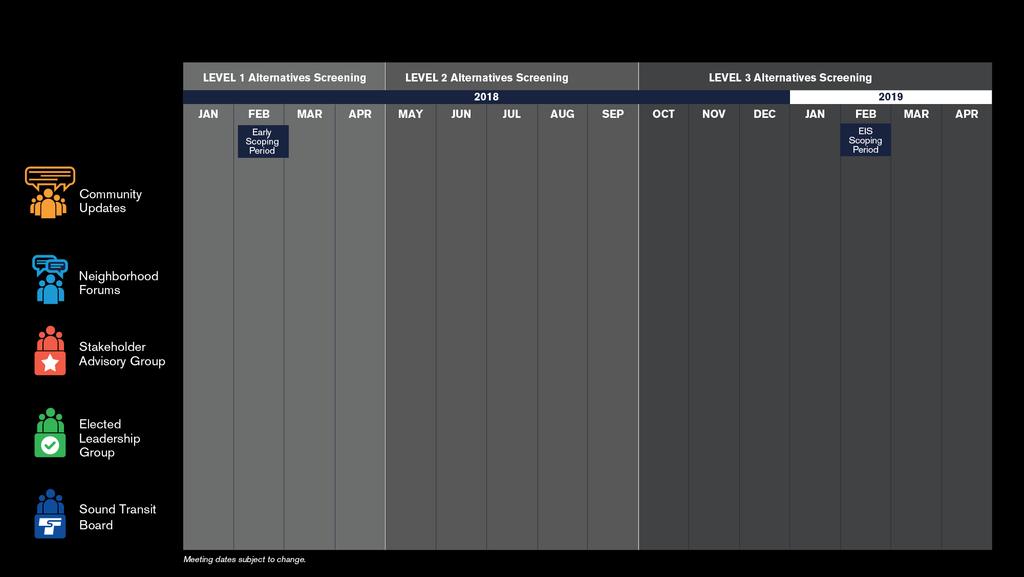
17 Alternatives development process LEVEL 1 Alternatives development LEVEL 2 Alternatives development LEVEL 3 Alternatives development PREFERRED ALTERNATIVE* Early-2018 Mid-2018 Late-2018 / Early-2019 Early-2019 Conduct early scoping Study ST3 representative project and alternatives Screen alternatives Technical analysis Refine and screen alternatives Refine and screen alternatives Conduct Environmental Impact Statement (EIS) scoping PUBLIC INVOLVEMENT PUBLIC INVOLVEMENT PUBLIC INVOLVEMENT *The Sound Transit Board identifies preferred alternatives and other alternatives to study. 17
18 Screening process Broad range of initial alternatives Refine remaining alternatives Further evaluation Preferred Alternative and other EIS alternatives 18

19 Purpose and need Purpose Statement Symbol Provide high quality rapid, reliable, and efficient peak and off-peak LRT service to communities in the project corridors as defined in ST3. Improve regional mobility by increasing connectivity and capacity through downtown Seattle to meet the projected transit demand. Connect regional centers as described in adopted regional and local land use, transportation, and economic development plans and Sound Transit s Regional Transit Long-Range Plan. Implement a system that is consistent with the ST3 Plan that established transit mode, corridor, and station locations and that is technically feasible and financially sustainable to build, operate, and maintain. Expand mobility for the corridor and region s residents, which include transit dependent, low income, and minority populations. Encourage equitable and sustainable urban growth in station areas through support of transit-oriented development, station access, and modal integration in a manner that is consistent with local land use plans and policies. Preserve and promote a healthy environment and economy by minimizing adverse impacts on the natural, built and social environments through sustainable practices. 19
20 Evaluation criteria 17 criteria consistent in all levels of evaluation Reliable service Travel times Regional connectivity Transit capacity Projected transit demand Regional centers served ST Long-Range Plan consistency ST3 consistency Technical feasibility Financial sustainability Historically underserved populations Station area local land use plan consistency Modal integration Station area development opportunities Environmental effects Traffic operations Economic effects 20


21 Measures and methods 50+ quantitative and/or qualitative measures Rating thresholds for High, Medium and Low Key differentiators and findings Lower Medium Higher 21
22 Cost assessment Purpose: To inform comparison of Level 2 alternatives Comparative costs by segment Consistent methodology (2017$; construction, real estate, etc.) Based on limited conceptual design (less than 5% design) Final project budget established at 60% design (~ 2024) Costs for end-to-end alternatives in Level 3 22
23 Financial constraints ST3 Plan budget based on 2014 conceptual cost estimates Significant recent escalation in construction and real estate costs Level 2 cost assessment provides basis for comparison of alternatives within a segment Level 3 end-to-end alternatives will facilitate comparison to ST3 budget Be mindful of financial realities when considering Level 2 recommendations 23

24 Level 2 alternatives evaluation 24

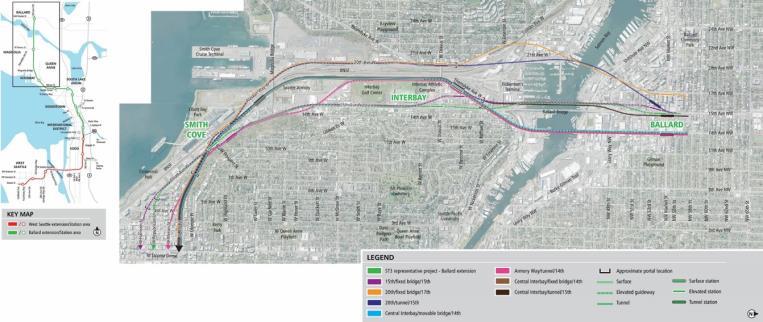
25 West Seattle/ Duwamish Interbay/Ballard SODO and Chinatown/ID Downtown Study segments 25

26 1 2 Map of alternatives Evaluation measures 3 4 Key differentiators Summary 26
27 Level 2 alternatives Interbay/Ballard ST3 Representative Project 15th/Fixed Bridge/15th 20th/Fixed Bridge/17th 20th/Tunnel/15th Armory Way/Tunnel/14th Central Interbay/Movable Bridge/14th Central Interbay/Fixed Bridge/14th Central Interbay/Tunnel/15th 27
28 Interbay/Ballard Level 2 alternatives 28
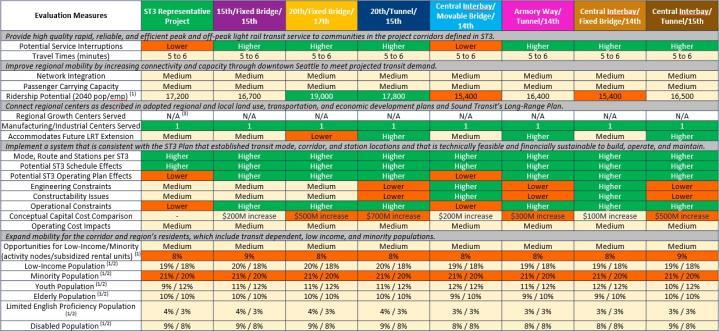
29 Evaluation Measures ST3 Representative Project 15th/Fixed Bridge/ 15th 20th/Fixed Bridge/ 17th Interbay/Ballard Level 2 alternatives evaluation Part 1 of 2 20th/Tunnel/ 15th Central Interbay/ Movable Bridge/ 14th Armory Way/ Tunnel/14th Central Interbay/ Fixed Bridge/14th Central Interbay/ Tunnel/15th Medium Medium Medium Medium Provide high quality rapid, reliable, and efficient peak and off-peak light rail transit service to communities in the project corridors defined in ST3. Potential Service Interruptions Lower Higher Higher Higher Lower Higher Higher Higher Travel Times (minutes) 5 to 6 5 to 6 5 to 6 5 to 6 5 to 6 5 to 6 5 to 6 5 to 6 Improve regional mobility by increasing connectivity and capacity through downtown Seattle to meet projected transit demand. Network Integration Medium Medium Medium Medium Medium Medium Medium Medium Passenger Carrying Capacity Medium Medium Medium Medium Medium Medium Medium Medium Ridership Potential (2040 pop/emp) (1) 17,200 16,700 19,000 17,800 15,400 16,400 15,400 16,500 Connect regional centers as described in adopted regional and local land use, transportation, and economic development plans and Sound Transit s Long-Range Plan. Regional Growth Centers Served N/A (3) N/A N/A N/A N/A N/A N/A N/A Manufacturing/Industrial Centers Served Accommodates Future LRT Extension Medium Medium Lower Higher Medium Higher Medium Higher Implement a system that is consistent with the ST3 Plan that established transit mode, corridor, and station locations and that is technically feasible and financially sustainable to build, operate, and maintain. Mode, Route and Stations per ST3 Higher Higher Higher Higher Higher Higher Higher Higher Potential ST3 Schedule Effects Higher Higher Higher Higher Higher Higher Higher Higher Potential ST3 Operating Plan Effects Lower Higher Higher Higher Lower Higher Higher Higher Engineering Constraints Medium Medium Medium Lower Higher Lower Higher Lower Constructability Issues Medium Medium Medium Lower Higher Lower Higher Lower Operational Constraints Lower Higher Higher Higher Lower Higher Higher Higher Conceptual Capital Cost Comparison - $200M increase $500M increase $700M increase $200M increase $300M increase $100M increase $500M increase Operating Cost Impacts Medium Medium Medium Medium Medium Medium Medium Medium Expand mobility for the corridor and region s residents, which include transit dependent, low income, and minority populations. Opportunities for Low-Income/Minority Medium Medium Medium Medium (activity nodes/subsidized rental units) (1) 8% 9% 8% 8% 8% 8% 8% 9% Low-Income Population (1/2) 19% / 18% 20% / 18% 20% / 18% 20% / 18% 19% / 18% 19% / 18% 19% / 18% 19% / 18% Minority Population (1/2) 21% / 20% 21% / 20% 21% / 20% 21% / 20% 21% / 20% 21% / 20% 21% / 20% 21% / 20% Youth Population (1/2) 9% / 12% 11% / 12% 11% / 12% 11% / 12% 12% / 12% 11% / 12% 12% / 12% 10% / 12% Elderly Population (1/2) 10% / 10% 10% / 10% 10% / 10% 10% / 10% 9% / 10% 9% / 10% 9% / 10% 10% / 10% Limited English Proficiency Population (1/2) 4% / 3% 4% / 3% 4% / 3% 4% / 3% 3% / 3% 3% / 3% 3% / 3% 3% / 3% Disabled Population (1/2) 9% / 8% 9% / 8% 9% / 8% 9% / 8% 8% / 8% 8% / 8% 8% / 8% 9% / 8% (1) Within station walksheds (2) Within 15 minute ride on connecting high frequency transit (3) NA = Measure not applicable to this segment Lower Medium Higher 29
30 Evaluation Measures ST3 Representative Project 15th/Fixed Bridge/ 15th 20th/Fixed Bridge/ 17th 20th/Tunnel/ 15th Central Interbay/ Movable Bridge/ 14th Interbay/Ballard Level 2 alternatives evaluation Potential Service Interruptions Armory Way/ Tunnel/14th Central Interbay/ Fixed Bridge/14th Central Interbay/ Tunnel/15th Provide high quality rapid, reliable, and efficient peak and off-peak light rail transit service to communities in the project corridors defined in ST3. Potential Service Interruptions Lower Higher Higher Higher Lower Higher Higher Higher Travel Times (minutes) 5 to 6 5 to 6 5 to 6 5 to 6 5 to 6 5 to 6 5 to 6 5 to 6 Improve regional mobility by increasing connectivity and capacity through downtown Movable Seattle bridges to meet projected have transit demand. Medium Medium Medium Medium Network Integration Medium Medium Movable bridges Medium Medium Medium Medium Medium Medium potential have potential Passenger Carrying Capacity Medium Medium Medium Medium Medium Medium Medium Medium Ridership Potential (2040 pop/emp) (1) 17,200 16,700 service interruptions 19,000 17,800 15,400 16,400 15,400 16,500 Connect regional centers as described in adopted regional and local land use, transportation, and economic development plans and Sound Transit s Long-Range Plan. Regional Growth Centers Served N/A (3) N/A N/A N/A N/A N/A N/A N/A Manufacturing/Industrial Centers Served Accommodates Future LRT Extension Medium Medium Lower Higher Medium Higher Medium Higher Implement a system that is consistent with the ST3 Plan that established transit mode, corridor, and station locations and that is technically feasible and financially sustainable to build, operate, and maintain. Mode, Route and Stations per ST3 Higher Higher Higher Higher Higher Higher Higher Higher Potential ST3 Schedule Effects Higher Higher Higher Higher Higher Higher Higher Higher Potential ST3 Operating Plan Effects Lower Higher Higher Higher Lower Higher Higher Higher Engineering Constraints Medium Medium Medium Lower Higher Lower Higher Lower Constructability Issues Medium Medium Medium Lower Higher Lower Higher Lower Operational Constraints Lower Higher Higher Higher Lower Higher Higher Higher Conceptual Capital Cost Comparison - $200M increase $500M increase $700M increase $200M increase $300M increase $100M increase $500M increase Operating Cost Impacts Medium Medium Medium Medium Medium Medium Medium Medium Expand mobility for the corridor and region s residents, which include transit dependent, low income, and minority populations. Opportunities for Low-Income/Minority Medium Medium Medium Medium (activity nodes/subsidized rental units) (1) 8% 9% 8% 8% 8% 8% 8% 9% Low-Income Population (1/2) 19% / 18% 20% / 18% 20% / 18% 20% / 18% 19% / 18% 19% / 18% 19% / 18% 19% / 18% Minority Population (1/2) 21% / 20% 21% / 20% 21% / 20% 21% / 20% 21% / 20% 21% / 20% 21% / 20% 21% / 20% Youth Population (1/2) 9% / 12% 11% / 12% 11% / 12% 11% / 12% 12% / 12% 11% / 12% 12% / 12% 10% / 12% Elderly Population (1/2) 10% / 10% 10% / 10% 10% / 10% 10% / 10% 9% / 10% 9% / 10% 9% / 10% 10% / 10% Limited English Proficiency Population (1/2) 4% / 3% 4% / 3% 4% / 3% 4% / 3% 3% / 3% 3% / 3% 3% / 3% 3% / 3% Disabled Population (1/2) 9% / 8% 9% / 8% 9% / 8% 9% / 8% 8% / 8% 8% / 8% 8% / 8% 9% / 8% (1) Within station walksheds (2) Within 15 minute ride on connecting high frequency transit (3) NA = Measure not applicable to this segment Lower Medium Higher = Key Differentiators 30
31 Evaluation Measures ST3 Representative Project 15th/Fixed Bridge/ 15th 20th/Fixed Bridge/ 17th 20th/Tunnel/ 15th Central Interbay/ Movable Bridge/ 14th Armory Way/ Tunnel/14th Central Interbay/ Fixed Bridge/14th Interbay/Ballard Level 2 alternatives evaluation Engineering Constraints, Constructability Issues Central Interbay/ Tunnel/15th Provide high quality rapid, reliable, and efficient peak and off-peak light rail transit service to communities in the project corridors defined in ST3. Potential Service Interruptions Lower Higher Higher Higher Lower Higher Higher Higher Travel Times (minutes) 5 to 6 5 to 6 5 to 6 5 to 6 5 to 6 5 to 6 5 to 6 5 to 6 Improve regional mobility by increasing connectivity and capacity through downtown Seattle to meet projected transit demand. Network Integration Medium Medium Medium Medium Medium Medium Medium Medium Passenger Carrying Capacity Medium Medium Medium Medium Medium Medium Medium Medium Medium Medium Medium Medium Ridership Potential (2040 pop/emp) (1) 17,200 16,700 19,000 Long spans (over 17,800 BNSF 15,400 16,400 15,400 16,500 Connect regional centers as described in adopted regional and local land use, transportation, tracks), and economic constrained development tunnel plans and Sound Transit s At Long-Range Plan. grade sections sectons Regional Growth Centers Served N/A (3) N/A portal N/A location, deeper N/A tunnel N/A N/A N/A N/A Manufacturing/Industrial Centers Served lessen complexity Accommodates Future LRT Extension Medium Medium Lower station add complexity Higher Medium Higher Medium Higher Implement a system that is consistent with the ST3 Plan that established transit mode, corridor, and station locations and that is technically feasible and financially sustainable to build, operate, and maintain. Mode, Route and Stations per ST3 Higher Higher Higher Higher Higher Higher Higher Higher Potential ST3 Schedule Effects Higher Higher Higher Higher Higher Higher Higher Higher Potential ST3 Operating Plan Effects Lower Higher Higher Higher Lower Higher Higher Higher Engineering Constraints Medium Medium Medium Lower Higher Lower Higher Lower Constructability Issues Medium Medium Medium Lower Higher Lower Higher Lower Operational Constraints Lower Higher Higher Higher Lower Higher Higher Higher Conceptual Capital Cost Comparison - $200M increase $500M increase $700M increase $200M increase $300M increase $100M increase $500M increase Operating Cost Impacts Medium Medium Medium Medium Medium Medium Medium Medium Expand mobility for the corridor and region s residents, which include transit dependent, low income, and minority populations. Opportunities for Low-Income/Minority Medium Medium Medium Medium (activity nodes/subsidized rental units) (1) 8% 9% 8% 8% 8% 8% 8% 9% Low-Income Population (1/2) 19% / 18% 20% / 18% 20% / 18% 20% / 18% 19% / 18% 19% / 18% 19% / 18% 19% / 18% Minority Population (1/2) 21% / 20% 21% / 20% 21% / 20% 21% / 20% 21% / 20% 21% / 20% 21% / 20% 21% / 20% Youth Population (1/2) 9% / 12% 11% / 12% 11% / 12% 11% / 12% 12% / 12% 11% / 12% 12% / 12% 10% / 12% Elderly Population (1/2) 10% / 10% 10% / 10% 10% / 10% 10% / 10% 9% / 10% 9% / 10% 9% / 10% 10% / 10% Limited English Proficiency Population (1/2) 4% / 3% 4% / 3% 4% / 3% 4% / 3% 3% / 3% 3% / 3% 3% / 3% 3% / 3% Disabled Population (1/2) 9% / 8% 9% / 8% 9% / 8% 9% / 8% 8% / 8% 8% / 8% 8% / 8% 9% / 8% (1) Within station walksheds (2) Within 15 minute ride on connecting high frequency transit (3) NA = Measure not applicable to this segment Lower Medium Higher = Key Differentiators 31
32 Evaluation Measures ST3 Representative Project 15th/Fixed Bridge/ 15th 20th/Fixed Bridge/ 17th 20th/Tunnel/ 15th Central Interbay/ Movable Bridge/ 14th Armory Way/ Tunnel/14th Interbay/Ballard Level 2 alternatives evaluation Conceptual Capital Cost Comparison Central Interbay/ Fixed Bridge/14th Central Interbay/ Tunnel/15th Provide high quality rapid, reliable, and efficient peak and off-peak light rail transit service to communities in the project corridors defined in ST3. Potential Service Interruptions Lower Higher Higher Higher Lower Higher Higher Higher Travel Times (minutes) 5 to 6 5 to 6 5 to 6 5 to 6 5 to 6 5 to 6 5 to 6 5 to 6 Improve regional mobility by increasing connectivity and capacity through downtown Seattle to meet projected transit demand. Network Integration Medium Medium Medium Medium Medium Medium Medium Medium Passenger Carrying Capacity Medium Medium Medium Medium Medium Medium Medium Medium Ridership Potential (2040 pop/emp) (1) 17,200 16,700 19,000 17,800 15,400 16,400 15,400 16,500 Connect regional centers as described in adopted regional and local land use, transportation, and economic development plans and Sound Transit s Long-Range Plan. Regional Growth Centers Served N/A (3) N/A N/A N/A N/A N/A N/A N/A Manufacturing/Industrial Centers Served Accommodates Future LRT Extension Medium Medium Lower Higher Medium Higher Medium Higher Implement a system that is consistent with the ST3 Plan that established transit mode, corridor, and station locations and that is technically feasible and financially sustainable to build, operate, and maintain. Mode, Route and Stations per ST3 Higher Higher Higher Higher Higher Higher Higher Higher Highest cost Lowest cost Potential ST3 Schedule Effects Higher Higher Higher Higher Higher Higher Higher Higher Potential ST3 Operating Plan Effects Lower Higher Higher alternative tunnel alternative Higher Lower Higher Higher Higher Engineering Constraints Medium Medium Medium Lower Higher Lower Higher Lower Constructability Issues Medium Medium Medium Lower Higher Lower Higher Lower Operational Constraints Lower Higher Higher Higher Lower Higher Higher Higher Conceptual Capital Cost Comparison - $200M increase $500M increase $700M increase $200M increase $300M increase $100M increase $500M increase Operating Cost Impacts Medium Medium Medium Medium Medium Medium Medium Medium Expand mobility for the corridor and region s residents, which include transit dependent, low income, and minority populations. Medium Medium Medium Medium Medium Medium Medium Opportunities for Low-Income/Minority Requires Includes Mediumtunnel; (activity nodes/subsidized rental units) (1) 8% 9% 8% 8% 8% requires may require 8% 3 rd Party 3 rd 8% 9% Low-Income Population (1/2) 19% / 18% 20% / 18% 20% / 18% 20% / 18% 19% / 18% 19% / 18% 19% / 18% 19% / 18% party funding funding Minority Population (1/2) 21% / 20% 21% / 20% 21% / 20% 21% / 20% 21% / 20% 21% / 20% 21% / 20% 21% / 20% Youth Population (1/2) 9% / 12% 11% / 12% 11% / 12% 11% / 12% 12% / 12% 11% / 12% 12% / 12% 10% / 12% Elderly Population (1/2) 10% / 10% 10% / 10% 10% / 10% 10% / 10% 9% / 10% 9% / 10% 9% / 10% 10% / 10% Limited English Proficiency Population (1/2) 4% / 3% 4% / 3% 4% / 3% 4% / 3% 3% / 3% 3% / 3% 3% / 3% 3% / 3% Disabled Population (1/2) 9% / 8% 9% / 8% 9% / 8% 9% / 8% 8% / 8% 8% / 8% 8% / 8% 9% / 8% (1) Within station walksheds (2) Within 15 minute ride on connecting high frequency transit (3) NA = Measure not applicable to this segment Lower Medium Higher = Key Differentiators 32
33 Evaluation Measures ST3 Representative Project 15th/Fixed Bridge/ 15th 20th/Fixed Bridge/ 17th 20th/Tunnel/ 15th Central Interbay/ Movable Bridge/ 14th Armory Way/ Tunnel/14th Central Interbay/ Fixed Bridge/14th Central Interbay/ Tunnel/15th Encourage equitable and sustainable urban growth in station areas through support of transit-oriented development, station access, and modal integration in a manner that is consistent with local land use plans and policies. Compatibility with Urban Centers/Villages (1) Medium Medium Medium Medium Lower Lower Lower Medium Station Land Use Plan Consistency Medium Medium Medium Medium Medium Medium Medium Medium Activity Nodes Served (1) Passenger Transfers Medium Medium Medium Medium Medium Medium Medium Medium Bus/Rail and Rail/Rail Integration (1) Higher Medium Medium Higher Higher Higher Higher Higher Bicycle Accessibility (1) Higher Higher Higher Higher Medium Higher Medium Higher Pedestrian/Limited Mobility Accessibility (1) Lower Medium Higher Higher Lower Medium Lower Medium Development Potential (1) Medium Medium Higher Medium Medium Medium Medium Medium Equitable Development Opportunities Lower Higher Lower Lower Medium Medium Medium Higher Preserve and promote a healthy environment and economy by minimizing adverse impacts on the natural, built and social environments through sustainable practices. Historic Properties/Landmarks (2) Potential for Effects to Archaeological Resources (1) Lower Lower Lower Lower Lower Lower Lower Lower Parks and Recreational Resources Effects (acres) Water Resource Effects (acres) Fish and Wildlife Habitat Effects (acres) Hazardous Material Sites (2) Visual Effects Medium Medium Medium Higher Medium Medium Medium Medium Noise and Vibration Sensitive Receivers (1) Higher Higher Lower Medium Higher Higher Higher Higher Potentially Affected Properties Medium Lower Lower Higher Higher Higher Higher Higher Residential Unit Displacements Higher Lower Lower Medium Medium Higher Medium Higher Square Feet of Business Displacements Medium Medium Medium Higher Medium Higher Medium Lower Construction Impacts Lower Medium Lower Medium Higher Higher Higher Medium Burden on Low-Income/Minority Higher Higher Higher Higher Higher Higher Higher Higher Traffic Circulation and Access Effects Lower Medium Medium Higher Medium Higher Medium Higher Effects on Existing Transportation Facilities Medium Higher Lower Medium Medium Higher Medium Medium Effects on Freight Movement Lower Medium Medium Medium Medium Higher Medium Higher Business and Commerce Effects Lower Lower Medium Higher Medium Higher Medium Medium (1) Within station walksheds and/or defined buffer of alignment (2) On properties that overlap with the project footprint Lower Interbay/Ballard Level 2 alternatives evaluation Part 2 of 2 Medium Higher 33
34 Evaluation Measures ST3 Representative Project 15th/Fixed Bridge/ 15th 20th/Fixed Bridge/ 17th 20th/Tunnel/ 15th Central Interbay/ Movable Bridge/ 14th Armory Way/ Tunnel/14th Central Interbay/ Fixed Bridge/14th Central Interbay/ Tunnel/15th Encourage equitable and sustainable urban growth in station areas through support of transit-oriented development, station access, and modal integration in a manner that is consistent with local land use plans and policies. Compatibility with Urban Centers/Villages (1) Medium Medium Medium Medium Lower Lower Lower Medium Station Land Use Plan Consistency Medium Medium Medium Medium Medium Medium Medium Medium Activity Nodes Served (1) Passenger Transfers Medium Medium Medium Medium Medium Medium Medium Medium Bus/Rail and Rail/Rail Integration (1) Higher Medium Medium Higher Higher Higher Higher Higher Bicycle Accessibility (1) Higher Higher Higher Higher Medium Farther from Highercenter Medium Higher Pedestrian/Limited Mobility Accessibility (1) Lower Medium Higher Higher Lower of Urban Medium Village Lower Medium Development Potential (1) Medium Medium Higher Medium Medium Medium Medium Medium Equitable Development Opportunities Lower Higher Lower Lower Medium Medium Medium Higher Preserve and promote a healthy environment and economy by minimizing adverse impacts on the natural, built and social environments through sustainable practices. Historic Properties/Landmarks (2) Potential for Effects to Archaeological Resources (1) Lower Lower Lower Lower Lower Lower Lower Lower Parks and Recreational Resources Effects (acres) Water Resource Effects (acres) Fish and Wildlife Habitat Effects (acres) Hazardous Material Sites (2) Visual Effects Medium Medium Medium Higher Medium Medium Medium Medium Noise and Vibration Sensitive Receivers (1) Higher Higher Lower Medium Higher Higher Higher Higher Potentially Affected Properties Medium Lower Lower Higher Higher Higher Higher Higher Residential Unit Displacements Higher Lower Lower Medium Medium Higher Medium Higher Square Feet of Business Displacements Medium Medium Medium Higher Medium Higher Medium Lower Construction Impacts Lower Medium Lower Medium Higher Higher Higher Medium Burden on Low-Income/Minority Higher Higher Higher Higher Higher Higher Higher Higher Traffic Circulation and Access Effects Lower Medium Medium Higher Medium Higher Medium Higher Effects on Existing Transportation Facilities Medium Higher Lower Medium Medium Higher Medium Medium Effects on Freight Movement Lower Medium Medium Medium Medium Higher Medium Higher Business and Commerce Effects Lower Lower Medium Higher Medium Higher Medium Medium (1) Within station walksheds and/or defined buffer of alignment (2) On properties that overlap with the project footprint Lower Medium Higher Interbay/Ballard Level 2 alternatives evaluation Compatibility with Urban Centers/Villages = Key Differentiators 34
35 Evaluation Measures ST3 Representative Project 15th/Fixed Bridge/ 15th 20th/Fixed Bridge/ 17th 20th/Tunnel/ 15th Central Interbay/ Movable Bridge/ 14th Armory Way/ Tunnel/14th Central Interbay/ Fixed Bridge/14th Central Interbay/ Tunnel/15th Encourage equitable and sustainable urban growth in station areas through support of transit-oriented development, station access, and modal integration in a manner that is consistent with local land use plans and policies. Compatibility with Urban Centers/Villages (1) Medium Medium Medium Medium Lower Lower Lower Medium Station Land Use Plan Consistency Medium Medium Medium Medium Medium Medium Medium Medium Activity Nodes Served (1) Passenger Transfers Medium Medium Medium Medium Medium Medium Medium Medium Bus/Rail and Rail/Rail Integration (1) Higher Medium Medium Higher Higher Higher Higher Higher Bicycle Accessibility (1) Higher Higher Higher Higher Medium Higher Medium Higher Pedestrian/Limited Mobility Accessibility (1) Lower Medium Higher Higher Lower Medium Lower Medium Development Potential (1) Medium Bridge columns Medium Higher Medium Medium Medium Medium Medium Equitable Development Opportunities Lower Higher Lower Lower Medium Bridge Medium columns in waterway Preserve and promote a healthy environment and economy by minimizing adverse impacts on the natural, built and social environments through sustainable practices. waterway Medium Higher Historic Properties/Landmarks (2) Potential for Effects to Archaeological Resources (1) Lower Lower Lower Lower Lower Lower Lower Lower Parks and Recreational Resources Effects (acres) Water Resource Effects (acres) Fish and Wildlife Habitat Effects (acres) Hazardous Material Sites (2) Visual Effects Medium Medium Medium Higher Medium Medium Medium Medium Noise and Vibration Sensitive Receivers (1) Higher Higher Lower Medium Higher Higher Higher Higher Potentially Affected Properties Medium Lower Lower Higher Higher Higher Higher Higher Residential Unit Displacements Higher Lower Lower Medium Medium Higher Medium Higher Square Feet of Business Displacements Medium Medium Medium Higher Medium Higher Medium Lower Construction Impacts Lower Medium Lower Medium Higher Higher Higher Medium Burden on Low-Income/Minority Higher Higher Higher Higher Higher Higher Higher Higher Traffic Circulation and Access Effects Lower Medium Medium Higher Medium Higher Medium Higher Effects on Existing Transportation Facilities Medium Higher Lower Medium Medium Higher Medium Medium Effects on Freight Movement Lower Medium Medium Medium Medium Higher Medium Higher Business and Commerce Effects Lower Lower Medium Higher Medium Higher Medium Medium (1) Within station walksheds and/or defined buffer of alignment (2) On properties that overlap with the project footprint Lower Medium Higher Interbay/Ballard Level 2 alternatives evaluation Water Resource Effects = Key Differentiators 35
36 Evaluation Measures ST3 Representative Project 15th/Fixed Bridge/ 15th 20th/Fixed Bridge/ 17th 20th/Tunnel/ 15th Central Interbay/ Movable Bridge/ 14th Armory Way/ Tunnel/14th Central Interbay/ Fixed Bridge/14th Central Interbay/ Tunnel/15th Encourage equitable and sustainable urban growth in station areas through support of transit-oriented development, station access, and modal integration in a manner that is consistent with local land use plans and policies. Compatibility with Urban Centers/Villages (1) Medium Medium Medium Medium Lower Lower Lower Medium Station Land Use Plan Consistency Medium Medium Medium Medium Medium Medium Medium Medium Activity Nodes Served (1) Passenger Transfers Medium Medium Medium Medium Medium Medium Medium Medium Bus/Rail and Rail/Rail Integration (1) Higher Medium Medium Higher Higher Higher Higher Higher Bicycle Accessibility (1) Higher Higher Higher Higher Medium Higher Medium Higher Pedestrian/Limited Mobility Accessibility (1) Lower Medium Higher Higher Lower Medium Lower Medium Development Potential (1) Medium Medium Higher Medium Medium Medium Medium Medium Equitable Development Opportunities Lower Higher Lower Lower Medium Medium Medium Higher Preserve and promote a healthy environment and economy by minimizing adverse impacts on the natural, built and social environments through sustainable practices. Historic Properties/Landmarks (2) Potential for Effects to Archaeological Resources (1) Lower Elevated guideway Lower Lower Ballard terminus/ Lower water Lower Lower Lower Lower Parks and Recreational Resources Effects (acres) 0.2 (west side 15 th ) 1 0.9crossing location 0.9 affects Water Resource Effects (acres) affects 0.7 more parcels more residences Fish and Wildlife Habitat Effects (acres) Hazardous Material Sites (2) Visual Effects Medium Medium Medium Higher Medium Medium Medium Medium Noise and Vibration Sensitive Receivers (1) Higher Higher Lower Medium Higher Higher Higher Higher Potentially Affected Properties Medium Lower Lower Higher Higher Higher Higher Higher Residential Unit Displacements Higher Lower Lower Medium Medium Higher Medium Higher Square Feet of Business Displacements Medium Medium Medium Higher Medium Higher Medium Lower Construction Impacts Lower Medium Lower Medium Higher Higher Higher Medium Burden on Low-Income/Minority Higher Higher Higher Higher Higher Higher Higher Higher Traffic Circulation and Access Effects Lower Medium Medium Higher Medium Higher Medium Higher Effects on Existing Transportation Facilities Medium Higher Lower Medium Medium Higher Medium Medium Effects on Freight Movement Lower Medium Medium Medium Medium Higher Medium Higher Business and Commerce Effects Lower Lower Medium Higher Medium Higher Medium Medium (1) Within station walksheds and/or defined buffer of alignment (2) On properties that overlap with the project footprint Lower Medium Higher Interbay/Ballard Level 2 alternatives evaluation Potentially Affected Properties = Key Differentiators 36
37 Evaluation Measures ST3 Representative Project 15th/Fixed Bridge/ 15th 20th/Fixed Bridge/ 17th 20th/Tunnel/ 15th Central Interbay/ Movable Bridge/ 14th Armory Way/ Tunnel/14th Central Interbay/ Fixed Bridge/14th Central Interbay/ Tunnel/15th Encourage equitable and sustainable urban growth in station areas through support of transit-oriented development, station access, and modal integration in a manner that is consistent with local land use plans and policies. Compatibility with Urban Centers/Villages (1) Medium Medium Medium Medium Lower Lower Lower Medium Station Land Use Plan Consistency Medium Medium Medium Medium Medium Medium Medium Medium Activity Nodes Served (1) Passenger Transfers Medium Medium Medium Medium Medium Medium Medium Medium Bus/Rail and Rail/Rail Integration (1) Higher Medium Medium Higher Higher Higher Higher Higher Bicycle Accessibility (1) Higher Higher Higher Higher Medium Higher Medium Higher Pedestrian/Limited Mobility Accessibility (1) Lower Medium Higher Higher Lower Medium Lower Medium Development Potential (1) Medium Medium Higher Medium Medium Medium Medium Medium Equitable Development Opportunities Lower Higher Lower Lower Medium Medium Medium Higher Preserve and promote a healthy environment and economy by minimizing adverse impacts on the natural, built and social environments through sustainable practices. Historic Properties/Landmarks (2) Potential for Effects to Archaeological Resources (1) Lower Lower Lower Lower Lower Lower Lower Lower Parks and Recreational Resources Effects (acres) Water Resource Effects (acres) Fish and Wildlife Habitat Effects (acres) Hazardous Material Sites (2) Visual Effects Medium Medium Medium Higher Medium Medium Medium Medium Noise and Vibration Sensitive Receivers (1) Higher Higher Lower Medium Higher Higher Higher Higher Potentially Affected Properties Medium Lower More effect on Lower traffic, Higher Higher Higher Higher Higher Residential Unit Displacements Higher Lower Lower Medium Medium Higher Medium Higher freight and navigation Square Feet of Business Displacements Medium Medium Medium Higher Medium Higher Medium Lower Construction Impacts Lower Medium Lower Medium Higher Higher Higher Medium Burden on Low-Income/Minority Higher Higher Higher Higher Higher Higher Higher Higher Traffic Circulation and Access Effects Lower Medium Medium Higher Medium Higher Medium Higher Effects on Existing Transportation Facilities Medium Higher Lower Medium Medium Higher Medium Medium Effects on Freight Movement Lower Medium Medium Medium Medium Higher Medium Higher Business and Commerce Effects Lower Lower Medium Higher Medium Higher Medium Medium (1) Within station walksheds and/or defined buffer of alignment (2) On properties that overlap with the project footprint Lower Medium Higher Interbay/Ballard Level 2 alternatives evaluation Traffic Circulation and Access, Freight Movement = Key Differentiators 37
38 Evaluation Measures ST3 Representative Project 15th/Fixed Bridge/ 15th 20th/Fixed Bridge/ 17th 20th/Tunnel/ 15th Central Interbay/ Movable Bridge/ 14th Armory Way/ Tunnel/14th Central Interbay/ Fixed Bridge/14th Central Interbay/ Tunnel/15th Encourage equitable and sustainable urban growth in station areas through support of transit-oriented development, station access, and modal integration in a manner that is consistent with local land use plans and policies. Compatibility with Urban Centers/Villages (1) Medium Medium Medium Medium Lower Lower Lower Medium Station Land Use Plan Consistency Medium Medium Medium Medium Medium Medium Medium Medium Activity Nodes Served (1) Passenger Transfers Medium Medium Medium Medium Medium Medium Medium Medium Bus/Rail and Rail/Rail Integration (1) Higher Medium Medium Higher Higher Higher Higher Higher Bicycle Accessibility (1) Higher Higher Higher Higher Medium Higher Medium Higher Pedestrian/Limited Mobility Accessibility (1) Lower Medium Higher Higher Lower Medium Lower Medium Development Potential (1) Medium Medium Higher Medium Medium Medium Medium Medium Equitable Development Opportunities Lower Higher Lower Lower Medium Medium Medium Higher Preserve and promote a healthy environment and economy by minimizing adverse impacts on the natural, built and social environments through sustainable practices. Historic Properties/Landmarks (2) Potential for Effects to Archaeological Resources (1) Lower Lower Lower Lower Lower Lower Lower Lower Parks and Recreational Resources Effects (acres) Water Resource Effects (acres) Fish and Wildlife Habitat Effects (acres) Hazardous Material Sites (2) Visual Effects Medium Medium Medium Higher Medium Medium Medium Medium Noise and Vibration Sensitive Receivers (1) Higher Higher Lower Medium Higher Higher Higher Higher Potentially Affected Properties Medium Lower Lower Higher Higher Higher Higher Higher Residential Unit Displacements Higher Lower Lower Medium Medium Higher Medium Higher Square Feet of Business Displacements Medium More business, Medium Medium Higher Medium Higher Medium Lower Construction Impacts Lower commerce effects Tunnels; Less less business, business, Medium Lower Medium Higher Higher Higher Medium Burden on Low-Income/Minority Higher Higher Higher Higher Higher commerce Higher effects Higher Higher Traffic Circulation and Access Effects Lower Medium Medium Higher Medium Higher Medium Higher Effects on Existing Transportation Facilities Medium Higher Lower Medium Medium Higher Medium Medium Effects on Freight Movement Lower Medium Medium Medium Medium Higher Medium Higher Business and Commerce Effects Lower Lower Medium Higher Medium Higher Medium Medium (1) Within station walksheds and/or defined buffer of alignment (2) On properties that overlap with the project footprint Lower Medium Higher Interbay/Ballard Level 2 alternatives evaluation Business and Commerce Effects = Key Differentiators 38


39 Smith Cove-Interbay Salmon Bay Crossing Ballard Terminus Interbay/Ballard Key differentiators By sub-segment 39


40 Smith Cove-Interbay: Key differentiators Station location Traffic Engineering constraints Interbay/Ballard Key differentiators Smith Cove-Interbay 40
41 Key differentiators Smith Cove-Interbay Alternative ST3 Representative Project Key differentiators 15 th /Fixed Bridge/15 th Lessens traffic/freight effects (avoids 15 th Ave median) 20 th /Fixed Bridge/17 th Lessens traffic/freight effects (avoids 15 th Ave) Long span bridge (over BNSF tracks) adds complexity 20 th /Tunnel/15 th Central Interbay/ Movable Bridge/14 th Armory Way/ Tunnel/14 th Central Interbay/ Fixed Bridge/14 th Central Interbay/ Tunnel/15 th Lessens traffic/freight effects (avoids 15 th Ave) At-grade sections (along BNSF tracks) lessen complexity 41

42 Salmon Bay Crossing: Key differentiators Crossing location Crossing type Bridge (fixed or movable) Tunnel Freight movement Business/commerce effects Interbay/Ballard Key differentiators Salmon Bay Crossing 42
43 Key differentiators Salmon Bay Crossing Alternative ST3 Representative Project Key differentiators 15 th /Fixed Bridge/15 th Fewer columns in water than movable bridge Maritime business effects (Fishermen s Terminal) 20 th /Fixed Bridge/17 th Long-span fixed bridge avoids columns in water 20 th /Tunnel/15 th Longer tunnel, more constrained portal Includes tunnel; requires 3 rd Party funding Central Interbay/ Movable Bridge/14 th Armory Way/ Tunnel/14 th Central Interbay/ Fixed Bridge/14 th Central Interbay/ Tunnel/15 th Potential service interruptions Maritime business and potential vessel navigation effects Shorter tunnel, less constrained portal Includes tunnel; requires 3 rd Party funding Fewer columns in water than movable bridge Maritime business effects Shorter tunnel, less constrained portal Includes tunnel; requires 3 rd Party funding 43

44 Ballard Terminus: Key differentiators Ballard Station location Elevated or tunnel Interbay/Ballard Key differentiators Ballard Terminus 44
45 Key differentiators Ballard Terminus Alternative ST3 Representative Project Key differentiators 15 th /Fixed Bridge/15 th Elevated guideway (west side 15 th Ave NW) affects more parcels More residential displacements 20 th /Fixed Bridge/17 th Ballard terminus/crossing location affects more residences Closer to center of Urban Village 20 th /Tunnel/15 th Tunnel station (west side 15 th Ave NW) affects residences Deeper tunnel station (~120 ); adds complexity Central Interbay/ Movable Bridge/14 th Armory Way/ Tunnel/14 th Central Interbay/ Fixed Bridge/14 th Affects fewer parcels (along 14 th Ave NW) Farther from center of Urban Village Shallower tunnel station (~70 ) Central Interbay/ Tunnel/15 th Tunnel station (east side 15 th Ave NW) affects businesses Shallower tunnel station (~80 ) 45
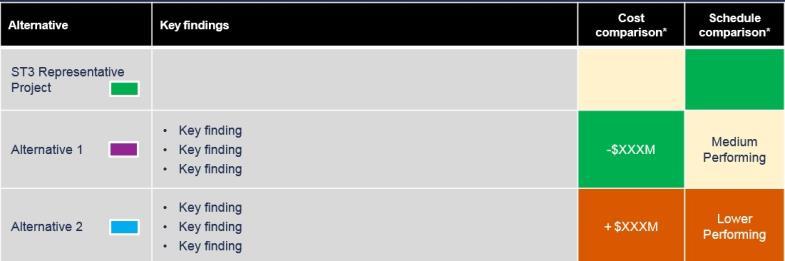
46 Summary Interbay/Ballard Alternative ST3 Representative Project Key findings Central Interbay/ Maritime business effects (but less than movable bridge) Fixed Bridge/14 th Affects fewer parcels in Ballard (along 14 th Ave NW) Potential service interruptions Central Interbay/ Movable Bridge/14 th Maritime business and potential vessel navigation effects Affects fewer parcels in Ballard (along 14 th Ave NW) 15 th /Fixed Bridge/15 th Maritime business effects (Fishermen s Terminal) Elevated guideway (west side 15 th Ave NW) affects more residences Less environmental, maritime business/navigation effects Armory Way/ Tunnel/14 th Affects fewer parcels in Ballard (along 14 th Ave NW) Includes tunnel; requires 3 rd Party funding Less environmental, maritime business/navigation effects Central Interbay/ Tunnel/15 th Tunnel station (east side 15 th Ave NW) affects businesses Includes tunnel; requires 3 rd Party funding 20 th /Fixed Bridge/17 th Long span bridge (over BNSF tracks) adds complexity Ballard terminus/crossing location affects more residences Long span bridge (over BNSF tracks), constrained tunnel portal location, 20 th /Tunnel/15 th deeper tunnel station add complexity Tunnel station (west side 15 th Ave NW) affects residences Includes tunnel; requires 3 rd Party funding Cost comparison* + $100M + $200M + $200M + $300M + $500M + $500M + $700M Schedule Comparison** Higher Higher Higher Higher Higher Higher Higher *Cost compared to cost of ST3 Representative Project for this segment. Schedule compared to overall ST3 schedule for this extension. 46
47 * Station Charrette Feedback Ballard Station 17 th Ave NW Elevated Good location to serve historic center of Ballard and Swedish Medical Center Concern about potential construction effects on neighborhood Concern about compatibility of elevated station with neighborhood Challenging for transit integration and circulation (fire station operations) Good non-motorized access Some TOD potential Blah 15 th Ave NW Elevated or Tunnel Moving station out of ROW reduces freight conflicts Concern about compatibility of elevated station with neighborhood Close to an area with good development potential Excellent transit integration and circulation Good non-motorized access Considerable TOD potential (tunnel) Some TOD potential (elevated) 14 th Ave NW Elevated or Tunnel Location farthest from historic center of Ballard, but still in the urban village Most compatible elevated option, with large available ROW and potential for reconstructing 14 th as a more fullservice street On the path of future growth, though much of station area is zoned industrial Good transit integration and circulation Good non-motorized access Considerable TOD potential *Summary of feedback from agency and community stakeholders. Images are illustrative only. 47
48 * Station Charrette Feedback Interbay Station 20 th Ave W At Grade or Elevated Good location to serve Magnolia Not much zoned development capacity in the station area Challenging for transit integration, requiring long deviations Good non-motorized access to existing facilities Limited TOD potential 17 th Ave W At Grade or Elevated Best serves emerging Interbay Triangle neighborhood Good transit integration Challenging for nonmotorized access from east, but opportunities for substantial enhancements Considerable TOD potential 16 th Ave W Elevated Not developed further in charrette Concerns about station compatibility with emerging neighborhood fabric Challenging for transit integration Challenging for nonmotorized access Some TOD potential 15 th Ave W Elevated Not developed further in charrette Concerns about potential effects to freight and general mobility on 15 th Ave W corridor during construction Good transit integration Challenging for nonmotorized access Limited TOD potential *Summary of feedback from agency and community stakeholders. Images are illustrative only. 48
49 Level 2 alternatives Downtown ST3 Representative Project 5th/Harrison 6th/Boren/Roy 5th/Terry/Roy/Mercer 49
50 Downtown Level 2 alternatives 50
51 Evaluation Measures ST3 Representative Project 5th/Harrison 6th/Boren/Roy 5th/Terry/Roy/Mercer Provide high quality rapid, reliable, and efficient peak and off-peak light rail transit service to communities in the project corridors defined in ST3. Potential Service Interruptions Higher Higher Higher Higher Travel Times (minutes) 8 to 9 8 to 9 8 to 9 8 to 9 Improve regional mobility by increasing connectivity and capacity through downtown Seattle to meet projected transit demand. Network Integration Medium Medium Medium Medium Passenger Carrying Capacity Medium Medium Medium Medium Ridership Potential (2040 pop/emp) (1) 167, , , ,700 Connect regional centers as described in adopted regional and local land use, transportation, and economic development plans and Sound Transit s Long-Range Plan. Regional Growth Centers Served Manufacturing/Industrial Centers Served N/A (3) N/A N/A N/A Accommodates Future LRT Extension Medium Medium Medium Medium Implement a system that is consistent with the ST3 Plan that established transit mode, corridor, and station locations and that is technically feasible and financially sustainable to build, operate, and maintain. Medium Medium Mode, Route and Stations per ST3 Higher Higher Higher Higher Potential ST3 Schedule Effects Higher Higher Higher Higher Potential ST3 Operating Plan Effects Higher Higher Higher Higher Engineering Constraints Lower Lower Medium Lower Constructability Issues Lower Lower Lower Lower Operational Constraints Medium Medium Higher Medium Conceptual Capital Cost Comparison --- $200M increase Similar $200M increase Operating Cost Impacts Medium Medium Medium Medium Expand mobility for the corridor and region s residents, which include transit dependent, low income, and minority populations. Opportunities for Low-Income/Minority Medium Medium (activity nodes/subsidized rental units) (1) 27% 29% 24% 26% Low-Income Population (1/2) 28% / 30% 29% / 30% 28% / 30% 28% / 30% Minority Population (1/2) 36% / 36% 36% / 36% 34% / 36% 35% / 36% Youth Population (1/2) 4% / 4% 4% / 4% 4% / 4% 4% / 4% Elderly Population (1/2) 14% / 13% 14% / 13% 15% / 13% 14% / 13% Limited English Proficiency Population (1/2) 5% / 5% 5% / 5% 5% / 5% 5% / 5% Disabled Population (1/2) 12% / 12% 12% / 12% 12% / 12% 12% / 12% (1) Within station walksheds (2) Within 15 minute ride on connecting high frequency transit (3) NA = Measure not applicable to this segment Downtown Level 2 alternatives evaluation Part 1 of 2 Lower Medium Higher 51
52 Evaluation Measures ST3 Representative Project 5th/Harrison 6th/Boren/Roy 5th/Terry/Roy/Mercer Medium Medium Provide high quality rapid, reliable, and efficient peak and off-peak light rail transit service to communities in the project corridors defined in ST3. Potential Service Interruptions Higher Higher Higher Higher Travel Times (minutes) 8 to 9 8 to 9 8 to 9 8 to 9 Improve regional mobility by increasing connectivity and capacity through downtown Seattle to meet projected transit demand. Network Integration Medium Medium Medium Medium Passenger Carrying Capacity Medium Medium Medium Medium Ridership Potential (2040 pop/emp) (1) 167, , , ,700 Connect regional centers as described in adopted regional and local land use, transportation, and economic development plans and Sound Transit s Long-Range Plan. Regional Growth Centers Served Avoids building foundation Manufacturing/Industrial Centers Served N/A (3) N/A N/A N/A Engineering Accommodates Future LRT Extension Medium Medium tie-backs Medium on 5 th Ave but Medium challenges with more constrained Denny Implement a system that is consistent with the ST3 Plan that established transit mode, corridor, and station locations and that is technically feasible and financially sustainable to build, operate, and maintain. tunneling under Key station on Boren Mode, Route and Stations per ST3 Higher Arena Higher Higher Higher Potential ST3 Schedule Effects Higher Higher Higher Higher Potential ST3 Operating Plan Effects Higher Higher Higher Higher Engineering Constraints Lower Lower Medium Lower Constructability Issues Lower Lower Lower Lower Operational Constraints Medium Medium Higher Medium Conceptual Capital Cost Comparison --- $200M increase Similar $200M increase Operating Cost Impacts Medium Medium Medium Medium Expand mobility for the corridor and region s residents, which include transit dependent, low income, and minority populations. Opportunities for Low-Income/Minority Medium Medium (activity nodes/subsidized rental units) (1) 27% 29% 24% 26% Low-Income Population (1/2) 28% / 30% 29% / 30% 28% / 30% 28% / 30% Minority Population (1/2) 36% / 36% 36% / 36% 34% / 36% 35% / 36% Youth Population (1/2) 4% / 4% 4% / 4% 4% / 4% 4% / 4% Elderly Population (1/2) 14% / 13% 14% / 13% 15% / 13% 14% / 13% Limited English Proficiency Population (1/2) 5% / 5% 5% / 5% 5% / 5% 5% / 5% Disabled Population (1/2) 12% / 12% 12% / 12% 12% / 12% 12% / 12% (1) Within station walksheds (2) Within 15 minute ride on connecting high frequency transit (3) NA = Measure not applicable to this segment Downtown Level 2 alternatives evaluation Engineering Constraints Lower Medium Higher = Key Differentiators 52
53 Evaluation Measures ST3 Representative Project 5th/Harrison 6th/Boren/Roy 5th/Terry/Roy/Mercer Provide high quality rapid, reliable, and efficient peak and off-peak light rail transit service to communities in the project corridors defined in ST3. Potential Service Interruptions Higher Higher Higher Higher Travel Times (minutes) 8 to 9 8 to 9 8 to 9 8 to 9 Improve regional mobility by increasing connectivity and capacity through downtown Seattle to meet projected transit demand. Network Integration Medium Medium Medium Medium Passenger Carrying Capacity Medium Medium Medium Medium Ridership Potential (2040 pop/emp) (1) 167, , , ,700 Connect regional centers as described in adopted regional and local land use, transportation, and economic development plans and Sound Transit s Long-Range Plan. Regional Growth Centers Served Manufacturing/Industrial Centers Served N/A (3) N/A N/A N/A Accommodates Future LRT Extension Medium Medium Medium Medium Implement a system that is consistent with the ST3 Plan that established transit mode, corridor, and station locations and that is technically feasible and financially sustainable to build, operate, and maintain. Medium Medium Mode, Route and Stations per ST3 Higher Higher Higher Higher Potential ST3 Schedule Effects Higher Higher Higher cost alternatives Higher Higher Potential ST3 Operating Plan Effects Higher Higher Higher Higher Engineering Constraints Lower Lower Medium Lower Constructability Issues Lower Lower Lower Lower Operational Constraints Medium Medium Higher Medium Conceptual Capital Cost Comparison --- $200M increase Similar $200M increase Operating Cost Impacts Medium Medium Medium Medium Expand mobility for the corridor and region s residents, which include transit dependent, low income, and minority populations. Opportunities for Low-Income/Minority Medium Medium (activity nodes/subsidized rental units) (1) 27% 29% 24% 26% Low-Income Population (1/2) 28% / 30% 29% / 30% 28% / 30% 28% / 30% Minority Population (1/2) 36% / 36% 36% / 36% 34% / 36% 35% / 36% Youth Population (1/2) 4% / 4% 4% / 4% 4% / 4% 4% / 4% Elderly Population (1/2) 14% / 13% 14% / 13% 15% / 13% 14% / 13% Limited English Proficiency Population (1/2) 5% / 5% 5% / 5% 5% / 5% 5% / 5% Disabled Population (1/2) 12% / 12% 12% / 12% 12% / 12% 12% / 12% (1) Within station walksheds (2) Within 15 minute ride on connecting high frequency transit (3) NA = Measure not applicable to this segment Lower Downtown Level 2 alternatives evaluation Conceptual Capital Cost Comparison Medium Higher = Key Differentiators 53
54 Evaluation Measures ST3 Representative Project 5th/Harrison 6th/Boren/Roy 5th/Terry/Roy/Mercer Encourage equitable and sustainable urban growth in station areas through support of transit-oriented development, station access, and modal integration in a manner that is consistent with local land use plans and policies. Compatibility with Urban Centers/Villages (1) Higher Higher Higher Higher Station Land Use Plan Consistency Higher Higher Higher Higher Activity Nodes Served (1) Passenger Transfers Lower Medium Medium Medium Bus/Rail and Rail/Rail Integration (1) Lower Medium Lower Medium Bicycle Accessibility (1) Higher Higher Higher Higher Pedestrian/Limited Mobility Accessibility (1) Higher Higher Higher Higher Development Potential (1) Medium Medium Medium Medium Equitable Development Opportunities Lower Higher Medium Medium Preserve and promote a healthy environment and economy by minimizing adverse impacts on the natural, built and social environments through sustainable practices. Historic Properties/Landmarks (2) Potential for Effects to Archaeological Resources (1) Lower Lower Lower Lower Parks and Recreational Resources Effects (acres) Water Resources Effects (acres) Fish and Wildlife Habitat Effects (acres) Hazardous Material Sites (2) Visual Effects Higher Higher Medium Higher Noise and Vibration Sensitive Receivers (1) Higher Medium Medium Higher Potentially Affected Properties Medium Medium Medium Medium Residential Unit Displacements Medium Higher Lower Lower Square Feet of Business Displacements Higher Lower Higher Higher Construction Impacts Medium Lower Medium Higher Burden on Low-Income/Minority Medium Medium Medium Medium Traffic Circulation and Access Effects Higher Higher Higher Higher Effects to Existing Transportation Facilities Medium Lower Higher Medium Effects to Freight Movement Higher Higher Higher Higher Business and Commerce Effects Higher Lower Medium Medium (1) Within station walksheds and/or defined buffer of alignment (2) On properties that overlap with the project footprint Lower Medium Higher Downtown Level 2 alternatives evaluation Part 2 of 2 54
55 Evaluation Measures ST3 Representative Project 5th/Harrison 6th/Boren/Roy 5th/Terry/Roy/Mercer Encourage equitable and sustainable urban growth in station areas through support of transit-oriented development, station access, and modal integration in a manner that is consistent with local land use plans and policies. Better bus/rail integration Lower bus/rail integration Compatibility with Urban Centers/Villages (1) Higher Higher Higher Higher opportunity at SLU opportunity at Seattle Station Land Use Plan Consistency Higher Higher Higher Higher Activity Nodes Served (1) 171 station on 171 Harrison Center station on Roy Passenger Transfers Lower Medium Medium Medium Bus/Rail and Rail/Rail Integration (1) Lower Medium Lower Medium Bicycle Accessibility (1) Higher Higher Higher Higher Pedestrian/Limited Mobility Accessibility (1) Higher Higher Higher Higher Development Potential (1) Medium Medium Medium Medium Equitable Development Opportunities Lower Higher Medium Medium Preserve and promote a healthy environment and economy by minimizing adverse impacts on the natural, built and social environments through sustainable practices. Historic Properties/Landmarks (2) Potential for Effects to Archaeological Resources (1) Lower Lower Lower Lower Parks and Recreational Resources Effects (acres) Water Resources Effects (acres) Fish and Wildlife Habitat Effects (acres) Hazardous Material Sites (2) Visual Effects Higher Higher Medium Higher Noise and Vibration Sensitive Receivers (1) Higher Medium Medium Higher Potentially Affected Properties Medium Medium Medium Medium Residential Unit Displacements Medium Higher Lower Lower Square Feet of Business Displacements Higher Lower Higher Higher Construction Impacts Medium Lower Medium Higher Burden on Low-Income/Minority Medium Medium Medium Medium Traffic Circulation and Access Effects Higher Higher Higher Higher Effects to Existing Transportation Facilities Medium Lower Higher Medium Effects to Freight Movement Higher Higher Higher Higher Business and Commerce Effects Higher Lower Medium Medium (1) Within station walksheds and/or defined buffer of alignment (2) On properties that overlap with the project footprint Lower Medium Higher Downtown Level 2 alternatives evaluation Bus/Rail and Rail/Rail Integration = Key Differentiators 55
56 Evaluation Measures ST3 Representative Project 5th/Harrison 6th/Boren/Roy 5th/Terry/Roy/Mercer Encourage equitable and sustainable urban growth in station areas through support of transit-oriented development, station access, and modal integration in a manner that is consistent with local land use plans and policies. Compatibility with Urban Centers/Villages (1) Higher Higher Higher Higher Station Land Use Plan Consistency Higher Higher Higher Higher Activity Nodes Served (1) Passenger Transfers Lower Medium Medium Medium Bus/Rail and Rail/Rail Integration (1) Lower Medium Lower Medium Bicycle Accessibility (1) Higher Higher Higher Higher Pedestrian/Limited Mobility Accessibility (1) Higher Higher Higher Higher Development Potential (1) Medium Medium Medium Medium Equitable Development Opportunities Lower Higher Medium Medium Preserve and promote a healthy environment and economy by minimizing adverse impacts on the natural, built and social environments through sustainable practices. Historic Properties/Landmarks (2) Potential for Effects to Archaeological Resources (1) Lower Lower Lower Lower Parks and Recreational Resources Effects (acres) Water Resources Effects (acres) Fish and Wildlife Habitat Effects (acres) 0 Property effects 0 due to tunnel Hazardous Material Sites (2) portal location on Harrison Visual Effects Higher Higher Medium Higher Noise and Vibration Sensitive Receivers (1) Higher Medium Medium Higher Potentially Affected Properties Medium Medium Medium Medium Residential Unit Displacements Medium Higher Lower Lower Square Feet of Business Displacements Higher Lower Higher Higher Construction Impacts Medium Lower Medium Higher Burden on Low-Income/Minority Medium Medium Medium Medium Traffic Circulation and Access Effects Higher Higher Higher Higher Effects to Existing Transportation Facilities Medium Lower Higher Medium Effects to Freight Movement Higher Higher Higher Higher Business and Commerce Effects Higher Lower Medium Medium (1) Within station walksheds and/or defined buffer of alignment (2) On properties that overlap with the project footprint Lower Medium Higher Downtown Level 2 alternatives evaluation Business Displacements, Construction Impacts = Key Differentiators 56
57 Midtown-Westlake-Denny-SLU Seattle Center Downtown Key differentiators By sub-segment 57

58 Midtown-Westlake-Denny-SLU: Key differentiators Station location Bus-rail integration Engineering constraints Downtown Key differentiators Midtown-Westlake-Denny-SLU 58
59 Key differentiators Midtown-Westlake-Denny-SLU Alternative ST3 Representative Project Key differentiators 5 th /Harrison Better bus/rail integration opportunity at SLU station on Harrison 6th/Boren/Roy Avoids building foundation tie-backs on 5 th Ave, SR 99 portal and sewer More constrained Denny station on Boren 5th/Terry/Roy/Mercer Avoids SR 99 portal and sewer 59

60 Seattle Center: Key differentiators Station location Property effects Bus-rail integration Portal location Downtown Key differentiators Seattle Center 60
61 Key differentiators Seattle Center Alternative ST3 Representative Project Key differentiators 5 th /Harrison Tunnel station on Harrison, west of soon-to-be-renovated Key Arena Engineering challenges with tunneling under Key Arena Property effects due to tunnel portal location on Harrison 6th/Boren/Roy Tunnel station on Roy, two blocks from Key Arena Lower bus/rail integration opportunity at Seattle Center station on Roy 5th/Terry/Roy/Mercer Tunnel station on Mercer, one block from Key Arena 61
62 Summary Downtown Alternative Key findings Cost comparison* Schedule comparison* ST3 Representative Project 6th/Boren/Roy Avoids building tie-backs on 5 th Ave, SR 99 portal and sewer More constrained Denny station location on Boren Seattle Center station location on Roy, two blocks from Key Arena Lower bus/rail integration opportunity at Seattle Center station on Roy Similar Higher 5 th /Harrison Better bus/rail integration opportunity at SLU station on Harrison Higher property effects due to tunnel portal location on Harrison west of Seattle Center Engineering challenges with tunneling under Key Arena + $200M Higher 5 th /Terry/Roy/ Mercer Avoids SR 99 portal and sewer Seattle Center station location on Mercer, one block from Key Arena + $200M Higher *Cost compared to cost of ST3 Representative Project for this segment. Schedule compared to overall ST3 schedule for this extension. 62
63 * Station Charrette Feedback Seattle Center Station Harrison St Tunnel Good location to serve Key Arena, but concern about connection to broader Seattle Center Farthest from Heart of Uptown, but serves core of up-zoned neighborhood Good transit integration Good non-motorized access Good TOD potential Republican St Tunnel Location serves Seattle Center, Key Arena, and Uptown Good opportunities for station entries integrated into existing buildings Good transit integration and non-motorized access High urban design potential Mercer St Tunnel Location serves Uptown well, but concern about legibility of connection to Seattle Center Good opportunities for station entries integrated into buildings on Mercer Excellent transit integration Good non-motorized access Good TOD potential Roy St Tunnel Location serves Uptown, but concern about legibility of connection to Seattle Center Some opportunities for station entries integrated into buildings Challenging for transit integration and nonmotorized access *Summary of feedback from agency and community stakeholders. Images are illustrative only. 63

64 * Station Charrette Feedback South Lake Union Station Harrison St Tunnel Good location to serve South Lake Union, Gates Foundation, east entrance of Seattle Center Good opportunities for station entries integrated into new or existing buildings Excellent transit integration for buses traveling on SR 99 Good non-motorized access through existing and planned facilities Blah Republican St Tunnel Challenging location due to SR 99 adjacency Serves SLU but not Gates Foundation or Seattle Center Limited opportunities for station entries integrated into new or existing buildings Poor transit integration for buses traveling on SR 99 Poor non-motorized access due to truncated walkshed Roy St Tunnel Challenging location due to SR 99 Serves north end of SLU, but provides good connection to Lake Union as well as Queen Anne Good opportunities for station entries integrated into new buildings Challenging for transit integration; would require reconfiguration of SR 99 bus lanes Challenging for non-motorized access *Summary of feedback from agency and community stakeholders. Images are illustrative only. 64
65 * Station Charrette Feedback Denny Station Westlake Ave Tunnel Good location to serve Amazon HQ and new Denny Triangle development Good opportunities for station entries integrated into public space and/or buildings Excellent transit integration Excellent non-motorized access Concerns about construction impacts on traffic and streetcar operations Blah Terry Ave N Tunnel Good location to serve Cascade neighborhood Good opportunities for station entries integrated into new and/or existing buildings Challenging for transit integration Good non-motorized access, with opportunity to negotiate grade on Denny through hill climbs or escalators in station Boren Ave N Tunnel Not further developed in charrette Farthest from densest part of Denny Triangle Constrained by brand-new development, but some opportunity to locate station entries in triangular parcels Challenging for transit integration Challenging for non-motorized access; at top of steep grade on Denny *Summary of feedback from agency and community stakeholders. Images are illustrative only. 65
66 Level 2 alternatives SODO/Chinatown-ID ST3 Representative Project Massachusetts Tunnel Portal Surface E-3 4th Avenue Cut-and-Cover C-ID 4th Avenue Mined C-ID 5th Avenue Mined C-ID Occidental Avenue 66
67 ST3 Representative Project Massachusetts Tunnel Portal Surface E-3 SODO and Chinatown-ID Level 2 alternatives 1 of 3 67


68 4 th Avenue Cut-and-Cover C-ID 4 th Avenue Mined C-ID 5 th Avenue Mined C-ID SODO and Chinatown-ID Level 2 alternatives 2 of 3 68

69 Occidental Avenue SODO and Chinatown-ID Level 2 alternatives 3 of 3 69
70 Higher Higher Higher Evaluation Measures ST3 Representative Massachusetts Tunnel 4th Avenue Cut-and- Surface E-3 Project Portal Cover C-ID 4th Avenue Mined C-ID5th Avenue Mined C-ID Occidental Avenue Provide high quality rapid, reliable, and efficient peak and off-peak light rail transit service to communities in the project corridors defined in ST3. Potential Service Interruptions Lower Medium Higher Lower Lower Medium Higher Travel Times (minutes) 3 to 4 3 to 4 3 to 4 3 to 4 3 to 4 3 to 4 3 to 4 Improve regional mobility by increasing connectivity and capacity through downtown Seattle to meet projected transit demand. Network Integration Medium Medium Higher Medium Medium Medium Medium Passenger Carrying Capacity Medium Medium Medium Medium Medium Medium Medium Ridership Potential (2040 pop/emp) (1) 35,900 35,900 35,900 35,300 35,300 35,900 37,100 Connect regional centers as described in adopted regional and local land use, transportation, and economic development plans and Sound Transit s Long-Range Plan. Regional Growth Centers Served N/A (3) N/A N/A N/A N/A N/A N/A Manufacturing/Industrial Centers Served Accommodates Future LRT Extension Medium Medium Medium Medium Medium Medium Medium Implement a system that is consistent with the ST3 Plan that established transit mode, corridor, and station locations and that is technically feasible and financially sustainable to build, operate, and maintain. Mode, Route and Stations per ST3 Higher Higher Higher Higher Higher Higher Medium Potential ST3 Schedule Effects Higher Higher Higher Lower Lower Medium Higher Potential ST3 Operating Plan Effects Medium Medium Higher Higher Lower Medium Higher Engineering Constraints Medium Medium Medium Lower Lower Medium Lower Constructability Issues Medium Medium Medium Lower Lower Medium Lower Operational Constraints Medium Medium Higher Medium Lower Medium Medium Conceptual Capital Cost Comparison - $200M decrease $400M decrease $600M increase $500M increase Similar Similar (+ $200M in SODO) Operating Cost Impacts Medium Medium Higher Medium Medium Medium Medium Expand mobility for the corridor and region s residents, which include transit dependent, low income, and minority populations. Opportunities for Low-Income/Minority Higher Higher Higher Higher (activity nodes/subsidized rental units) (1) 80% 80% 80% 75% 75% 80% 73% Low-Income Population (1/2) 59% / 49% 59% / 49% 59% / 49% 57% / 49% 57% / 49% 59% / 49% 58% / 49% Minority Population (1/2) 65% / 54% 65% / 54% 65% / 54% 63% / 54% 63% / 54% 65% / 54% 65% / 53% Youth Population (1/2) 7% / 7% 7% / 7% 7% / 7% 6% / 7% 6% / 7% 7% / 7% 7% / 8% Elderly Population (1/2) 20% / 19% 20% / 19% 20% / 19% 20% / 19% 20% / 19% 20% / 19% 20% / 19% Limited English Proficiency Population (1/2) 30% / 19% 30% / 19% 30% / 19% 28% / 19% 28% / 19% 30% / 19% 30% / 18% Disabled Population (1/2) 24% / 19% 24% / 19% 24% / 19% 25% / 19% 25% / 19% 24% / 19% 24% / 19% (1) Within station walksheds (2) Within 15 minute ride on connecting high frequency transit (3) NA = Measure not applicable to this segment SODO and Chinatown-ID Level 2 alternatives evaluation Part 1 of 2 Lower Medium Higher 70
71 Higher Higher Higher Evaluation Measures ST3 Representative Massachusetts Tunnel 4th Avenue Cut-and- Surface E-3 Project Portal Cover C-ID 4th Avenue Mined C-ID5th Avenue Mined C-ID Occidental Avenue Provide high quality rapid, reliable, and efficient peak and off-peak light rail transit service to communities in the project corridors defined in ST3. Potential Service Interruptions Lower Medium Higher Lower Lower Medium Higher Travel Times (minutes) 3 to 4 3 to 4 3 to 4 3 to 4 3 to 4 3 to 4 3 to 4 Improve regional mobility by increasing connectivity and capacity through downtown Seattle to meet projected transit demand. Network Integration Medium Medium Higher New Medium grade-separated Medium roadway Medium Medium Passenger Carrying Capacity Medium Medium Medium Medium Medium Medium Medium crossings (Lander, Holgate) Ridership Potential (2040 pop/emp) (1) 35,900 35,900 35,900 35,300 35,300 35,900 37,100 Connect regional centers as described in adopted regional and local land use, transportation, and economic development improve plans and existing Sound Transit s rail/traffic/ Long-Range freight Plan. Regional Growth Centers Served N/A (3) N/A N/A N/A operations N/A N/A N/A Manufacturing/Industrial Centers Served Accommodates Future LRT Extension Medium Medium Medium Medium Medium Medium Medium Implement a system that is consistent with the ST3 Plan that established transit mode, corridor, and station locations and that is technically feasible and financially sustainable to build, operate, and maintain. Mode, Route and Stations per ST3 Higher Higher Higher Higher Higher Higher Medium Potential ST3 Schedule Effects Higher Higher Higher Lower Lower Medium Higher Potential ST3 Operating Plan Effects Medium Medium Higher Higher Lower Medium Higher Engineering Constraints Medium Medium Medium Lower Lower Medium Lower Constructability Issues Medium Medium Medium Lower Lower Medium Lower Operational Constraints Medium Medium Higher Medium Lower Medium Medium Conceptual Capital Cost Comparison - $200M decrease $400M decrease $600M increase $500M increase Similar Similar (+ $200M in SODO) Operating Cost Impacts Medium Medium Higher Medium Medium Medium Medium Expand mobility for the corridor and region s residents, which include transit dependent, low income, and minority populations. Opportunities for Low-Income/Minority Higher Higher Higher Higher (activity nodes/subsidized rental units) (1) 80% 80% 80% 75% 75% 80% 73% Low-Income Population (1/2) 59% / 49% 59% / 49% 59% / 49% 57% / 49% 57% / 49% 59% / 49% 58% / 49% Minority Population (1/2) 65% / 54% 65% / 54% 65% / 54% 63% / 54% 63% / 54% 65% / 54% 65% / 53% Youth Population (1/2) 7% / 7% 7% / 7% 7% / 7% 6% / 7% 6% / 7% 7% / 7% 7% / 8% Elderly Population (1/2) 20% / 19% 20% / 19% 20% / 19% 20% / 19% 20% / 19% 20% / 19% 20% / 19% Limited English Proficiency Population (1/2) 30% / 19% 30% / 19% 30% / 19% 28% / 19% 28% / 19% 30% / 19% 30% / 18% Disabled Population (1/2) 24% / 19% 24% / 19% 24% / 19% 25% / 19% 25% / 19% 24% / 19% 24% / 19% (1) Within station walksheds (2) Within 15 minute ride on connecting high frequency transit (3) NA = Measure not applicable to this segment SODO and Chinatown-ID Level 2 alternatives evaluation Potential Service Interruptions Lower Medium Higher = Key Differentiators 71
72 Higher Higher Higher Evaluation Measures ST3 Representative Massachusetts Tunnel 4th Avenue Cut-and- Surface E-3 Project Portal Cover C-ID 4th Avenue Mined C-ID5th Avenue Mined C-ID Occidental Avenue Provide high quality rapid, reliable, and efficient peak and off-peak light rail transit service to communities in the project corridors defined in ST3. Potential Service Interruptions Lower Medium Higher Lower Lower Medium Higher Travel Times (minutes) 3 to 4 3 to 4 3 to 4 3 to 4 3 to 4 3 to 4 3 to 4 Improve regional mobility by increasing connectivity and capacity through downtown Seattle to meet projected transit demand. Network Integration Medium Medium Higher Medium Medium Medium Medium Passenger Carrying Capacity Medium Medium Requires Medium 3 rd party Medium funding for Medium Medium Medium Ridership Potential (2040 pop/emp) (1) 35,900 35,900 35,900 35,300 35,300 35,900 37,100 rebuild of 4 Connect regional centers as described in adopted regional and local land use, transportation, and economic development Ave viaduct; plans and Sound Transit s Long-Range Plan. Regional Growth Centers Served N/A (3) N/A engineering/constructability N/A N/A N/A N/A N/A Manufacturing/Industrial Centers Served 1 1 issues 1 and potential schedule Accommodates Future LRT Extension Medium Medium Medium delay Medium Medium Medium Medium Implement a system that is consistent with the ST3 Plan that established transit mode, corridor, and station locations and that is technically feasible and financially sustainable to build, operate, and maintain. Mode, Route and Stations per ST3 Higher Higher Higher Higher Higher Higher Medium Potential ST3 Schedule Effects Higher Higher Higher Lower Lower Medium Higher Potential ST3 Operating Plan Effects Medium Medium Higher Higher Lower Medium Higher Engineering Constraints Medium Medium Medium Lower Lower Medium Lower Constructability Issues Medium Medium Medium Lower Lower Medium Lower Operational Constraints Medium Medium Higher Medium Lower Medium Medium Conceptual Capital Cost Comparison - $200M decrease $400M decrease $600M increase $500M increase Similar Similar (+ $200M in SODO) Operating Cost Impacts Medium Medium Higher Medium Medium Medium Medium Expand mobility for the corridor and region s residents, which include transit dependent, low income, and minority populations. Opportunities for Low-Income/Minority Higher Higher Higher Higher (activity nodes/subsidized rental units) (1) 80% 80% 80% 75% 75% 80% 73% Low-Income Population (1/2) 59% / 49% 59% / 49% 59% / 49% 57% / 49% 57% / 49% 59% / 49% 58% / 49% Minority Population (1/2) 65% / 54% 65% / 54% 65% / 54% 63% / 54% 63% / 54% 65% / 54% 65% / 53% Youth Population (1/2) 7% / 7% 7% / 7% 7% / 7% 6% / 7% 6% / 7% 7% / 7% 7% / 8% Elderly Population (1/2) 20% / 19% 20% / 19% 20% / 19% 20% / 19% 20% / 19% 20% / 19% 20% / 19% Limited English Proficiency Population (1/2) 30% / 19% 30% / 19% 30% / 19% 28% / 19% 28% / 19% 30% / 19% 30% / 18% Disabled Population (1/2) 24% / 19% 24% / 19% 24% / 19% 25% / 19% 25% / 19% 24% / 19% 24% / 19% (1) Within station walksheds (2) Within 15 minute ride on connecting high frequency transit (3) NA = Measure not applicable to this segment SODO and Chinatown-ID Level 2 alternatives evaluation Potential ST3 Schedule Effects Lower Medium Higher = Key Differentiators 72
73 Higher Higher Higher Evaluation Measures ST3 Representative Massachusetts Tunnel 4th Avenue Cut-and- Surface E-3 Project Portal Cover C-ID 4th Avenue Mined C-ID5th Avenue Mined C-ID Occidental Avenue Provide high quality rapid, reliable, and efficient peak and off-peak light rail transit service to communities in the project corridors defined in ST3. Potential Service Interruptions Lower Medium Higher Lower Lower Medium Higher Travel Times (minutes) 3 to 4 3 to 4 3 to 4 3 to 4 3 to 4 3 to 4 3 to 4 Improve regional mobility by increasing connectivity and capacity through downtown Seattle to meet projected transit demand. Network Integration Medium Medium Higher Medium Medium Medium Medium Passenger Carrying Capacity Medium Medium Medium Medium Medium Medium Medium Ridership Potential (2040 pop/emp) (1) 35,900 35,900 35,900 35,300 35,300 35,900 37,100 Major engineering/constructability Connect regional centers as described in adopted regional and local land use, transportation, and economic development plans and Sound Transit s Long-Range Plan. Regional Growth Centers Served N/A (3) N/A constraints N/A (4 th Ave viaduct N/A N/A N/A N/A Manufacturing/Industrial Centers Served 1 1 rebuild, adjacent 1 to active BNSF Requires longspan structures Medium 1 Accommodates Future LRT Extension Medium Medium railway, Medium proximity/disruption Medium to Medium Medium Implement a system that is consistent with the ST3 Plan that established transit mode, corridor, and station locations and that is technically feasible and financially sustainable to build, operate, and maintain. existing transit tunnel, etc.) over BNSF tracks Mode, Route and Stations per ST3 Higher Higher Higher Higher Higher Higher Medium Potential ST3 Schedule Effects Higher Higher Higher Lower Lower Medium Higher Potential ST3 Operating Plan Effects Medium Medium Higher Higher Lower Medium Higher Engineering Constraints Medium Medium Medium Lower Lower Medium Lower Constructability Issues Medium Medium Medium Lower Lower Medium Lower Operational Constraints Medium Medium Higher Medium Lower Medium Medium Conceptual Capital Cost Comparison - $200M decrease $400M decrease $600M increase $500M increase Similar Similar (+ $200M in SODO) Operating Cost Impacts Medium Medium Higher Medium Medium Medium Medium Expand mobility for the corridor and region s residents, which include transit dependent, low income, and minority populations. Opportunities for Low-Income/Minority Higher Higher Higher Higher (activity nodes/subsidized rental units) (1) 80% 80% 80% 75% 75% 80% 73% Low-Income Population (1/2) 59% / 49% 59% / 49% 59% / 49% 57% / 49% 57% / 49% 59% / 49% 58% / 49% Minority Population (1/2) 65% / 54% 65% / 54% 65% / 54% 63% / 54% 63% / 54% 65% / 54% 65% / 53% Youth Population (1/2) 7% / 7% 7% / 7% 7% / 7% 6% / 7% 6% / 7% 7% / 7% 7% / 8% Elderly Population (1/2) 20% / 19% 20% / 19% 20% / 19% 20% / 19% 20% / 19% 20% / 19% 20% / 19% Limited English Proficiency Population (1/2) 30% / 19% 30% / 19% 30% / 19% 28% / 19% 28% / 19% 30% / 19% 30% / 18% Disabled Population (1/2) 24% / 19% 24% / 19% 24% / 19% 25% / 19% 25% / 19% 24% / 19% 24% / 19% (1) Within station walksheds (2) Within 15 minute ride on connecting high frequency transit (3) NA = Measure not applicable to this segment Lower Medium SODO and Chinatown-ID Level 2 alternatives evaluation Engineering Constraints, Constructability Issues Higher = Key Differentiators 73
74 Higher Higher Higher Evaluation Measures ST3 Representative Massachusetts Tunnel 4th Avenue Cut-and- Surface E-3 Project Portal Cover C-ID 4th Avenue Mined C-ID5th Avenue Mined C-ID Occidental Avenue Provide high quality rapid, reliable, and efficient peak and off-peak light rail transit service to communities in the project corridors defined in ST3. Potential Service Interruptions Lower Medium Higher Lower Lower Medium Higher Travel Times (minutes) 3 to 4 3 to 4 3 to 4 3 to 4 3 to 4 3 to 4 3 to 4 Improve regional mobility by increasing connectivity and capacity through downtown Seattle to meet projected transit demand. Network Integration Medium Medium Higher Medium Medium Medium Medium Passenger Carrying Capacity Medium Medium Medium Medium Medium Medium Medium Ridership Potential (2040 pop/emp) (1) 35,900 35,900 35,900 35,300 35,300 35,900 37,100 Connect regional centers as described in adopted regional and local land use, transportation, and economic development plans and Sound Transit s Long-Range Plan. Regional Growth Centers Served N/A (3) N/A N/A N/A N/A N/A N/A Manufacturing/Industrial Centers Served Accommodates Future LRT Extension Medium Medium Medium Medium Medium Medium Medium Implement a system that is consistent with the ST3 Plan that established transit mode, corridor, and station locations and that is technically feasible and financially sustainable to build, operate, and maintain. Mode, Route and Stations per ST3 Higher Higher Higher Higher Higher Higher Medium Potential ST3 Schedule Effects Higher Higher Higher Lower Lower Medium Higher Highest cost Potential ST3 Operating Plan Effects Medium Medium Higher Higher Lower Medium Higher Highest cost Chinatown- Engineering Constraints Medium Medium Medium Lower Lower Medium SODO alternative Lower Constructability Issues Medium Medium Medium Lower ID alternatives Lower Medium Lower Operational Constraints Medium Medium Higher Medium Lower Medium Medium Conceptual Capital Cost Comparison - $200M decrease $400M decrease $600M increase $500M increase Similar Similar (+ $200M in SODO) Operating Cost Impacts Medium Medium Higher Medium Medium Medium Medium Expand mobility for the corridor and region s residents, which include transit dependent, low income, and minority populations. Opportunities for Low-Income/Minority Higher Higher Higher Higher (activity nodes/subsidized rental units) (1) 80% 80% 80% 75% 75% 80% 73% Low-Income Population (1/2) 59% / 49% 59% / 49% 59% / 49% 57% / 49% 57% / 49% 59% / 49% 58% / 49% Minority Population (1/2) 65% / 54% 65% / 54% 65% / 54% 63% / 54% 63% / 54% 65% / 54% 65% / 53% Youth Population (1/2) 7% / 7% 7% / 7% 7% / 7% 6% / 7% 6% / 7% 7% / 7% 7% / 8% Elderly Population (1/2) 20% / 19% 20% / 19% 20% / 19% 20% / 19% 20% / 19% 20% / 19% 20% / 19% Limited English Proficiency Population (1/2) 30% / 19% 30% / 19% 30% / 19% 28% / 19% 28% / 19% 30% / 19% 30% / 18% Disabled Population (1/2) 24% / 19% 24% / 19% 24% / 19% 25% / 19% 25% / 19% 24% / 19% 24% / 19% (1) Within station walksheds (2) Within 15 minute ride on connecting high frequency transit (3) NA = Measure not applicable to this segment Lower SODO and Chinatown-ID Level 2 alternatives evaluation Conceptual Capital Cost Comparison Medium Higher = Key Differentiators 74
75 Evaluation Measures ST3 Representative Massachusetts Tunnel 4th Avenue Cut-and- Surface E-3 Project Portal Cover C-ID 4th Avenue Mined C-ID5th Avenue Mined C-ID Occidental Avenue Encourage equitable and sustainable urban growth in station areas through support of transit-oriented development, station access, and modal integration in a manner that is consistent with local land use plans and policies. Compatibility with Urban Centers/Villages (1) Medium Medium Medium Medium Medium Medium Medium Station Land Use Plan Consistency Medium Medium Medium Medium Medium Medium Medium Activity Nodes Served (1) Passenger Transfers Higher Medium Medium Medium Lower Lower Medium Bus/Rail and Rail/Rail Integration (1) Medium Medium Medium Medium Medium Medium Medium Bicycle Accessibility (1) 21% 21% 21% 21% 21% 21% 21% Pedestrian/Limited Mobility Accessibility (1) Medium Medium Medium Medium Medium Medium Medium Development Potential (1) 14% 14% 14% 13% 13% 14% 15% Equitable Development Opportunities Lower Medium Lower Medium Lower Medium Higher Preserve and promote a healthy environment and economy by minimizing adverse impacts on the natural, built and social environments through sustainable practices. Historic Properties/Landmarks (2) Potential for effects to Archaeological Resources (1) Lower Lower Lower Lower Lower Lower Lower Parks and Recreational Resources Effects (acres) Water Resource Effects (acres) Fish and Wildlife Habitat Effects (acres) Hazardous Materials Sites (1) Visual Effects Higher Higher Higher Higher Higher Higher Higher Noise and Vibration Sensitive Receivers (1) Medium Medium Medium Medium Medium Medium Medium Potentially Affected Properties Medium Medium Medium Medium Medium Medium Medium Residential Unit Displacements Medium Medium Medium Medium Medium Medium Medium Square Feet of Business Displacements Higher Lower Higher Lower Higher Lower Lower Construction Impacts Lower Higher Medium Lower Lower Higher Medium Burden on Low-Income/Minority Medium Medium Medium Lower Lower Higher Medium Traffic Circulation and Access Effects Medium Higher Medium Lower Medium Higher Medium Effects on Existing Transportation Facilities Lower Higher Medium Lower Lower Higher Medium Effects on Freight Movement Medium Higher Medium Lower Lower Higher Lower Business and Commerce Effects Medium Medium Medium Medium Medium Higher Lower (1) Within station walksheds and/or defined buffer of alignment (2) On properties that overlap with the project footprint Lower Medium Higher SODO and Chinatown-ID Level 2 alternatives evaluation Part 2 of 2 75
76 Evaluation Measures ST3 Representative Massachusetts Tunnel 4th Avenue Cut-and- Surface E-3 Project Portal Cover C-ID 4th Avenue Mined C-ID5th Avenue Mined C-ID Occidental Avenue Encourage equitable and sustainable urban growth in station areas through support of transit-oriented development, station access, and modal integration in a manner that is consistent with local land use plans and policies. Compatibility with Urban Centers/Villages (1) Medium Medium Medium Medium Medium Medium Medium Station Land Use Plan Consistency Medium Medium Medium Medium Medium Medium Medium Activity Nodes Served (1) Passenger Transfers Higher Medium Medium Medium Lower Lower Medium Bus/Rail and Rail/Rail Integration (1) Medium Medium Medium Medium Medium Medium Medium Bicycle Accessibility (1) 21% 21% 21% 21% 21% 21% 21% Pedestrian/Limited Mobility Accessibility (1) Medium Medium Medium Medium Medium Medium Medium Development Potential (1) 14% 14% 14% 13% 13% 14% 15% Equitable Development Opportunities Lower Medium Lower Medium ~200 deep Lower mined stations Medium Higher Preserve and promote a healthy environment and economy by minimizing adverse impacts on the natural, built and social environments through sustainable practices. Historic Properties/Landmarks (2) provide relatively 2 poor rider 3 3 Potential for effects to Archaeological Resources (1) Lower Lower Lower Lower access and Lower ease of transfers Lower Lower Parks and Recreational Resources Effects (acres) (also results 0in ~250 deep 0 0 Water Resource Effects (acres) Midtown 0 Station) 0 0 Fish and Wildlife Habitat Effects (acres) Hazardous Materials Sites (1) Visual Effects Higher Higher Higher Higher Higher Higher Higher Noise and Vibration Sensitive Receivers (1) Medium Medium Medium Medium Medium Medium Medium Potentially Affected Properties Medium Medium Medium Medium Medium Medium Medium Residential Unit Displacements Medium Medium Medium Medium Medium Medium Medium Square Feet of Business Displacements Higher Lower Higher Lower Higher Lower Lower Construction Impacts Lower Higher Medium Lower Lower Higher Medium Burden on Low-Income/Minority Medium Medium Medium Lower Lower Higher Medium Traffic Circulation and Access Effects Medium Higher Medium Lower Medium Higher Medium Effects on Existing Transportation Facilities Lower Higher Medium Lower Lower Higher Medium Effects on Freight Movement Medium Higher Medium Lower Lower Higher Lower Business and Commerce Effects Medium Medium Medium Medium Medium Higher Lower (1) Within station walksheds and/or defined buffer of alignment (2) On properties that overlap with the project footprint Lower Medium Higher SODO and Chinatown-ID Level 2 alternatives evaluation Passenger Transfers = Key Differentiators 76
77 Evaluation Measures ST3 Representative Massachusetts Tunnel 4th Avenue Cut-and- Surface E-3 Project Portal Cover C-ID 4th Avenue Mined C-ID5th Avenue Mined C-ID Occidental Avenue Encourage equitable and sustainable urban growth in station areas through support of transit-oriented development, station access, and modal integration in a manner that is consistent with local land use plans and policies. Compatibility with Urban Centers/Villages (1) Medium Medium Medium Medium Medium Medium Medium Station Land Use Plan Consistency Medium Medium Medium Medium Medium Medium Medium Activity Nodes Served (1) Passenger Transfers Higher Medium Medium Medium Lower Lower Medium Bus/Rail and Rail/Rail Integration (1) Medium Medium Medium Medium Medium Medium Medium Bicycle Accessibility (1) 21% 21% 21% 21% 21% 21% 21% Pedestrian/Limited Mobility Accessibility (1) Medium Medium Medium Medium Medium Medium Medium Development Potential (1) 14% 14% 14% 13% 13% 14% 15% Equitable Development Opportunities Lower Medium Lower Medium Lower Medium Higher Preserve and promote a healthy environment and economy by minimizing adverse impacts on the natural, built and social environments through sustainable practices. Historic Properties/Landmarks (2) Property effects 3 Potential for effects to Archaeological Resources (1) Lower Lower Lower Lower Lower Lower Lower Parks and Recreational Resources Effects (acres) Property effects along Occidental, 0 Water Resource Effects (acres) along 4 th 0 Ave Property 0 effects 0 BNSF crossings 0 Fish and Wildlife Habitat Effects (acres) 0 Property effects 0 0 (incl. King 0County (tunnel 0 portal in 0 and maintenance 0 Hazardous Materials Sites (1) 4 (tunnel portal 9 in Admin Building) SODO) facility connection Visual Effects Higher SODO) Higher Higher Higher Higher Higher Higher Noise and Vibration Sensitive Receivers (1) Medium Medium Medium Medium Medium Medium Medium Potentially Affected Properties Medium Medium Medium Medium Medium Medium Medium Residential Unit Displacements Medium Medium Medium Medium Medium Medium Medium Square Feet of Business Displacements Higher Lower Higher Lower Higher Lower Lower Construction Impacts Lower Higher Medium Lower Lower Higher Medium Burden on Low-Income/Minority Medium Medium Medium Lower Lower Higher Medium Traffic Circulation and Access Effects Medium Higher Medium Lower Medium Higher Medium Effects on Existing Transportation Facilities Lower Higher Medium Lower Lower Higher Medium Effects on Freight Movement Medium Higher Medium Lower Lower Higher Lower Business and Commerce Effects Medium Medium Medium Medium Medium Higher Lower (1) Within station walksheds and/or defined buffer of alignment (2) On properties that overlap with the project footprint Lower Medium Higher SODO and Chinatown-ID Level 2 alternatives evaluation Business Displacements = Key Differentiators 77
78 Evaluation Measures ST3 Representative Massachusetts Tunnel 4th Avenue Cut-and- Surface E-3 Project Portal Cover C-ID 4th Avenue Mined C-ID5th Avenue Mined C-ID Occidental Avenue Encourage equitable and sustainable urban growth in station areas through support of transit-oriented development, station access, and modal integration in a manner that is consistent with local land use plans and policies. Compatibility with Urban Centers/Villages (1) Medium Medium Medium Medium Medium Medium Medium Station Land Use Plan Consistency Medium Medium Medium Medium Medium Medium Medium Activity Nodes Served (1) Passenger Transfers Higher Medium Medium Medium Lower Lower Medium Bus/Rail and Rail/Rail Integration (1) Medium Medium Medium Medium Medium Medium Medium Bicycle Accessibility (1) 21% 21% 21% 21% 21% 21% 21% Pedestrian/Limited Mobility Accessibility (1) Medium Medium Medium Medium Medium Medium Medium Development Potential (1) 14% 14% 14% 13% 13% 14% 15% Equitable Development Opportunities Lower Medium Lower Medium Lower Medium Higher Preserve and promote a healthy environment and economy by minimizing adverse impacts on the natural, built and social environments through sustainable practices. Historic Properties/Landmarks (2) Potential for effects to Archaeological Resources (1) Lower Lower Lower Lower Lower Lower Lower Parks and Recreational Resources Effects (acres) Water Resource Effects (acres) Cut-and-cover 0tunnel on 5 th 0 0Cut-and-cover tunnel 0 on 4 th Fish and Wildlife Habitat Effects (acres) Ave, periodic closures 0 (8, Ave, periodic closures 0 0 Mined station on 04 Ave, full 0 Hazardous Materials Sites (1) vehicles/day), 4 greater 9 4(33,000 vehicles/day), 5 less 9closure (33,000 vehicles/day), 9 6 Visual Effects noise/vibration/visual Higher effects Higher Higher noise/vibration/visual Higher effects Higherless noise/vibration/visual Higher Higher Noise and Vibration Sensitive Receivers (1) Medium Medium Medium Medium Medium Medium Medium Potentially Affected Properties to Chinatown/ID Medium Medium Medium to Chinatown/ID effects to Chinatown/ID Medium Medium Medium Medium Residential Unit Displacements Medium Medium Medium Medium Medium Medium Medium Square Feet of Business Displacements Higher Lower Higher Lower Higher Lower Lower Construction Impacts Lower Higher Medium Lower Lower Higher Medium Burden on Low-Income/Minority Medium Medium Medium Lower Lower Higher Medium Traffic Circulation and Access Effects Medium Higher Medium Lower Medium Higher Medium Effects on Existing Transportation Facilities Lower Higher Medium Lower Lower Higher Medium Effects on Freight Movement Medium Higher Medium Lower Lower Higher Lower Business and Commerce Effects Medium Medium Medium Medium Medium Higher Lower (1) Within station walksheds and/or defined buffer of alignment (2) On properties that overlap with the project footprint Lower Medium Higher SODO and Chinatown-ID Level 2 alternatives evaluation Construction Impacts = Key Differentiators 78
79 Evaluation Measures ST3 Representative Massachusetts Tunnel 4th Avenue Cut-and- Surface E-3 Project Portal Cover C-ID 4th Avenue Mined C-ID5th Avenue Mined C-ID Occidental Avenue Encourage equitable and sustainable urban growth in station areas through support of transit-oriented development, station access, and modal integration in a manner that is consistent with local land use plans and policies. Compatibility with Urban Centers/Villages (1) Medium Medium Medium Medium Medium Medium Medium Station Land Use Plan Consistency Medium Medium Medium Medium Medium Medium Medium Activity Nodes Served (1) Passenger Transfers Higher Medium Medium Medium Lower Lower Medium Bus/Rail and Rail/Rail Integration (1) Medium Medium Medium Medium Medium Medium Medium Bicycle Accessibility (1) 21% 21% 21% 21% 21% 21% 21% Pedestrian/Limited Mobility Accessibility (1) Medium Medium Medium Medium Medium Medium Medium Development Potential (1) 14% 14% 14% 13% 13% 14% 15% Equitable Development Opportunities Lower Medium Lower Medium Lower Medium Higher Preserve and promote a healthy environment and economy by minimizing adverse impacts on the natural, built and social environments through sustainable practices. Historic Properties/Landmarks (2) Potential for effects to Archaeological Resources (1) Lower Lower Lower Lower Lower Lower Lower Parks and Recreational Resources Effects (acres) 0 0 Displacement 0 of social services 0 Traffic 0 detour effects 0 0 Water Resource Effects (acres) 0 0 at Jefferson 0 portal site; traffic 0 from 0 full 4 th Ave lane 0 0 Fish and Wildlife Habitat Effects (acres) 0 0 detour effects 0 from partial 04 closures 0 during 0 0 Hazardous Materials Sites (1) Visual Effects Higher Higher Ave lane Higher closures during Higher full partial viaduct Higher Higher Higher Noise and Vibration Sensitive Receivers (1) Medium Medium viaduct Medium replacement Medium Medium replacement Medium Medium Potentially Affected Properties Medium Medium Medium Medium Medium Medium Medium Residential Unit Displacements Medium Medium Medium Medium Medium Medium Medium Square Feet of Business Displacements Higher Lower Higher Lower Higher Lower Lower Construction Impacts Lower Higher Medium Lower Lower Higher Medium Burden on Low-Income/Minority Medium Medium Medium Lower Lower Higher Medium Traffic Circulation and Access Effects Medium Higher Medium Lower Medium Higher Medium Effects on Existing Transportation Facilities Lower Higher Medium Lower Lower Higher Medium Effects on Freight Movement Medium Higher Medium Lower Lower Higher Lower Business and Commerce Effects Medium Medium Medium Medium Medium Higher Lower (1) Within station walksheds and/or defined buffer of alignment (2) On properties that overlap with the project footprint Lower Medium Higher SODO and Chinatown-ID Level 2 alternatives evaluation Burden on Low-Income/Minority = Key Differentiators 79
80 Evaluation Measures ST3 Representative Massachusetts Tunnel 4th Avenue Cut-and- Surface E-3 Project Portal Cover C-ID 4th Avenue Mined C-ID5th Avenue Mined C-ID Occidental Avenue Encourage equitable and sustainable urban growth in station areas through support of transit-oriented development, station access, and modal integration in a manner that is consistent with local land use plans and policies. Compatibility with Urban Centers/Villages (1) Medium Medium Medium Medium Medium Medium Medium Station Land Use Plan Consistency Medium Medium Medium Medium Medium Medium Medium Activity Nodes Served (1) Passenger Transfers Higher Medium Medium Mdium Lower Lower Medium Bus/Rail and Rail/Rail Integration (1) Medium Medium Medium Medium Medium Medium Medium Bicycle Accessibility (1) 21% 21% 21% 21% 21% 21% 21% Pedestrian/Limited Mobility Accessibility (1) Medium Medium Medium Medium Medium Medium Medium Development Potential (1) 14% 14% 14% 13% 13% 14% 15% Equitable Development Opportunities Lower Medium Lower Medium Lower Medium Higher Preserve and promote a healthy environment and economy by minimizing adverse impacts on the natural, built and social environments through sustainable practices. Historic Properties/Landmarks (2) Construction Potential for effects to Archaeological Resources (1) Lower Lower Lower Lower effects, Lower including Lower Lower Parks and Recreational Resources Effects (acres) New gradeseparated 0 roadway 0effects, including 0 Ryerson Bus 0 Base 0 0 Construction displacement of Water Resource Effects (acres) Fish and Wildlife Habitat Effects (acres) 0 Hazardous Materials Sites (1) 4 crossings 9 (Lander, 4 4 th Ave lane 5 and lane closures Visual Effects Higher Higher Higher Higher Higher Higher Higher Construction effects on Holgate) improve closures during on 4 th Ave due to Noise and Vibration Sensitive Receivers (1) Medium Medium Medium Medium Medium Less Mediumconstruction Medium effects, Potentially Affected Properties WSDOT ramp structures existing full replacement partial replacement Medium Medium Medium Medium Medium Medium lane closures on Medium 5 Residential Unit Displacements Medium rail/traffic/freight Medium Medium Medium of viaduct Medium structure Ave and foundations of viaduct Medium with mined station Medium Square Feet of Business Displacements Higher operations Lower Higher structure Lower Higher Lower Lower Construction Impacts Lower Higher Medium Lower Lower Higher Medium Burden on Low-Income/Minority Medium Medium Medium Lower Lower Higher Medium Traffic Circulation and Access Effects Medium Higher Medium Lower Medium Higher Medium Effects on Existing Transportation Facilities Lower Higher Medium Lower Lower Higher Medium Effects on Freight Movement Medium Higher Medium Lower Lower Higher Lower Business and Commerce Effects Medium Medium Medium Medium Medium Higher Lower (1) Within station walksheds and/or defined buffer of alignment (2) On properties that overlap with the project footprint Lower Medium Higher SODO and Chinatown-ID Level 2 alternatives evaluation Traffic Circulation, Existing Facilities, Freight = Key Differentiators 80

81 SODO Chinatown-ID SODO and Chinatown-ID Key differentiators By sub-segment 81


82 SODO: Key differentiators New SODO Station location Transfer with existing station Engineering/ constructability issues Bus operations Property effects Rail, traffic & freight operations SODO and Chinatown-ID Key differentiators SODO 82
83 Summary SODO Alternative ST3 Representative Project Key findings Cost comparison* Schedule comparison* Surface E-3 Massachusetts Tunnel Portal New at-grade SODO Station on E-3 transitway at Lander Transfer at existing SODO Station Bus operations on E-3 transitway displaced New grade-separated roadway crossings (Lander, Holgate) improve existing rail/traffic/freight operations Property effects at tunnel portal site (for Massachusetts Tunnel Portal alternative only) Massachusetts Tunnel Portal alternative avoids impacts to Ryerson Base - $100M ** Higher Higher Occidental Ave. New elevated SODO Station on Occidental Ave at Lander Transfer at existing Stadium Station Long span bridges over BNSF tracks and longer track connection to maintenance facility Bus operations on E-3 transitway partially displaced Property effects along Occidental, BNSF crossings and maintenance facility connection + $200M Higher *Cost compared to cost of ST3 Representative Project for this SODO sub-segment only. Schedule compared to overall ST3 schedule for this extension. **Cost comparison reflected in Chinatown/ID summary table. 83


84 Chinatown-International District: Key differentiators Station location Ease of station access/passenger transfers Construction, traffic effects Property effects Viaduct re-build project issues SODO and Chinatown-ID Key differentiators Chinatown-International District 84
85 Summary Chinatown-ID Alternative Key findings Cost comparison* Schedule comparison* ST3 Representative Project E-3 Surface (shorter 5 th Ave Cut-and- Cover Tunnel) Shallow cut-and-cover station under 5 th Ave; easy rider access/transfers Construction effects, lane closures on 5 th Ave in station area - $300M** Higher Massachusetts Tunnel Portal (5 th Ave Bored Tunnel) Shallow cut-and-cover station under 5 th Ave; easy rider access/transfers Construction effects, lane closures on 5 th Ave in station area - $200M Higher 5 th Ave Mined C-ID Deep mined station (~200 ) under 5 th Ave; poor rider access/transfers Less construction effects, lane closures on 5 th Ave with mined station Some property effects (for mined station access shaft) Results in very deep Midtown Station (~250 ) Similar Medium 4 th Ave Mined C-ID Deep mined station (~200 ) under 4 th Ave, poor rider access/transfers Major engineering/constructability constraints (4 th Ave viaduct demolition/rebuild, active BNSF railway, existing transit tunnel, etc.) Large property effects (Ryerson Base for tunnel portal site) Requires 3 rd party funding of 4 th Ave Viaduct re-buildcosts Results in very deep Midtown Station (~250 ) + $500M Lower 4 th Ave Cut-and-Cover C-ID Shallow cut-and-cover station under 4 th Ave; easy rider access/transfers Major engineering/constructability constraints (4 th Ave viaduct demolition/rebuild, active BNSF railway, existing transit tunnel, etc.) Large property effects (King County Admin Building) Requires 3 rd party funding of 4 th Ave Viaduct re-buildcosts + $600M Lower *Cost compared to cost of ST3 Representative Project for this segment. Schedule compared to overall ST3 schedule for this extension. **Cost comparison for Chinatown/ID sub-segment only; total SODO/C-ID segment cost difference is - $400M compared to ST3 Representative Project. 85

86 * Station Charrette Feedback Chinatown-ID 5th Ave S Tunnel Cut and Cover Greatest concern about construction effects to C-ID neighborhood and displacement of businesses Less opportunity to connect to King Street Station Could activate Union Station and plaza Some TOD potential 5th Ave S Tunnel Mined Less concern about construction effects Less opportunity to connect to King Street Station Could activate Union Station and plaza Could span Jackson Street Some TOD potential 4 th Ave S Tunnel Cut and Cover Concern about construction effects to traffic with 4 th Ave S viaduct rebuild Opportunity to connect to King Street Station services Could activate Union Station Limited TOD potential 4 th Ave S Tunnel Mined Concern about construction effects to traffic with 4 th Ave S viaduct rebuild Opportunity to connect to King Street Station services via station mezzanine Could activate Union Station Limited TOD potential *Summary of feedback from agency and community stakeholders. Images are illustrative only. 86
87 Level 2 alternatives West Seattle/Duwamish ST3 Representative Project Pigeon Ridge/West Seattle Tunnel Oregon Street/Alaska Junction/Elevated Oregon Street/Alaska Junction/Tunnel (new) Golf Course/Alaska Junction/Tunnel (modified) 87
88 West Seattle/Duwamish Level 2 alternatives 88
89 Medium Medium Evaluation Measures ST3 Representative Project Pigeon Ridge/West Seattle Oregon Street/Alaska Junction/ Golf Course/Alaska Junction/ Oregon Street/Alaska Junction/ Tunnel Elevated Tunnel Tunnel Provide high quality rapid, reliable, and efficient peak and off-peak light rail transit service to communities in the project corridors defined in ST3. Potential Service Interruptions Higher Higher Higher Higher Higher Travel Times (minutes) 7 to 8 7 to 8 7 to 8 7 to 8 7 to 8 Improve regional mobility by increasing connectivity and capacity through downtown Seattle to meet projected transit demand. Network Integration Medium Medium Medium Medium Medium Passenger Carrying Capacity Medium Medium Medium Medium Medium Ridership Potential (2040 pop/emp) (1) 11,200 12,500 12,000 10,700 12,500 Connect regional centers as described in adopted regional and local land use, transportation, and economic development plans and Sound Transit s Long-Range Plan. Regional Growth Centers Served N/A (3) N/A N/A N/A N/A Manufacturing/Industrial Centers Served Accommodates Future LRT Extension Lower Medium Lower Higher Medium Implement a system that is consistent with the ST3 Plan that established transit mode, corridor, and station locations and that is technically feasible and financially sustainable to build, operate, and maintain. Mode, Route and Stations per ST3 Higher Higher Higher Medium Higher Potential ST3 Schedule Effects Higher Lower Higher Lower Lower Potential ST3 Operating Plan Effects Higher Higher Higher Higher Higher Engineering Constraints Medium Lower Medium Medium Higher Constructability Issues Lower Lower Lower Lower Medium Operational Constraints Medium Higher Medium Medium Medium Conceptual Capital Cost Comparison - $1,200M increase Similar $700M increase $500M increase Operating Cost Impacts Higher Medium Higher Medium Medium Expand mobility for the corridor and region s residents, which include transit dependent, low income, and minority populations. Opportunities for Low-Income/Minority Medium Medium Medium (activity nodes/subsidized rental units) (1) 15% 13% 14% 15% 13% Low-Income Population (1/2) 25% / 21% 24% / 21% 23% / 21% 26% / 21% 23% / 21% Minority Population (1/2) 22% / 26% 23% / 26% 21% / 26% 23% / 26% 21% / 26% Youth Population (1/2) 13% / 17% 14% / 17% 14% / 17% 13% / 17% 14% / 17% Elderly Population (1/2) 16% / 13% 15% / 13% 15% / 13% 16% / 13% 15% / 13% Limited English Proficiency Population (1/2) 3% / 4% 3% / 4% 3% / 4% 3% / 4% 3% / 4% Disabled Population (1/2) 9% / 9% 9% / 9% 9% / 9% 9% / 9% 9% / 9% (1) Within station walksheds (2) Within 15 minute ride on connecting high frequency transit (3) NA = Measure not applicable to this segment West Seattle/Duwamish Level 2 alternatives evaluation Part 1 of 2 Lower Medium Higher 89
90 Medium Medium Evaluation Measures ST3 Representative Project Pigeon Ridge/West Seattle Oregon Street/Alaska Junction/ Golf Course/Alaska Junction/ Oregon Street/Alaska Junction/ Tunnel Elevated Tunnel Tunnel Provide high quality rapid, reliable, and efficient peak and off-peak light rail transit service to communities in the project corridors defined in ST3. Potential Service Interruptions Higher Higher Higher Higher Higher Travel Times (minutes) 7 to 8 7 to 8 7 to 8 7 to 8 7 to 8 Improve regional mobility by increasing connectivity and capacity through downtown Seattle to meet projected transit demand. Network Integration Medium Medium Medium Medium Medium Passenger Carrying Capacity Complicates Medium future Medium Complicates Medium future Best accommodates Medium Medium Ridership Potential (2040 pop/emp) (1) LRT 11,200 extension 12,500 LRT 12,000 extension 10,700 12,500 future LRT extension Connect regional centers as described in adopted regional and local land use, transportation, and economic development plans and Sound Transit s Long-Range Plan. Regional Growth Centers Served N/A (3) N/A N/A N/A N/A Manufacturing/Industrial Centers Served Accommodates Future LRT Extension Lower Medium Lower Higher Medium Implement a system that is consistent with the ST3 Plan that established transit mode, corridor, and station locations and that is technically feasible and financially sustainable to build, operate, and maintain. Mode, Route and Stations per ST3 Higher Higher Higher Medium Higher Potential ST3 Schedule Effects Higher Lower Higher Lower Lower Potential ST3 Operating Plan Effects Higher Higher Higher Higher Higher Engineering Constraints Medium Lower Medium Medium Higher Constructability Issues Lower Lower Lower Lower Medium Operational Constraints Medium Higher Medium Medium Medium Conceptual Capital Cost Comparison - $1,200M increase Similar $700M increase $500M increase Operating Cost Impacts Higher Medium Higher Medium Medium Expand mobility for the corridor and region s residents, which include transit dependent, low income, and minority populations. Opportunities for Low-Income/Minority Medium Medium Medium (activity nodes/subsidized rental units) (1) 15% 13% 14% 15% 13% Low-Income Population (1/2) 25% / 21% 24% / 21% 23% / 21% 26% / 21% 23% / 21% Minority Population (1/2) 22% / 26% 23% / 26% 21% / 26% 23% / 26% 21% / 26% Youth Population (1/2) 13% / 17% 14% / 17% 14% / 17% 13% / 17% 14% / 17% Elderly Population (1/2) 16% / 13% 15% / 13% 15% / 13% 16% / 13% 15% / 13% Limited English Proficiency Population (1/2) 3% / 4% 3% / 4% 3% / 4% 3% / 4% 3% / 4% Disabled Population (1/2) 9% / 9% 9% / 9% 9% / 9% 9% / 9% 9% / 9% (1) Within station walksheds (2) Within 15 minute ride on connecting high frequency transit (3) NA = Measure not applicable to this segment Lower West Seattle/Duwamish Level 2 alternatives evaluation Accommodates Future LRT Extension Medium Higher = Key Differentiators 90
91 Medium Medium Evaluation Measures ST3 Representative Project Pigeon Ridge/West Seattle Oregon Street/Alaska Junction/ Golf Course/Alaska Junction/ Oregon Street/Alaska Junction/ Tunnel Elevated Tunnel Tunnel Provide high quality rapid, reliable, and efficient peak and off-peak light rail transit service to communities in the project corridors defined in ST3. Potential Service Interruptions Higher Higher Higher Higher Higher Travel Times (minutes) 7 to 8 7 to 8 7 to 8 7 to 8 7 to 8 Improve regional mobility by increasing connectivity and capacity through downtown Seattle to meet projected transit demand. Network Integration Medium Medium Medium Medium Medium Passenger Carrying Capacity Medium Medium Medium Medium Medium Ridership Potential (2040 pop/emp) (1) 11,200 12,500 12,000 10,700 12,500 Connect regional centers as described in adopted regional and local land use, transportation, and economic development plans and Sound Transit s Long-Range Plan. Regional Growth Centers Served N/A (3) N/A Tunnel options N/A could N/A N/A Manufacturing/Industrial Centers Served 1 1 affect schedule Accommodates Future LRT Extension Lower Medium Lower Higher Medium Implement a system that is consistent with the ST3 Plan that established transit mode, corridor, and station locations and that is technically feasible and financially sustainable to build, operate, and maintain. Mode, Route and Stations per ST3 Higher Higher Higher Medium Higher Potential ST3 Schedule Effects Higher Lower Higher Lower Lower Potential ST3 Operating Plan Effects Higher Higher Higher Higher Higher Engineering Constraints Medium Lower Medium Medium Higher Constructability Issues Lower Lower Lower Lower Medium Operational Constraints Medium Higher Medium Medium Medium Conceptual Capital Cost Comparison - $1,200M increase Similar $700M increase $500M increase Operating Cost Impacts Higher Medium Higher Medium Medium Expand mobility for the corridor and region s residents, which include transit dependent, low income, and minority populations. Opportunities for Low-Income/Minority Medium Medium Medium (activity nodes/subsidized rental units) (1) 15% 13% 14% 15% 13% Low-Income Population (1/2) 25% / 21% 24% / 21% 23% / 21% 26% / 21% 23% / 21% Minority Population (1/2) 22% / 26% 23% / 26% 21% / 26% 23% / 26% 21% / 26% Youth Population (1/2) 13% / 17% 14% / 17% 14% / 17% 13% / 17% 14% / 17% Elderly Population (1/2) 16% / 13% 15% / 13% 15% / 13% 16% / 13% 15% / 13% Limited English Proficiency Population (1/2) 3% / 4% 3% / 4% 3% / 4% 3% / 4% 3% / 4% Disabled Population (1/2) 9% / 9% 9% / 9% 9% / 9% 9% / 9% 9% / 9% (1) Within station walksheds (2) Within 15 minute ride on connecting high frequency transit (3) NA = Measure not applicable to this segment Lower West Seattle/Duwamish Level 2 alternatives evaluation Potential ST3 Schedule Effects Medium Higher = Key Differentiators 91
92 Medium Medium Evaluation Measures ST3 Representative Project Pigeon Ridge/West Seattle Oregon Street/Alaska Junction/ Golf Course/Alaska Junction/ Oregon Street/Alaska Junction/ Tunnel Elevated Tunnel Tunnel Provide high quality rapid, reliable, and efficient peak and off-peak light rail transit service to communities in the project corridors defined in ST3. Potential Service Interruptions Higher Higher Higher Higher Higher Travel Times (minutes) 7 to 8 7 to 8 7 to 8 7 to 8 7 to 8 Improve regional mobility by increasing connectivity and capacity through downtown Seattle to meet projected transit demand. Network Integration Medium Most engineering Medium constraints Medium Medium Medium Passenger Carrying Capacity Medium (tunnel through unstable Medium slopes, Medium Medium Fewer engineering Medium Ridership Potential (2040 pop/emp) (1) 11,200 12,500 12,000 10,700 12,500 widest water crossing, wide constraints (avoids Pigeon Connect regional centers as described in adopted regional and local land use, transportation, and economic development plans and Sound Transit s Long-Range Plan. Regional Growth Centers Served N/A (3) Union Pacific Argo N/Arailyard N/A N/A Point steep slope) N/A Manufacturing/Industrial Centers Served 1 crossing, high voltage 1 lines, etc.) Accommodates Future LRT Extension Lower Medium Lower Higher Medium Implement a system that is consistent with the ST3 Plan that established transit mode, corridor, and station locations and that is technically feasible and financially sustainable to build, operate, and maintain. Mode, Route and Stations per ST3 Higher Higher Higher Medium Higher Potential ST3 Schedule Effects Higher Lower Higher Lower Lower Potential ST3 Operating Plan Effects Higher Higher Higher Higher Higher Engineering Constraints Medium Lower Medium Medium Higher Constructability Issues Lower Lower Lower Lower Medium Operational Constraints Medium Higher Medium Medium Medium Conceptual Capital Cost Comparison - $1,200M increase Similar $700M increase $500M increase Operating Cost Impacts Higher Medium Higher Medium Medium Expand mobility for the corridor and region s residents, which include transit dependent, low income, and minority populations. Opportunities for Low-Income/Minority Medium Medium Medium (activity nodes/subsidized rental units) (1) 15% 13% 14% 15% 13% Low-Income Population (1/2) 25% / 21% 24% / 21% 23% / 21% 26% / 21% 23% / 21% Minority Population (1/2) 22% / 26% 23% / 26% 21% / 26% 23% / 26% 21% / 26% Youth Population (1/2) 13% / 17% 14% / 17% 14% / 17% 13% / 17% 14% / 17% Elderly Population (1/2) 16% / 13% 15% / 13% 15% / 13% 16% / 13% 15% / 13% Limited English Proficiency Population (1/2) 3% / 4% 3% / 4% 3% / 4% 3% / 4% 3% / 4% Disabled Population (1/2) 9% / 9% 9% / 9% 9% / 9% 9% / 9% 9% / 9% (1) Within station walksheds (2) Within 15 minute ride on connecting high frequency transit (3) NA = Measure not applicable to this segment West Seattle/Duwamish Level 2 alternatives evaluation Engineering Constraints Lower Medium Higher = Key Differentiators 92
93 Medium Medium Evaluation Measures ST3 Representative Project Pigeon Ridge/West Seattle Oregon Street/Alaska Junction/ Golf Course/Alaska Junction/ Oregon Street/Alaska Junction/ Tunnel Elevated Tunnel Tunnel Provide high quality rapid, reliable, and efficient peak and off-peak light rail transit service to communities in the project corridors defined in ST3. Potential Service Interruptions Higher Higher Higher Higher Higher Travel Times (minutes) 7 to 8 7 to 8 7 to 8 7 to 8 7 to 8 Improve regional mobility by increasing connectivity and capacity through downtown Seattle to meet projected transit demand. Network Integration Medium Medium Medium Medium Medium Passenger Carrying Capacity Medium Medium Medium Medium Medium Ridership Potential (2040 pop/emp) (1) 11,200 12,500 12,000 10,700 12,500 Connect regional centers as described in adopted regional and local land use, transportation, and economic development plans and Sound Transit s Long-Range Plan. Regional Growth Centers Served N/A (3) N/A N/A N/A N/A Manufacturing/Industrial Centers Served Accommodates Future LRT Extension Lower Medium Lower Higher Medium Implement a system that is consistent with the ST3 Plan that established transit mode, corridor, and station locations and that is technically feasible and financially sustainable to build, operate, and maintain. Mode, Route and Stations per ST3 Higher Higher Higher Medium Higher Potential ST3 Schedule Effects Higher Lower Higher Higher Higher cost cost alternatives alternatives; Lower Lower Potential ST3 Operating Plan Effects Higher Higher Higher requires 3 rd Party funding Higher Higher Engineering Constraints Medium Lower Medium Medium Higher Constructability Issues Lower Lower Lower Lower Medium Operational Constraints Medium Higher Medium Medium Medium Conceptual Capital Cost Comparison - $1,200M increase Similar $700M increase $500M increase Operating Cost Impacts Higher Medium Higher Medium Medium Expand mobility for the corridor and region s residents, which include transit dependent, low income, and minority populations. Opportunities for Low-Income/Minority Medium Medium Medium (activity nodes/subsidized rental units) (1) 15% 13% 14% 15% 13% Low-Income Population (1/2) 25% / 21% 24% / 21% 23% / 21% 26% / 21% 23% / 21% Minority Population (1/2) 22% / 26% 23% / 26% 21% / 26% 23% / 26% 21% / 26% Youth Population (1/2) 13% / 17% 14% / 17% 14% / 17% 13% / 17% 14% / 17% Elderly Population (1/2) 16% / 13% 15% / 13% 15% / 13% 16% / 13% 15% / 13% Limited English Proficiency Population (1/2) 3% / 4% 3% / 4% 3% / 4% 3% / 4% 3% / 4% Disabled Population (1/2) 9% / 9% 9% / 9% 9% / 9% 9% / 9% 9% / 9% (1) Within station walksheds (2) Within 15 minute ride on connecting high frequency transit (3) NA = Measure not applicable to this segment Lower West Seattle/Duwamish Level 2 alternatives evaluation Conceptual Capital Cost Comparison Medium Higher = Key Differentiators 93
94 Evaluation Measures ST3 Representative Project Pigeon Ridge/West Seattle Oregon Street/Alaska Junction/ Golf Course/Alaska Junction/ Oregon Street/Alaska Junction/ Tunnel Elevated Tunnel Tunnel Encourage equitable and sustainable urban growth in station areas through support of transit-oriented development, station access, and modal integration in a manner that is consistent with local land use plans and policies. Compatibility with Urban Centers/Villages (1) Medium Medium Medium Medium Lower Station Land Use Plan Consistency Higher Higher Higher Higher Higher Activity Nodes Served (1) Passenger Transfers Medium Higher Medium Medium Higher Bus/Rail and Rail/Rail Integration (1) Medium Higher Medium Medium Higher Bicycle Accessibility (1) Higher Higher Higher Higher Higher Pedestrian/Limited Mobility Accessibility (1) Medium Higher Higher Higher Higher Development Potential (1) Medium Medium Medium Higher Medium Equitable Development Opportunities Lower Lower Medium Medium Higher Preserve and promote a healthy environment and economy by minimizing adverse impacts on the natural, built and social environments through sustainable practices. Historic Properties/Landmarks (2) Potential for effects to Archaeological Resources (1) Lower Lower Lower Lower Lower Parks and Recreational Resources Effects (acres) Water Resource Effects (acres) < 0.1 < 0.1 < 0.1 < 0.1 < 0.1 Fish and Wildlife Habitat Effects (acres) Hazardous Materials Sites (1) Visual Effects Lower Medium Lower Medium Medium Noise and Vibration Sensitive Receivers (1) Lower Lower Lower Medium Lower Potentially Affected Properties Higher Higher Lower Higher Lower Residential Unit Displacements Medium Lower Lower Higher Lower Square Feet of Business Displacements Higher Medium Lower Higher Medium Construction Impacts Lower Higher Lower Medium Medium Burden on Low-Income/Minority Higher Higher Higher Higher Higher Traffic Circulation and Access Effects Lower Higher Medium Higher Medium Effects on Existing Transportation Facilities Lower Higher Medium Medium Higher Effects on Freight Movement Medium Medium Medium Medium Lower Business and Commerce Effects Medium Higher Lower Medium Medium (1) Within station walksheds and/or defined buffer of alignment (2) On properties that overlap with the project footprint Lower West Seattle/Duwamish Level 2 alternatives evaluation Part 2 of 2 Medium Higher 94
95 Evaluation Measures ST3 Representative Project Pigeon Ridge/West Seattle Oregon Street/Alaska Junction/ Golf Course/Alaska Junction/ Oregon Street/Alaska Junction/ Tunnel Elevated Tunnel Tunnel Encourage equitable and sustainable urban growth in station areas through support of transit-oriented development, station access, and modal integration in a manner that is consistent with local land use plans and policies. Compatibility with Urban Centers/Villages (1) Medium Medium Medium Medium Lower Station Land Use Plan Consistency Higher Higher Higher Higher Higher Activity Nodes Served (1) Passenger Transfers Medium Higher Medium Medium Higher Bus/Rail and Rail/Rail Integration (1) Medium Higher Medium Medium Higher Bicycle Accessibility (1) Higher Higher Higher Higher Higher Pedestrian/Limited Mobility Accessibility (1) Medium Higher Higher Higher Higher Development Potential (1) Medium Most Medium effects to Medium Higher Medium Equitable Development Opportunities Lower Duwamish Lower Greenbelt Medium Medium Higher Preserve and promote a healthy environment and economy by minimizing adverse impacts on the natural, built and social environments through sustainable practices. Historic Properties/Landmarks (2) Potential for effects to Archaeological Resources (1) Lower Lower Lower Lower Lower Parks and Recreational Resources Effects (acres) Water Resource Effects (acres) < 0.1 < 0.1 < 0.1 < 0.1 < 0.1 Fish and Wildlife Habitat Effects (acres) Hazardous Materials Sites (1) Visual Effects Lower Medium Lower Medium Medium Noise and Vibration Sensitive Receivers (1) Lower Lower Lower Medium Lower Potentially Affected Properties Higher Higher Lower Higher Lower Residential Unit Displacements Medium Lower Lower Higher Lower Square Feet of Business Displacements Higher Medium Lower Higher Medium Construction Impacts Lower Higher Lower Medium Medium Burden on Low-Income/Minority Higher Higher Higher Higher Higher Traffic Circulation and Access Effects Lower Higher Medium Higher Medium Effects on Existing Transportation Facilities Lower Higher Medium Medium Higher Effects on Freight Movement Medium Medium Medium Medium Lower Business and Commerce Effects Medium Higher Lower Medium Medium (1) Within station walksheds and/or defined buffer of alignment (2) On properties that overlap with the project footprint Lower West Seattle/Duwamish Level 2 alternatives evaluation Fish and Wildlife Habitat Effects Medium Higher = Key Differentiators 95
96 Evaluation Measures ST3 Representative Project Pigeon Ridge/West Seattle Oregon Street/Alaska Junction/ Golf Course/Alaska Junction/ Oregon Street/Alaska Junction/ Tunnel Elevated Tunnel Tunnel Encourage equitable and sustainable urban growth in station areas through support of transit-oriented development, station access, and modal integration in a manner that is consistent with local land use plans and policies. Compatibility with Urban Centers/Villages (1) Medium Medium Medium Medium Lower Station Land Use Plan Consistency Higher Higher Higher Higher Higher Activity Nodes Served (1) Passenger Transfers Medium Higher Medium Medium Higher Bus/Rail and Rail/Rail Integration (1) Medium Higher Medium Medium Higher Bicycle Accessibility (1) Higher Higher Higher Higher Higher Pedestrian/Limited Mobility Accessibility (1) Medium Higher Higher Higher Higher Development Potential (1) Medium Medium Medium Higher Medium Equitable Development Opportunities Lower Lower Medium Medium Higher High guideway High guideway Preserve and promote a healthy environment and economy by minimizing adverse impacts on the natural, built and social environments through sustainable practices. Historic Properties/Landmarks (2) 1 1 along Genesee; 1 1 along Genesee; Low guideway Low guideway 2 Potential for effects to Archaeological Resources (1) Lower Lower elevated Lower along Lower elevated Lower Avalon along Genesee along Genesee Parks and Recreational Resources Effects (acres) Oregon 1.5and 44th 2.8 Station 0.6 Water Resource Effects (acres) < 0.1 < 0.1 < 0.1 < 0.1 < 0.1 Fish and Wildlife Habitat Effects (acres) Hazardous Materials Sites (1) Visual Effects Lower Medium Lower Medium Medium Noise and Vibration Sensitive Receivers (1) Lower Lower Lower Medium Lower Potentially Affected Properties Higher Higher Lower Higher Lower Residential Unit Displacements Medium Lower Lower Higher Lower Square Feet of Business Displacements Higher Medium Lower Higher Medium Construction Impacts Lower Higher Lower Medium Medium Burden on Low-Income/Minority Higher Higher Higher Higher Higher Traffic Circulation and Access Effects Lower Higher Medium Higher Medium Effects on Existing Transportation Facilities Lower Higher Medium Medium Higher Effects on Freight Movement Medium Medium Medium Medium Lower Business and Commerce Effects Medium Higher Lower Medium Medium (1) Within station walksheds and/or defined buffer of alignment (2) On properties that overlap with the project footprint Lower West Seattle/Duwamish Level 2 alternatives evaluation Visual Effects Medium Higher = Key Differentiators 96
97 Evaluation Measures ST3 Representative Project Pigeon Ridge/West Seattle Oregon Street/Alaska Junction/ Golf Course/Alaska Junction/ Oregon Street/Alaska Junction/ Tunnel Elevated Tunnel Tunnel Encourage equitable and sustainable urban growth in station areas through support of transit-oriented development, station access, and modal integration in a manner that is consistent with local land use plans and policies. Compatibility with Urban Centers/Villages (1) Medium Medium Medium Medium Lower Station Land Use Plan Consistency Higher Higher Higher Higher Higher Activity Nodes Served (1) Passenger Transfers Medium Higher Medium Medium Higher Bus/Rail and Rail/Rail Integration (1) Medium Higher Medium Medium Higher Bicycle Accessibility (1) Higher Higher Higher Higher Higher Pedestrian/Limited Mobility Accessibility (1) Medium Higher Higher Higher Higher Development Potential (1) Medium Medium Medium Higher Medium Equitable Development Opportunities Lower Lower Medium Medium Higher Preserve and promote a healthy environment and economy by minimizing adverse Elevated impacts guideway on the natural, and built station and social environments through sustainable practices. Tunnel station at Fauntleroy Historic Properties/Landmarks (2) at 44 Potential for effects to Archaeological Resources (1) Lower increases residential lessens residential and Lower Lower Lower Lower Parks and Recreational Resources Effects (acres) 1.5 and business 3.5 effects business effects 0.6 Water Resource Effects (acres) < 0.1 < 0.1 < 0.1 < 0.1 < 0.1 Fish and Wildlife Habitat Effects (acres) Hazardous Materials Sites (1) Visual Effects Lower Medium Lower Medium Medium Noise and Vibration Sensitive Receivers (1) Lower Lower Lower Medium Lower Potentially Affected Properties Higher Higher Lower Higher Lower Residential Unit Displacements Medium Lower Lower Higher Lower Square Feet of Business Displacements Higher Medium Lower Higher Medium Construction Impacts Lower Higher Lower Medium Medium Burden on Low-Income/Minority Higher Higher Higher Higher Higher Traffic Circulation and Access Effects Lower Higher Medium Higher Medium Effects on Existing Transportation Facilities Lower Higher Medium Medium Higher Effects on Freight Movement Medium Medium Medium Medium Lower Business and Commerce Effects Medium Higher Lower Medium Medium (1) Within station walksheds and/or defined buffer of alignment (2) On properties that overlap with the project footprint Lower West Seattle/Duwamish Level 2 alternatives evaluation Residential and Business Displacements Medium Higher = Key Differentiators 97
98 Evaluation Measures ST3 Representative Project Pigeon Ridge/West Seattle Oregon Street/Alaska Junction/ Golf Course/Alaska Junction/ Oregon Street/Alaska Junction/ Tunnel Elevated Tunnel Tunnel Encourage equitable and sustainable urban growth in station areas through support of transit-oriented development, station access, and modal integration in a manner that is consistent with local land use plans and policies. Compatibility with Urban Centers/Villages (1) Medium Medium Medium Medium Lower Station Land Use Plan Consistency Higher Higher Higher Higher Higher Activity Nodes Served (1) Passenger Transfers Medium Higher Medium Medium Higher Bus/Rail and Rail/Rail Integration (1) Medium Higher Medium Medium Higher Bicycle Accessibility (1) Higher Higher Higher Higher Higher Pedestrian/Limited Mobility Accessibility (1) Medium Higher Higher Higher Higher Development Potential (1) Medium Medium Medium Higher Medium Equitable Development Opportunities Lower Lower Medium Medium Higher Preserve and promote a healthy environment and economy by minimizing adverse impacts on the natural, built and social environments through sustainable practices. Historic Properties/Landmarks (2) Potential for effects to Archaeological Resources (1) Lower Lower Lower Lower Lower Parks and Recreational Resources Effects (acres) Water Resource Effects (acres) < 0.1 < 0.1 < 0.1 < 0.1 < 0.1 Fish and Wildlife Habitat Effects (acres) Hazardous Materials Sites (1) Visual Effects Lower Medium Lower Medium Medium Noise and Vibration Sensitive Receivers (1) Lower Lower Lower Medium Lower Potentially Affected Properties Higher Higher Lower Higher Lower Residential Unit Displacements Medium Lower Lower Elevated guideway on Higher north side of West Seattle Lower bridge; Square Feet of Business Displacements Higher Medium Lower affects freight, port terminal Higher facilities during construction Medium Construction Impacts Lower Higher Lower Medium Medium Burden on Low-Income/Minority Higher Higher Higher Higher Higher Traffic Circulation and Access Effects Lower Higher Medium Higher Medium Effects on Existing Transportation Facilities Lower Higher Medium Medium Higher Effects on Freight Movement Medium Medium Medium Medium Lower Business and Commerce Effects Medium Higher Lower Medium Medium (1) Within station walksheds and/or defined buffer of alignment (2) On properties that overlap with the project footprint Lower West Seattle/Duwamish Level 2 alternatives evaluation Effects on Freight Movement Medium Higher = Key Differentiators 98
99 Avalon-Genesee- Delridge Duwamish Crossing Alaska Junction West Seattle/Duwamish Key differentiators By sub-segment 99

100 Alaska Junction: Key differentiators Station location Residential/business effects Ease of future extension Guideway height in Delridge West Seattle/Duwamish Key differentiators Alaska Junction 100
101 Key differentiators Alaska Junction Alternative ST3 Representative Project Key differentiators Pigeon Ridge / West Seattle Tunnel Tunnel station at 42 nd Ave SW Facilitates low guideway in Delridge (along Genesee) Includes tunnel; requires 3 rd Party funding Oregon Street / Alaska Junction / Elevated Elevated station at 44 th Ave SW Increases residential and business effects Complicates future extension south Golf Course / Alaska Junction / Tunnel Oregon Street / Alaska Junction / Tunnel Tunnel station at Fauntleroy Way SW Lessens residential and business effects Facilitates low guideway in Delridge (along Genesee) Includes tunnel; requires 3 rd Party funding Tunnel station at 44 th Ave SW; tunnel portal in 37 th Ave SW vicinity Includes tunnel; requires 3 rd Party funding 101

102 Avalon-Genesee-Delridge: Key differentiators Station location Residential/business effects Guideway height West Seattle/Duwamish Key differentiators Avalon-Genesee-Delridge 102
103 Key differentiators Avalon-Genesee-Delridge Alternative ST3 Representative Project Key differentiators Pigeon Ridge / West Seattle Tunnel Furthest south Delridge station location Lessens residential and business effects in Delridge Low guideway along Genesee; tunnel Avalon station Oregon Street / Alaska Junction / Elevated Delridge station south of SW Andover Street High guideway along Genesee; elevated Avalon station Golf Course / Alaska Junction / Tunnel Off-street Delridge station west of Delridge Way SW Low guideway along Genesee; tunnel Avalon station Oregon Street / Alaska Junction / Tunnel Delridge station south of SW Andover Street High guideway along Genesee; elevated Avalon station 103

104 Duwamish Crossing: Key differentiators Crossing location Engineering constraints Fish and wildlife effects Freight movement West Seattle/Duwamish Key differentiators Duwamish Crossing 104
105 Key differentiators Duwamish Crossing Alternative ST3 Representative Project Key differentiators Pigeon Ridge / West Seattle Tunnel Bridge crossing near Idaho Street; south of Harbor Island Most engineering constraints (tunnel through unstable slopes, widest water crossing, wide Union Pacific Argo railyard crossing, high voltage lines etc.) Most effects to Duwamish Greenbelt Oregon Street / Alaska Junction / Elevated Golf Course / Alaska Junction / Tunnel Bridge crossing on south side of West Seattle bridge Some engineering constraints (Pigeon Point steep slope) Some effects to Duwamish Greenbelt (Pigeon Point) Oregon Street / Alaska Junction / Tunnel Bridge crossing on north side of West Seattle bridge Fewer engineering constraints (avoids Pigeon Point steep slope) Avoids effects to Duwamish Greenbelt Affects freight, port terminal facilities during construction 105
106 Summary West Seattle / Duwamish Alternative Key findings Cost comparison* Schedule comparison* ST3 Representative Project Oregon Street / Alaska Junction / Elevated 3 elevated stations Increases residential/business effects at Junction Complicates future extension south High guideway along Genesee Similar Higher Oregon Street / Alaska Junction / Tunnel 1 tunnel station; 2 elevated stations High guideway along Genesee Fewer engineering constraints Affects freight, port terminal facilities during construction Includes tunnel; requires 3 rd Party funding + $500M Lower Golf Course / Alaska Junction / Tunnel 2 tunnel stations; 1 elevated station Lessens residential/business effects at Junction Low guideway along Genesee Includes tunnel; requires 3 rd Party funding + $700M Lower Pigeon Ridge / West Seattle Tunnel 2 tunnels; 2 tunnel stations; 1 elevated station Most engineering constraints Most effects to Duwamish Greenbelt Low guideway along Genesee Lessens residential and business effects in Delridge Includes two tunnels; requires 3 rd Party funding + $1,200M Lower *Cost compared to cost of ST3 Representative Project for this segment. Schedule compared to overall ST3 schedule for this extension. 106
107 * Station Charrette Feedback Delridge Station Center Delridge Elevated Not further developed in charrette Farthest from community center and amenities Challenging for transit integration Challenging non-motorized access and wayfinding Limited TOD potential W Side Delridge Elevated Concerns about station height and bulk, compatibility with neighborhood Good transit integration, but would require access enhancements to east Good non-motorized access Some TOD potential 25 th Avenue S Elevated Lower guideway and station could be more compatible with neighborhood Close to community center and amenities Good transit integration, but would require wayfinding and access enhancements Considerable potential for TOD in partnership Genesee Elevated Lower guideway and station more compatible with neighborhood Directly serves community center and amenities, but affects skate park Excellent transit integration and non-motorized access Limited TOD potential *Summary of feedback from agency and community stakeholders. Images are illustrative only. 107
108 * Station Charrette Feedback Avalon Station South Side Genesee Elevated Concern about station height and bulk, compatibility with neighborhood Concerns about potential traffic queuing lengths and intersection safety Challenging transit integration Limited non-motorized access; concerns about pedestrian and cyclist safety Limited TOD potential Blah Fauntleroy Span Elevated and Cut and Cover Concern about elevated station height and bulk, compatibility with neighborhood, but potential for gateway expression Concerns about potential traffic queuing lengths and intersection safety Challenging transit integration Good non-motorized access by siting entries on both sides of Fauntleroy Some TOD potential *Summary of feedback from agency and community stakeholders. Images are illustrative only. 108
109 * Station Charrette Feedback Alaska Junction Station SW Alaska St Elevated Not explored further in charrette Concern about station height and bulk, compatibility with neighborhood Good transit integration and non-motorized access Some TOD potential 44 th Ave SW Elevated or Tunnel Concern about effects to neighborhood character if elevated Permanent effects to business parking likely Excellent transit integration Good non-motorized access Limited TOD potential 42 nd /41 st Ave SW Tunnel Most compatible with neighborhood character Great urban design potential Opportunities for enhanced public realm Excellent transit integration and non-motorized access Considerable TOD potential Fauntleroy Way SW Tunnel More distant from heart of business district, but closer to new development areas and amenities Somewhat challenging for transit integration Good non-motorized access Some TOD potential *Summary of feedback from agency and community stakeholders. Images are illustrative only. 109

110 Next steps 110

111 Community engagement and collaboration 111
112 Next steps SAG Meeting #8 Sep 5 Level 2 evaluation results Neighborhood Forum/Open House West Seattle Neighborhood Forum/Open House Downtown Neighborhood Forum/Open House Ballard Sep 8 Sep 11 Sep 17 Level 2 evaluation results Level 2 evaluation results Level 2 evaluation results SAG Meeting #9 Sep 26 Level 2 recommendations ELG Meeting #4 Oct 5 Level 2 recommendations 112

113 soundtransit.org/wsblink