Early LNG Program and LN 2 Cryogenic Flow Measurement Facility at NIST
|
|
|
- Cassandra Hampton
- 5 years ago
- Views:
Transcription
1 Early LNG Program and LN 2 Cryogenic Flow Measurement Facility at NIST Dan Friend and Mike Lewis Thermophysical Properties Division Material Measurement Laboratory Boulder, CO (USA) LNG Metrology Workshop 9 November 2010 Stockholm, Sweden


2 (NIST) NIST is the National Metrology Institute (NMI) for the U.S., and signatory to the CIPM MRA Non-regulatory agency within U.S. Department of Commerce Founded in 1901 as National Bureau of Standards Article I, Section 8: The Congress shall have the power to coin money, regulate the value thereof, and of foreign coin, and fix the standard of weights and measures Mission to promote U.S. innovation and industrial competitiveness by advancing measurement science, standards, and technology Apr 2010 in ways National Institute that of Standards enhance and Technology economic security and improve our quality of life Aug 09


3 LNG at NIST (NBS):1970 to 1985 Sponsors and Collaborators Groupe International des Importateurs de Gaz Naturel Liquéfié American Gas Association Gas Research Institute DOC Maritime Administration American Bureau of Shipping Western LNG Terminal Assoc. Tokyo Gas Co. Columbia LNG Corp. El Paso LNG Co. Ruhrgas LNG
4 LNG Materials and Fluids Materials Structural Materials: Aluminum Alloys; Invar; Nickel Steels, Thermal Insulators: Polystyrene; Polyvinyl Chloride; Balsa, Concrete: Elastic (Young s Modulus); Thermal; Mechanical Nonmetallic Laminates: Cotton fabric/phenolic; glass mat/epoxy Fluids Pure Fluids: methane, ethane, (charts, etc.) Fluid Mixtures: LNG mixtures, binary mixtures See: Cryogenic Material Properties Database (NIST SRD #152) NIST Chemistry WebBook (NIST SRD #69) NIST REFPROP (NIST SRD #23)

5 Section 1 LNG Measurement A User s Manual for Custody Transfer (1985) Physical Properties SI System Pure Fluid Properties Combustion Enthalpies
 Sample conditioner (vaporizing) Gas analyzer (GC, MS, integrator, packings, etc.")
6 LNG Measurement Measurement Elements 1. Measurement Process Applied to LNG 2. Sampling and Analysis Sample probe (pitot, side tube, ) Sample conditioner (vaporizing) Gas analyzer (GC, MS, integrator, packings, etc. ) Operating parameters/procedures Laboratory tests LNG Flow Loop Shipboard Tests (at Canvey Island, England) U(3σ, heating value) = 0.3 %
7 LNG Measurement Measurement Elements 3. Calorific Value: calorimeters, calculations, comparisons 4. Density Values: Cryogenic density reference system calibrations of LNG densimeter transfer standards U (LCH4) = % Portable Reference Densimeter tests of commercial LNG densimeters Experimental LNG Density NBS densimeters; pure fluids; binary mixtures, multicomponents (NBS Monograph 172, 1983) Mathematical Models for LNG Densities ECS, HS, Klosek & McKinley (r), cell See: ASTM D (2010) Standard Specification for LNG Density Calculation Models GERG EOS (2004) NIST REFPROP (NIST SRD #23)
8 LNG Measurement Measurement Elements 5. LNG Volume Liquid Level Measurement: capacitance gauges, cable gages, bubbler gauges Volume of Membrane-Type LNG Ship Tanks U = 0.1 % Volume of Freestanding Prismatic LNG Ship Tanks U = 0.1 % Volume of Spherical LNG Ship Tanks Volume of Cylindrical LNG Shore Tanks U = % Volume from Totalized Flow Rate Metering LNG Measurement Station: flowmeter, densimeter, calorimeter, gravitometer 5 cm to 81 cm (2 in to 32 in) flow meter scaleup
, calculated calorific value (0.77 %), measured calorific value (0.77 %) Ship Loading/Unloading (0.2 % to 0.4 % calorific value) Pipeline Metering (0.65 % to 0.")
9 Applications LNG Measurement Measurement Uncertainties: volume, gas analysis (0.09 %), calculated LNG density (0.23 %), measured density (0.26 %), calculated calorific value (0.77 %), measured calorific value (0.77 %) Ship Loading/Unloading (0.2 % to 0.4 % calorific value) Pipeline Metering (0.65 % to 0.95 %) Landbased Storage (0.34 % to 0.65 %)
10 NIST Cryogenic Flow Measurement Facility Testing and Calibration Services
11 Why LN2 Calibrations? LN2 vs Water Calibrations Turbine Flowmeter Turbine Flowmeter Meter Factor, % deviation Liquid nitrigen data Water data Meter Factor, % deviation Liquid nitrogen test data Water test data Water data Liquid nitrogen data Liquid nitrogen test data Water test data Flowrate, % of maximum flow Flowrate, % of maximum flow
12 Capabilities Flow Rate Mass : 0.95 to 9.5 kg/s Volume : 1.26 to 12.6 L/s Absolute Pressure 0.4 to 0.76 MPa Temperature 80 to 90 K
13 Metering Characteristics Meter Test Section Design 25 to 150 mm diameter 4 meter length Flowmeter Calibration Services Turbine Coriolis Ultra Sonic Vortex shedding Research Application Prototype meter testing Meter verification at LN2 temperatures All measurements are traceable to national standards
14 NIST Quality System and Conformance to ISO/IEC NIST Quality System in place Website: NIST Quality Assessment NIST Assessment Review Board NIST Measurement Services Advisory Group (MSAG) SIM Regional Metrology Organization QSTF: Quality Systems Task Force BIPM: Bureau International des Poids et Mesures CIPM: International Committee for Weights and Measures/ Comité International des Poids et Mesures MRA: Mutual Recognition Agreement CMC: Calibration and Measurement Capabilities Inclusion in Appendix C Calibration and Measurement Capabilities
15 Facility Components and design Liquid nitrogen flow Closed loop Mass Measurement Load cell Weigh tank Subcooler Remove thermal energy Temperature measurement PRT s Pressure measurement Pressure transducer
16 Liquid Nitrogen Flow Facility Schematic


17 Facility Description Liquid nitrogen is the process fluid Circulated throughout the closed loop by a variable speed pump Flows into a subcooler where thermal energy is removed due to pumping ambient heat leak Temperature in the test section controlled by adjusting the subcooler liquid level diverting flow around the subcooler an inline heater Pressure in the test section controlled by Downstream control valve Introducing helium gas pressure
18 Nitrogen Flow Procedure Catch tank liquid volume creates positive head pressure on centrifugal pump Prevents cavitation and bubbling Fluid circulates in 76.2 mm vacuum-jacketed copper pipeline Liquid flows into diffuser to remove vertical component of velocity at bottom of aluminum weigh tank m 3 capacity Liquid flows through valve at bottom of weigh tank and into stainless steel pressure vessel m 3 capacity When temperature, pressure, and flowrate reach steady-state condition weigh tank valve closed System timers and data acquisition begin Predetermined amount of liquid nitrogen accumulates in weigh tank Varies from approx. 440 kg to 1320 kg Mass collected for each data point is determined by Load cell output voltage values Total time the mass was collected


19 Liquid Nitrogen Flow Stream Sapphire window provides ability to observe flow directly downstream of flowmeter test section prior to entering weigh tank Internal liquid line is vacuumjacketed to clearly view flow stream for gas bubbles
20 Data Acquisition Once liquid level reaches preset value, test point begins Timer is initiated and data acquisition begins Frequency output from flowmeters is input into counters to totalize meter pulses Pressure and temperature are measured for density calculations in meter test section as well as in weigh and catch tanks for buoyancy calculations and system monitoring
21 Uncertainty in Liquid Nitrogen Mass Flow Measurement Components of the mass flow uncertainty Load cell sensitivity measuring the mass of the LN2 Weights Voltage Sensitivity equation Pressure Buoyancy evaluated for each mass measurement Buoyancy of LN2 accumulated during the data point Buoyancy of the immersed diffuser and pipe in LN2 Change in buoyancy of LN2 accumulated before the data point begins Time measurement Multi-function datalogger used to measure within 1 ms Mass balance between test section and weigh tank Finite volume of LN2 in piping between meter and weigh tank Provided density gradient in pipe remains constant during data point, mass collected in weigh tank is equivalent to mass passing through meter Pressure drop remains nearly constant Temperature gradient less than 70 mk
22 Total Uncertainties (1σ) for Mass Measurement Source of Uncertainty: Type A (%) Type B (%) Combined (%) Load Cell Sensitivity Buoyancy Correction Mass between Test Section and Weigh Tank (liquid N2) Total for Mass Measurement Expanded Uncertainty, k= Time Total for Mass Flow Rate Expanded Uncertainty, k=
23 Total Uncertainties (1σ) for Volumetric Flow Rate Measurement Source of Uncertainty in Liquid Volume Flow Nominal Values: T=85 K Mass = 182 kg P = 620 kpa Time = 100 s Type A (%) Type B (%) EOS (REFPROP) 0.02 δρ/δt P δρ/δp T (P Test Section, Baro) Uncert. in mass flow rate Total (in quad) Total (Type A + B, in quad), k=
24 Calibration Procedure Statistical calibration program developed Uses fractional factorial test plan Provides ability to separate main effects and low-order interactions from one another Allows evaluation of meter for sensitivity to Pressure Temperature Flowrate Thermal cycling 60 data points taken over two-day period 5 temperatures 12 flowrates 5 pressures
25 Data Analysis For volumetric flow rate, predicted performance of meter in measuring flow rate is compared to flow rate determined by facility: Meter Mass: M R = Pρ / K (1) Percent Deviation = (M R M NIST ) * 100 / M NIST (2) Where, M R = mass calculated from the flowmeter output P = flowmeter output in total pulses ρ = liquid density determined from the flow facility temperature and pressure measurements K = meter factor in pulses per unit volume M NIST = mass determined by the flow facility For mass flow rate, only second equation is used
26 Data Analysis The deviation data are fitted by least-squares method to mathematical model equation: Dev(%) = A + BQ + CQ 2 + DQ 3 + ET+ FP Dev(%) = percent deviation T = fluid temperature Q = volume flowrate P = liquid nitrogen pressure A,B,C,D,E,F = coefficients

27 Sample Data Results
28 Typical Meter Calibration with Statistical Summary 32.6 Turbine Flowmeter Meter factor, pulses per liter Mean : pulses per liter Standard deviation : pulses per liter Standard error of the mean : pulses per liter Flowrate, liters per minute

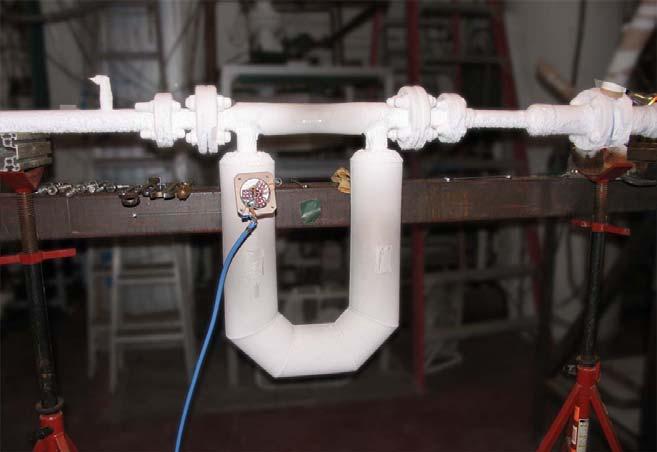
29 38 mm Meter Installation


30 50 mm Flowmeter Installation

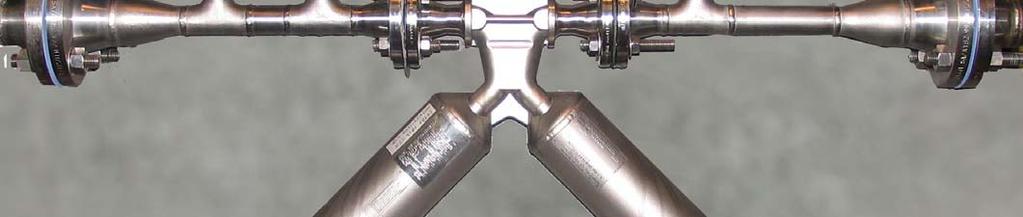

31 25 mm Flowmeter Installation


32 150 mm Flowmeter Installation
33 Summary NIST Cryogenic Flow Facility is well instrumented in test section and weigh tank/catch tank assembly A meter evaluation test plan is used to determine sensitivity to pressure, temperature, flowrate, and thermal cycling Combined expanded uncertainties (k =2) for totalized mass and volume cryogenic flow measurement are 0.17% and 0.18% respectively Facility has been well used in evaluating various types of flowmetering devices to determine their suitability for measuring cryogenic flows It is anticipated that LNG and LH2 will have expanding roles as alternative fuels, and NIST will be able to provide assistance in developing accurate measurement methods for cryogenic liquid flows
34 Thank you for your attention