Oregon DEQ AQ-Technical Services
|
|
|
- Marylou Spencer
- 5 years ago
- Views:
Transcription
1 Oregon DEQ AQ-Technical Services 2014 Oregon Gasoline Dispensing Facility (GDF) Emissions Inventory and Modeling June 2017 NW-AIRQUEST 2017 Annual Meeting Richland, Washington Christopher Swab, Phil Allen Oregon Department of Environmental Quality
2 Presentation Road Map Emissions Inventory GDF location, processes Activity Emission factors Emissions overview Projections Further work Modeling 2
3 GDF location 1,584 permitted GDFs 3
4 Processes Universe of processes: Stage I = Underground Storage Tank (UST) Tank filling Uncontrolled = splash filling Controlled filling Submerged Balanced/submerged Tank breathing & emptying Stage II = Vehicle refueling Pump Uncontrolled Controlled = Vapor Recovery System (VRS) Control Types = 1, 2, 2A, 2E Vehicle Uncontrolled Controlled = Onboard Refueling Vapor Recovery (ORVR) VRS compatible = 1, 2, 2E VRS incompatible = 2A Pump nozzle spillage 4
5 Activity station throughput and controls Station annual throughput reported to DEQ/LRAPA Station controls Indicated by GDF on initial permit application or Stage I control requirements determined by annual throughput: 13,000 gallons or less = splash filling 13,001 to 479,999 gallons = submerged filling 480,000 or more gallons = balanced / submerged filling Stage II controls are required in Multnomah, Washington and Clackamas counties only (with few exceptions) 5
6 Activity station throughput allocated to ORVR and non-orvr Oregon ORVR vehicle fleet penetration estimated using: Vehicle registration data Manufacturer compliance rates by vehicle model year The goal of ORVR is to make VRS obsolete Source: On-board Refueling Vapor Recovery (ORVR) How well is it performing? Presentation by Wayne Elson, EPA Region 10. Washington-Oregon Gasoline Vapor Control Committee. Lacey, Washington. May 4,
7 Activity 2014* gasoline dispensed by station summed to county DEQ state total = 1,466,672,707 gallons DOE EIA state total = 1,484,196,000 gallons * Lane County = 2016 data 7
 * (1-eff/100) Controls and rule data taken from EPA and CARB documentation UST / AST breathing &")
8 Emission factors Stage I VOC, with examples Loading loss from AP-42, Section 5.2, p Uncontrolled, lb/10^3gal = (SPM / T) T = R = NOAA weather station data, avg. county temperatures estimated S, P, M taken from AP-42 Impact of controls = (uncontrolled emissions) * (1-eff/100) Controls and rule data taken from EPA and CARB documentation UST / AST breathing & emptying from AP-42, Table Examples: 8
9 Emission factors Stage II VOC - Pump Displacement from refueling: Pump Displacement from Refueling Emissions for Nonroad Engine Modeling (EPA420-P ), p. 9 Uncontrolled g/gal = dt T RVP This equation is the same as AP-42, Section 5.2, p , however EPA420-P includes an equation for estimating dt: x (ambient temperature 62) T = F = NOAA weather station data, avg. county temperatures estimated RVP = EPA MOVES2014a default Oregon data Impact of controls = (uncontrolled emissions) * (1-eff/100) Controls and rule data from EPA, CARB and DEQ data and documentation 9
10 Emission factors Stage II VOC - ORVR Displacement from refueling: Vehicles equipped with ORVR No VRS, or VRS compatible EPA document: Onboard Refueling Vapor Recovery for Motor Vehicles Fact Sheet Control efficiency = 95% VRS incompatible Preliminary Draft Test Report: Total Hydrocarbon Emissions From Two Phase II Vacuum Assist Vapor Recovery Systems During Baseline Operation and Simulated Refueling of Onboard Refueling Vapor Recovery (ORVR) Equipped Vehicles. California Air Resources Board, Project number ST-98-XX. June Control efficiency = 90% 10

11 Emission factors Stage II VOC Nozzle Spillage, and examples Nozzle spillage increased by topping off Revised Emission Factors for Gasoline Marketing Operations at California Gasoline Dispensing Facilities. California Environmental Protection Agency, Air Resources Board. December 23, VRS vs. no VRS Stage II VOC EF examples AP-42: It is estimated that the uncontrolled emissions from vapors displaced during vehicle refueling average 1320 mg/l (11.0 lb/1000 gal) of dispensed gasoline. national estimate (?) from 1972 & 1975 data 11
12 2014 Emissions VOC by county (ordered descending by throughput as in Slide 7) VRS No VRS 12
13 Emissions VOC by GDF, 10 tpy or greater 32 GDFs >= 10 tpy VOC = 2.02% of all GDFs 13
14 HAPs emitted EPA Speciate 4.5: Profile 2455 (Composite Gasoline Vapor from Seattle (5 brands, 3 grades) ) 45 HAPs CAS NAME VOC to TOG Weight Percent ,2,4-trimethylbenzene % ,3,5-trimethylbenzene % ,3-diethylbenzene (meta) % Methyl-2-ethylbenzene % Methyl-3-ethylbenzene % Methyl-4-ethylbenzene % pentene % ,2,4-trimethylpentane % ,2-dimethylbutane % ,3,4-trimethylpentane % ,3-dimethylbutane % ,3-dimethylpentane % ,4-dimethylpentane % methylheptane % methylhexane % methylpentane (isohexane) % methylheptane % methylhexane % methylpentane % Benzene* % Cis-2-butene % Cis-2-pentene % Cyclohexane % * EPA-420-R , Table 16, p.14 CAS NAME VOC to TOG Weight Percent Cyclopentane % Ethylbenzene % Isobutane % Isopentane (2-Methylbutane) % Isoprene (2-methyl-1,3-butadiene) % Isopropylbenzene (cumene) % M & p-xylene mixture % Methylcyclohexane % Methylcyclopentane % N-butane % N-heptane % N-hexane % N-nonane % N-octane % N-pentane % N-propylbenzene % N-undecane % O-xylene % Toluene % Trans-2-butene % N/A Other % N/A Unidentified % 14
15 Projections Gasoline usage source: US Energy Information Administration, Annual Energy Outlook 2017 Hmmm.when will Stage II VRS requirements be discontinued (?) 15
: impact of violations (missing or broken controls and other")
16 Further refinements (?) Temporal variations: Activity uniform, however temperature varies.. Control efficiency (CE): impact of violations (missing or broken controls and other equipment) 16
17 Acknowledgements: John St. Clair: Southwest Clean Air Agency Jerry Ebersole: Oregon DEQ Mike Poulsen: Oregon DEQ 17
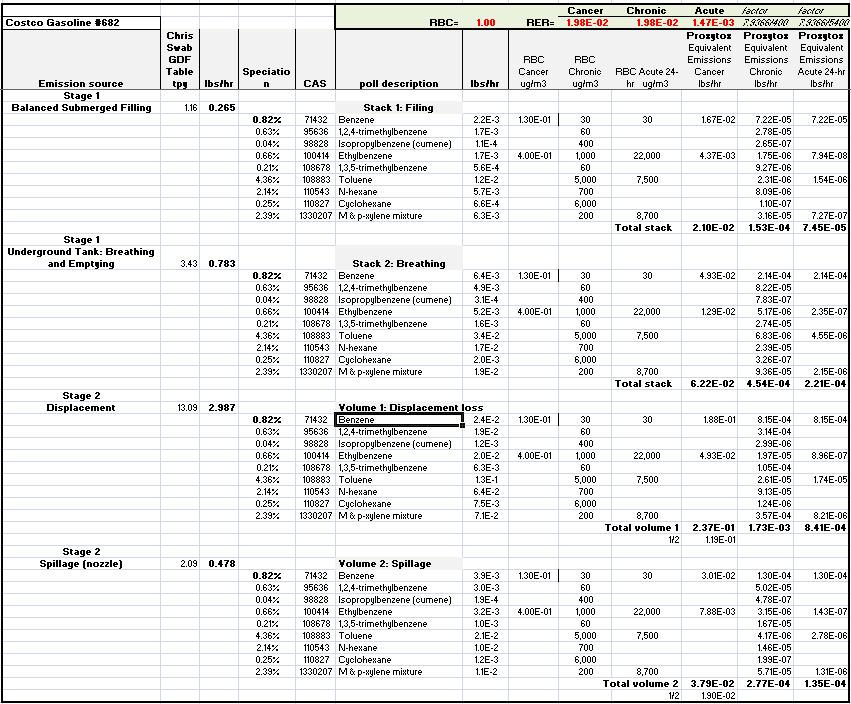
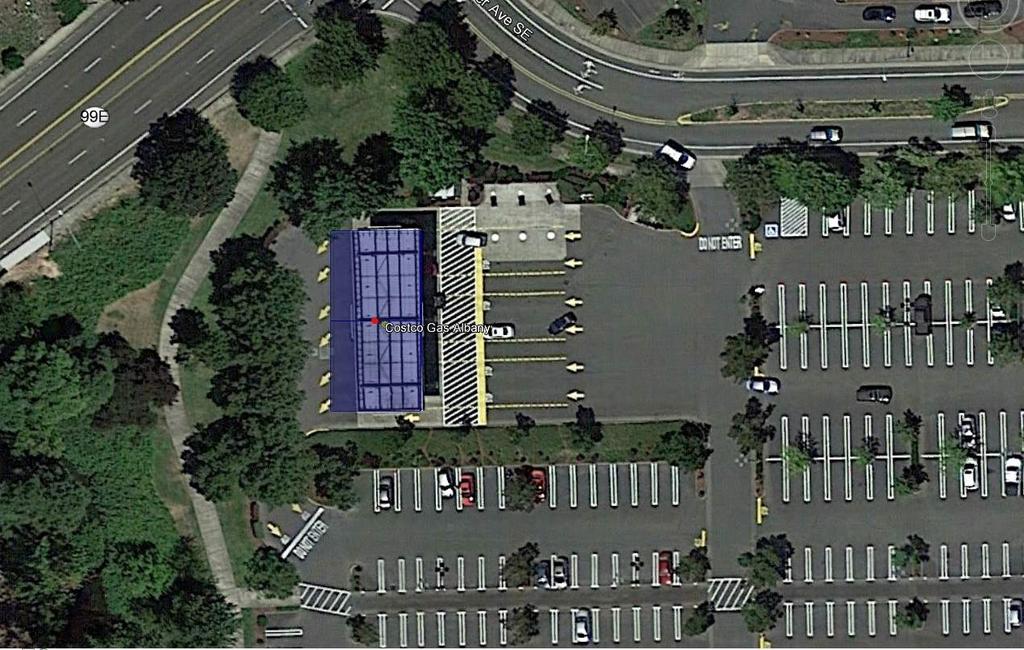
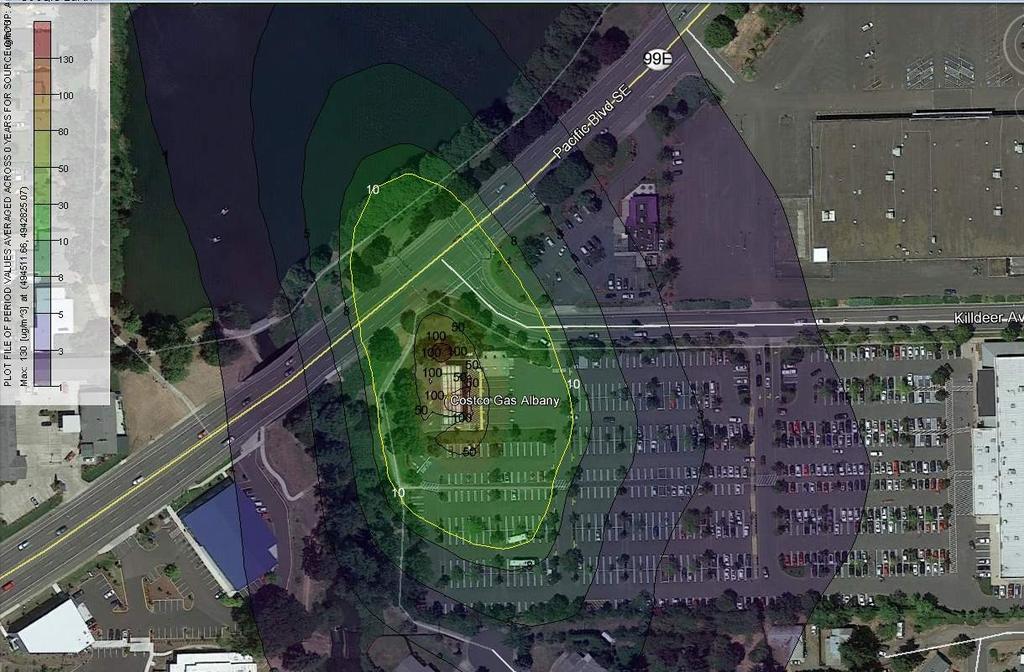
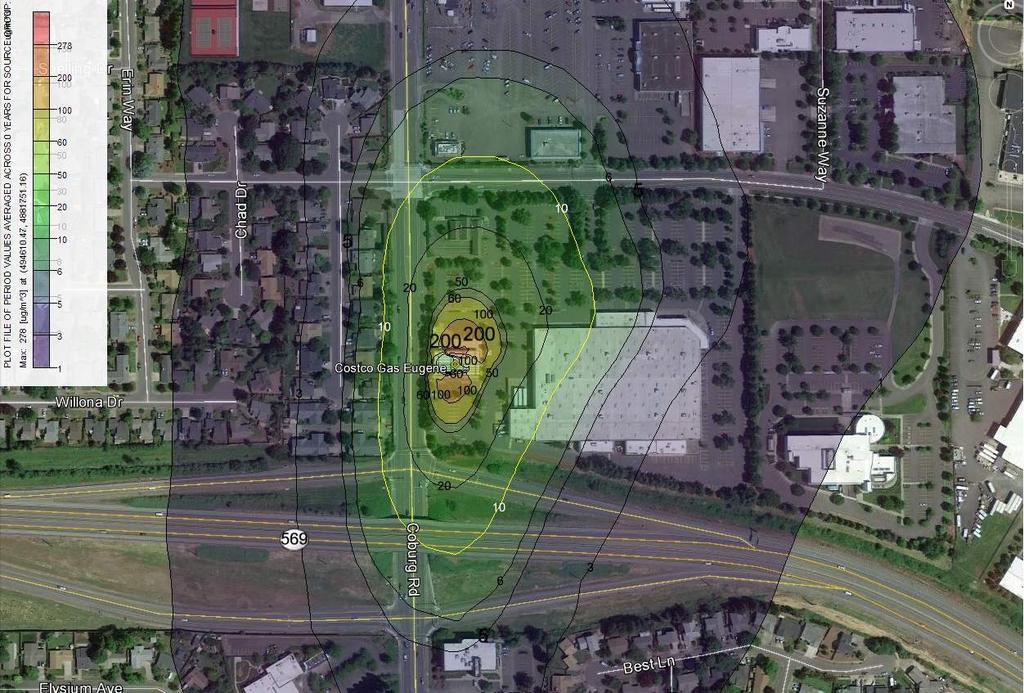
18 Modeling Based on data from Chris: Assess impacts of toxics from GDFs 1) Select largest stations 2) Speciate VOCs into constituent toxics with emission profiles 3) Identify toxics with available Risk Based Concentrations 4) Use a proxy to estimate cumulative risk from multiple toxics 5) Run proxy emissions in Aermod to estimate risk 18

19 Modeling: 19
20
21 Modeling: 21
22 Modeling: 22
23 Modeling: 23
24 Modeling: 24
25 Modeling: 25
26 Modeling: 26
27
28
29
30
31
32