GHG reduction with solid separation in POME ponds
|
|
|
- Virginia Glenn
- 5 years ago
- Views:
Transcription


1 Annamari Enström, Neste GHG reduction with solid separation in POME ponds Introducing new emission factors for alternative CH 4 reduction techniques
2 Content 1 Introduction 2 Solid separation 3 Methane measurement study with belt filter press system 4 Emission factor 5 Conclusions 2
 Feedstock production Cultivation emissions e ec Land use change e I Improved agricultural management e sca Processing Crude oil production (Oil mill) Processing e p Upstream transport e")

3 A significant share of palm oil based biofuel s life cycle GHG emissions are caused by palm oil mill wastewater treatment Life cycle GHG (CO 2e ) emissions (E) per MJ Cultivation of palm oil (plantation) Feedstock production Cultivation emissions e ec Land use change e I Improved agricultural management e sca Processing Crude oil production (Oil mill) Processing e p Upstream transport e td Excess electricity e ee CCR e ccr CCS e ccs Refining of biofuel Final processing Processing e p Upstream & downstream transport & distribution e td Excess electricity e ee CCR e ccr CCS e ccs E = e ec + e l + e p + e td + e u e sca e CCS e CCR e ee e p e td e ccs GHG emissions from processing GHG emissions from transport and distribution GHG emissions savings from carbon capture and geological storage e ccr e ee GHG emissions savings from carbon capture and replacement GHG emissions savings from excess electricity from cogeneration Source: ISCC 2017, EU Renewable energy directive 3

4 Palm oil mill effluent (POME) is a waste stream of the Palm Oil Mill, which is collected and processed in anaerobic and aerobic ponds so that it can be safely discharged into the environment 4


5 Measures to reduce the wastewater treatment plant methane emissions have been developed Palm oil GHG emissions* In 2015 Malaysian production of POME was 63.4 million m 3 This equals to approx. GHG emissions of million t CO 2e This equals to 6.5% of Malaysia s total GHG emissions in 2005 From open ponds to capture and prevention Co-composting Methane capture Flaring Biogas utilization Methane formation reduction Solid separation *Source: Loh et. al

6 Developing a calculation model for determining the impact of methane reduction measures on GHG emissions GHG calculation of a biofuel is the sum of many parts of the supply chain. Emissions from WWTP is part of the processing segment The EU RED calculation methodology that is implemented by the voluntary schemes does not provide any framework for the GHG calculation of alternative methane avoidance measures at palm oil mills aside from installations with methane capture or co-composting of POME and EFB However, promising methane avoidance measures are currently being developed and implemented by companies 6
7 Content 1 Introduction 2 Solid separation 3 Methane measurement study with belt filter press system 4 Emission factor 5 Conclusions 7
8 Solid separation: need for a study Previous POME research* has generally been concentrating on biogas formation potential and applicability of anaerobic bioreactors EU RED calculation methodology: current requirements and criteria for palm oil GHG Based on carbon balance and literature review it became evident that solid separation reduces CH 4 emissions Actual methane measurements had been done only in few studies, but none with solid separation Need for a study: General CH 4 emission factor applicable for organizations in palm oil industry, utilizing solid separation, without extensive, complicated and expensive actual gas measurements in co-operation with ISCC, IDH, KLK and Neste Project started 2013, IDH in 2016 Solid separation in operation, in comparison with open pond emissions * e.g. Yacob et al 2005, Poh et al 2010, Taylor et al 2017, Loh et al
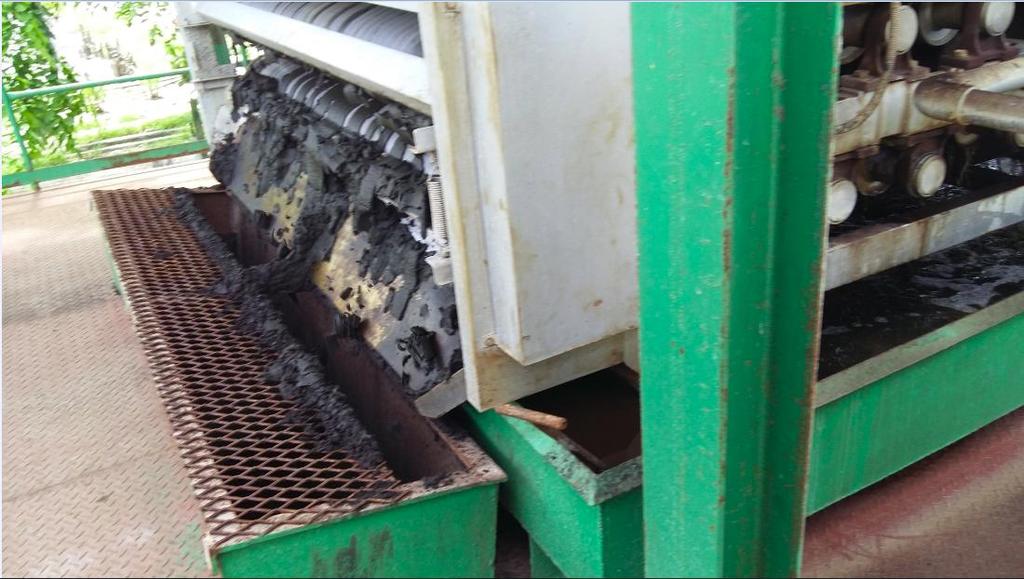
9 Belt filter press system Solid-liquid separation Obtained by passing a pair of filtering cloths, belts through a system of rollers The system takes sludge, effluent or slurry as a feed, often pretreated with flocculant, and separates them into a filtrate and a solid press cake. The separated solid, filter cake can be used for fertilizer in the plantation which reduces the need for other GHG-intensive fertilizers. 9


10 Belt filter press system 10
11 11
12 Content 1 Introduction 2 Solid separation 3 Methane measurement study with belt filter press system 4 Emission factor 5 Conclusions 12
13 Developing a calculation model for determining the impact of methane reduction measures on GHG emissions Based on onsite measurements, a functional relationship for every pond between the GHG and carbon content of the organic matter in the POME ponds And/or other parameters that are easy to assess by the palm oil mill The relationship can then be applied for different methane reduction set-ups at oil mills for determining GHG emissions Two measurement sequences are required, the first one to set the baseline (without the belt press being in operation), the second one with stationary operation of the belt-press 13

14 Field research: Case study mill in Perak, Malaysia 730 t FFB d t CPO d t belt press cake d -1 5 anaerobic POME ponds Solid separation The belt press system was installed in pond 1, to where it was moved 3 weeks prior the measurements from pond 2, where it had been in use from October to December. Baseline Other baseline mill in Indonesia and the Malaysian case study mill ponds without solid separation The baseline mill appeared to have a very different production profile than assumed and it had an effect on comparability The best comparison was achieved with anaerobic ponds in the case study mill without solid separation 14
15 POME treatment plant layout of the Case study mill Slurry pump was moved to anaerobic pond 1 three weeks before CH 4 measurements. 15


16 Anaerobic ponds 1 and 2 of the case study mill with belt press, cooling tower in the background 16
17 Design of measurement setup Ponds are measured in four transects on a daily rotational mode for CH 4 focusing on those with belt press "background" I.e. one CH 4 -measurement rotation for all ponds took 9 days CH 4 measurements 2x 2x Every transect has two measuring points, repeated twice 2x 2x Chamber closure time is five minutes 2x 2x During February more detailed transects were taken in order to identify edge effects 2x 2x Change: Increase of measuring points (3) and reduced chamber closure time (1 min) 17
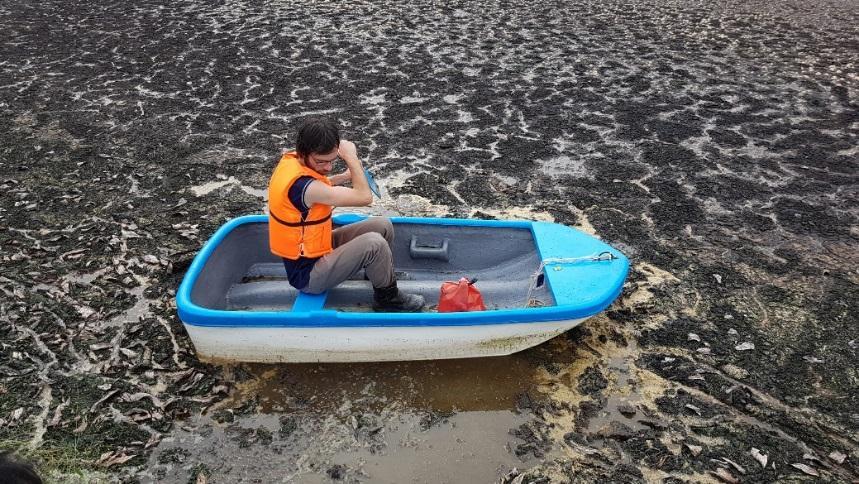
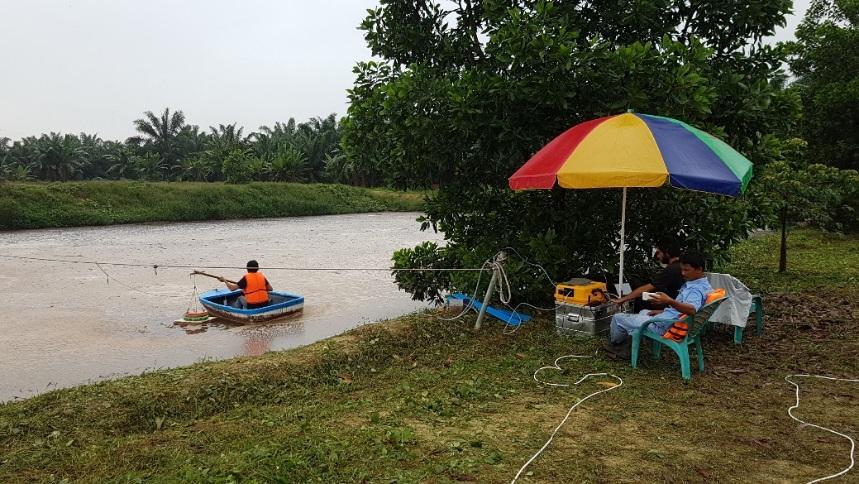
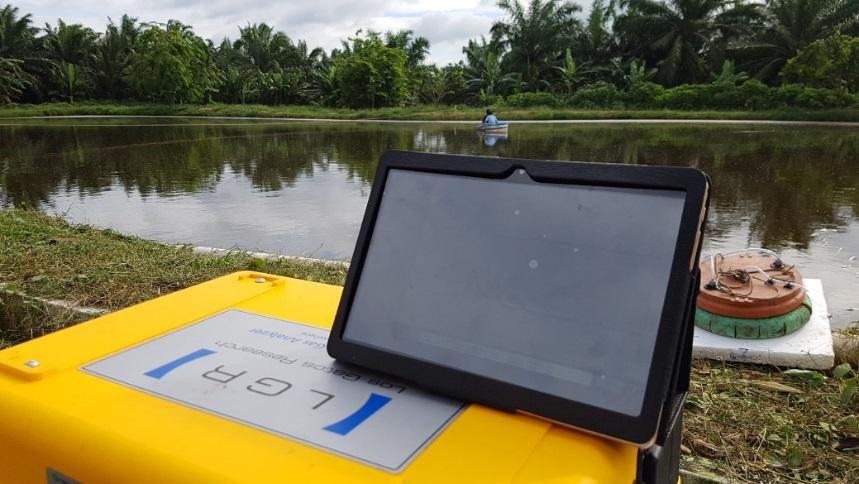
18 On-site measurements CH 4 18
19 CH 4 emissions are calculated using a version of a methane flux calculation tool developed by Hoffmann et. al (2017) 19
20 Assessing the CH 4 emission is based on identifying the increase of gas concentration over time within the chamber volume M[ g mol ] P[ Pa] V[ m ] dv[ ppm( v)] r CH µg C m h ] = R[ m Pa K mol ] T[ K] t[ h] A[ m [ 2 f ] 1 r CH M : P : V : R : T : t : A : f 1 4 : dv : : Gas flux ( e. g. CH ) molar mass barometric pressure chamber headspace ( volume) constant temperature time size of observed area elementary part of observed gas molecule observed slope of 4 gas concentration c gas over time t n C gas t n 20
21 Design of measurement setup For the day of CH 4 -measurement of each pond, COD Cr (Chemical Oxygen Demand) samples were taken from 3 different depths close to inlet and outlet of the ponds (= 6 COD samples per day) Water temperatures were recorded with logging devices every 30 minutes in three to four different depths over several days in each pond TOC (Total organic carbon) and dry matter sampling was done in raw effluent inlet, final discharge (outlet) and the belt press cake Pond profile was measured A B C D 21
22 Measurement results Average CH 4 emissions for each pond show that pond 1 with belt filter press system had significantly lower emissions than ponds 3, 4 and 5 Pond 2 is considered to remain in intermediate state between solid separation and open pond kg CH 4 ha -1 day TOC measurements gave an average of 3.25 % of carbon in belt press cake Anaerob 1 Anaerob 2 Anaerob 3 Anaerob 4 Anaerob 5 COD values show decreasing trend for surface values from pond inlet to pond outlet in first ponds Water and air temperatures remained stable 22
23 The measurement showed similar reduction with 1 belt press in both CH 4 emissions and carbon Case mill measured CH 4 reduction with belt filter press Case mill removed carbon with belt filter press kg CH 4 ha -1 h -1 POME carbon t day -1 Open pond without solid separation belt press Raw POME TOC TOC with belt press 23
24 Content 1 Introduction 2 Solid separation 3 Methane measurement study with belt filter press system 4 Emission factor 5 Conclusions 24
25 Carbon content can be used in estimating reduced emissions TOC measurements gave an average of 3.25 % of carbon in belt press cake This results in 890 kg d -1 removed carbon with belt filter press in the case study mill, with belt press cake production of 27 t d -1 GHG (CO 2e ) formation factor for removed carbon Molecular weight of CH 4 =16.04 Molecular weight of carbon = Methane correction factor from IPCC wastewater methodology* = 0.8 IPCC uncertainty factor** = 0.94 Methane global warming potential converted to CO 2e (as defined in RED) = 23 Removed carbon converted to avoided CO 2e emissions with a GHG factor of 23.1: The case study mill s daily GHG reduction with belt filter press is 20.6 t CO 2e Equals to 0.13 kgco 2e /kgcpo with production of 156 t CPO d -1 Annual reduced emissions of approx t CO 2e *UNFCCC IPCC: CDM AMS-III.H. Small-scale Methodology Methane recovery in wastewater treatment. Version **UNFCCC IPCC 2003: Greenhouse gas inventories and additional information submitted by Parties included in Annex I Reporting, accounting and review requirements relating to the second commitment period of the Kyoto Protocol 25
26 Based on the findings from this study, an enhanced GHG calculation would allow for the inclusion of emission from oil mills with belt press This study showed that the carbon content of the organic material that was removed by a belt press installation from POME ponds, relates to the mass of methane that is avoided, compared to a baseline open pond system Thus, it is recommended to include an GHG emission factor for palm oil mills that are using an operating belt press installation within their waste water treatment plant This emission factor shall be deduced from the baseline open pond emission factor With 23.1 as conversion factor for carbon to GHG ISCC emission factor for open ponds is 0.51 kg CO 2e / kg CPO The final emission factor is stongly dependable on the amount of belt filter cake produced. For using a belt press EF, actual carbon content values from lab analysis and average annual average of belt press cake CPO ratio is required. 26
27 Content 1 Introduction 2 Solid separation 3 Methane measurement study with belt filter press system 4 Emission factor 5 Conclusions 27


28 Belt filter press is a valid system in GHG prevention Current estimate of emissions from WWTP in processing only refers to closed ponds or open pond treatment without GHG avoidance. This study shows that also a belt filter press significantly reduces the formation of methane emissions. Belt filter press is a cost-effective solution for POME treatment Reduced need for dredging and operation shutdown Frees land area for other use from dredging Organic fertilizer: decreases need for purchased fertilizer Investment costs significantly lower than with methane capture Save the planet and secure your profits Please watch for the article submitted in October by T. Haatainen, A. Enström, et al. 28

29 Thoughts for possible future studies / uncertainties Other solid separation technologies Other sectors waste water treatment plants Organic carbon analysis: Comparison of different methods: TOC, COD Cr, dry matter & ash content, others? Variance per sector / per mill: possible to find a stable emission factor based on only amount and dry matter of cake? Inlet & outlet POME 24 h mixed sample feasibility compared to press cake sampling Longer history of belt press use in pond(s) to be studied, in continuous mode Gas measurements for 24 hour days, 7 day weeks and whole year Suggest to use factor for press cake carbon amount to GHG for now and to deepen research 29


30 Please let us hear the good news when you hear a company goes for solid separation: Annamari.enstrom@neste.com 30