Hydrogeological Assessment and Water Balance th Avenue, Markham. Sixteenth Land Holdings Inc.
|
|
|
- Clifford Blake Eaton
- 5 years ago
- Views:
Transcription
1 Hydrogeological Assessment and Water Balance th Avenue, Markham Sixteenth Land Holdings Inc. R.J. Burnside & Associates Limited 6990 Creditview Road, Unit 2 Mississauga ON L5N 8R9 CANADA September


2 Sixteenth Land Holdings Inc. i Hydrogeological Assessment and Water Balance September 2016 Distribution List No. of Hard PDF Organization Name Copies 0 Yes Yes Sixteenth Land Holdings Inc. 0 Yes Yes Gatzios Planning & Development Consultants Inc. 14 Yes Yes Stantec 0 Yes Yes Beacon Environmental Record of Revisions Revision Date Description - September 22, 2016 Final Submission R.J. Burnside & Associates Limited Report Prepared By: Travis Mikel, P.Geo. Hydrogeologist TM:cl Report Reviewed By: Joanne Thompson, M.Sc., P.Geo. Senior Leader, Development Hydrogeology JT:cl R.J. Burnside & Associates Limited _York Downs Hydrogeological Assessment and Water Balance
3 Sixteenth Land Holdings Inc. ii Hydrogeological Assessment and Water Balance th Avenue, City of Markham September 2016 Table of Contents 1.0 Introduction Scope of Work Physical Setting Physiography and Topography Drainage Geology Surficial Geology Bedrock Geology Hydrostratigraphy Soil Hydraulic Conductivity and Infiltration Rates Hydrogeology Local Groundwater Use Groundwater Levels Interpreted Groundwater Flow Conditions Groundwater Flow Systems Recharge and Discharge Conditions Water Quality Groundwater Quality Surface Water Quality Water Balance Water Balance Components Approach and Methodology Component Values Pre-Development Water Balance (Existing Conditions) Potential Urban Development Impacts to Water Balance Post-Development Water Balance With No Mitigation Water Balance Mitigation Strategies Woodlot/Wetland Feature Based Water Balance Pre-Development Water Balance (Existing Conditions) Post-Development Water Balance and Mitigation Strategies Construction Considerations Water Quality Construction Below Water Table Dewatering/Depressurization Requirements Well Decommissioning Monitoring Bibliography and References R.J. Burnside & Associates Limited _York Downs Hydrogeological Assessment and Water Balance
4 Sixteenth Land Holdings Inc. iii Hydrogeological Assessment and Water Balance th Avenue, City of Markham September 2016 Tables Table 1a: Summary of Hydraulic Conductivity Test Results... 9 Table 1b: Summary of Infiltration Rates Table 2: Water Balance Component Values Table 3: Summary of Pre-Development Infiltration, Runoff and Evapotranspiration Table 4: Summary of Post-Development Infiltration, Runoff and Evapotranspiration. 25 Table 5: Summary of Pre-Development Runoff to Woodlot/Wetland Feature Table 6: Summary of Post-Development Runoff and Evapotranspiration to Woodlot/Wetland Feature With Mitigation Figures Figure 1: Site Location Figure 2: Topography and Drainage Figure 3: Surficial Geology Figure 4: Monitoring Locations Figure 5: Cross Section Location Key Figure 6: Interpreted Geological Cross Section A-A Figure 7: Interpreted Geological Cross Section B-B Figure 8: Interpreted Geological Cross Section C-C Figure 9: Interpreted Geological Cross Section D-D Figure 10: Interpreted Geological Cross Section E-E Figure 11: Interpreted Geological Cross Section F-F Figure 12: Interpreted Shallow Groundwater Flow Appendices Appendix A MOECC Well Records Appendix B Borehole and Monitoring Well Logs Appendix C Grain-Size Analyses Appendix D Hydraulic Conductivity and Infiltration Tests Appendix E Groundwater Elevation Data Appendix F Surface Water Data Appendix G Water Quality Data Appendix H Water Balance Calculations R.J. Burnside & Associates Limited _York Downs Hydrogeological Assessment and Water Balance
5 Sixteenth Land Holdings Inc. iv Hydrogeological Assessment and Water Balance th Avenue, City of Markham September 2016 Disclaimer Other than by the addressee, copying or distribution of this document, in whole or in part, is not permitted without the express written consent of R.J. Burnside & Associates Limited. In the preparation of the various instruments of service contained herein, R.J. Burnside & Associates Limited was required to use and rely upon various sources of information (including but not limited to: reports, data, drawings, observations) produced by parties other than R.J. Burnside & Associates Limited. For its part R.J. Burnside & Associates Limited has proceeded based on the belief that the third party/parties in question produced this documentation using accepted industry standards and best practices and that all information was therefore accurate, correct and free of errors at the time of consultation. As such, the comments, recommendations and materials presented in this instrument of service reflect our best judgment in light of the information available at the time of preparation. R.J. Burnside & Associates Limited, its employees, affiliates and subcontractors accept no liability for inaccuracies or errors in the instruments of service provided to the client, arising from deficiencies in the aforementioned third party materials and documents. R.J. Burnside & Associates Limited makes no warranties, either express or implied, of merchantability and fitness of the documents and other instruments of service for any purpose other than that specified by the contract. R.J. Burnside & Associates Limited _York Downs Hydrogeological Assessment and Water Balance
6 Sixteenth Land Holdings Inc. 1 Hydrogeological Assessment and Water Balance th Avenue, City of Markham September Introduction Sixteenth Land Holdings Inc. has retained R.J. Burnside & Associates Limited (Burnside) to prepare this Hydrogeological Assessment and Water Balance report in support of an Official Plan Amendment (OPA) application to permit the development of a residential community on the Subject Property municipally known as th Avenue, in the City of Markham, Region of York. The property is located in Part Lots 16, 17 and 18, Concession 5. The Subject Property is a total of hectares ( acres), and is located on the north side of 16 th Avenue, on the west side of Kennedy Road, and has a small amount of frontage onto the east side of Warden Avenue as well (Figure 1). There is existing urban development surrounding the property on all sides. Except for an area adjacent to Kennedy Road, the balance of the property is currently used by its former owner York Downs Golf & Country Club for a golf course. The golf course has been in operation since York Downs Golf & Country Club opened in the early 1970s. The current Official Plan designation of Private Open Space for the areas outside of the valleylands reflects this historic golf course use. Sixteenth Land Holdings Inc. intends to develop the property for a residential community and is submitting an OPA to re-designate the developable portion of the property from Private Open Space to appropriate urban residential designations to permit the development of residential uses. This report has been prepared in conjunction with the OPA application in support of the re-designation as proposed in the draft OPA and in the Planning Report (Gatzios Planning, September 2016). Please refer to the draft OPA and to the Planning Report for a description of the proposed Official Plan land use designations for the property. The proposed residential development is detailed in the two Draft Plan of Subdivision applications that accompany the OPA application. There is one Draft Plan of Subdivision for the east portion of the property and one for the west portion of the property. The west Draft Plan of Subdivision also contains the valleylands associated with both the Berczy Creek and the Bruce Creek. References in this report to the two draft plans or to specific lots/blocks will include East or West to denote the appropriate area. The purpose of the hydrogeological study is to characterize the geological and hydrogeological conditions on the property, identify potential development impacts on the local groundwater and surface water conditions, and to complete water balance calculations. The water balance calculations provide input to the stormwater management plans to be developed for the property by Stantec and provide recharge R.J. Burnside & Associates Limited _York Downs Hydrogeological Assessment and Water Balance
7 Sixteenth Land Holdings Inc. 2 Hydrogeological Assessment and Water Balance th Avenue, City of Markham September 2016 targets for the design of Low Impact Development (LID) measures to maintain, where possible, key hydrogeological functions. 1.1 Scope of Work A comprehensive Terms of Reference (TOR) was developed in consultation with the City and TRCA for the MESP for the Subject Property (July 12, 2016). The scope of work for this study was specifically designed to fulfill the hydrogeological and water balance requirements as per the TOR and included completion of the following tasks: 1. Review of published geological and hydrogeological information: A review of existing mapping for the area was completed, including topography (Figure 2), surficial geology (Figure 3) and bedrock geology. 2. Review of the Ministry of the Environment and Climate Change (MOECC) well records: The MOECC maintains a database that provides geological records of water supply wells drilled in the province. A list of the available records for local wells is provided in Appendix A and the well locations are shown on Figure 5. It is noted that the well locations listed in the MOECC records are approximations only and may not be representative of the precise well locations in the field. 3. Review of the geotechnical report and liaison with the project geotechnical engineers (Golder Associates) for the installation of groundwater monitoring wells across the Subject Property: In 2014, Golder drilled 34 boreholes and installed 10 monitoring wells to investigate the soil and groundwater conditions for a preliminary geotechnical investigation. In 2016, Golder drilled an additional 20 boreholes and installed 18 monitoring wells to investigate the soil and groundwater conditions for a geotechnical investigation and the hydrogeological assessment. The locations of the monitoring wells and boreholes are shown on Figure 5 and copies of the borehole logs are provided in Appendix B. 4. Piezometer installations: Fifteen piezometers (three single piezometers and six nests of two piezometers installed at different depths) were installed along Bruce Creek, Berczy Creek, golf course ponds and within wetlands to investigate the shallow groundwater conditions. The locations of the piezometers are shown on Figure Review of grain-size analyses: Analyses were completed by the geotechnical consultants on representative soil samples obtained during the geotechnical investigation. These data were reviewed to characterize the surficial sediments and estimate the hydraulic conductivity of the soils encountered. Copies of the soil grain-size analyses are provided in Appendix C. R.J. Burnside & Associates Limited _York Downs Hydrogeological Assessment and Water Balance
8 Sixteenth Land Holdings Inc. 3 Hydrogeological Assessment and Water Balance th Avenue, City of Markham September Hydraulic conductivity testing: Single well response tests were completed in seven groundwater monitoring wells (BH16-5, BH16-6, BH16-9, BH16-12s, BH16-13d, BH16-14 and BH16-15) to assess the in-situ hydraulic conductivity of the shallow soils. The hydraulic conductivity field testing results are provided in Appendix D. 7. Monitoring of groundwater levels: Monitoring is currently on-going to measure the depth to the water table and assess seasonal groundwater flow conditions. Groundwater level measurements have been obtained in the site monitoring wells and piezometers monthly since March Automatic water level recorders (dataloggers) were installed in six of the on-site monitoring wells (BH16-5, BH16-7, BH16-12d, BH16-13d, BH16-15d and BH16-16) and in eight of the piezometers (PZ4s/d, PZ5s/d, PZ8s/d and PZ9s/d) in order to record continuous water level fluctuations. The groundwater monitoring data and hydrographs are provided in Appendix E. 8. Monitoring of surface water: Surface water observations and spot-flow measurements have been obtained monthly since April 2016 at three locations along Bruce Creek and two locations along Berczy Creek (Figure 4). Flow was estimated using a stream area-velocity method. Automatic water level recorders (dataloggers) were installed at staff gauges SG4, SG5, SG8 and SG9 as well as at culverts SG C-1 and SG C-2. The surface water monitoring data are summarized in Appendix F. 9. Water quality testing: Groundwater samples were collected from two monitoring wells (BH16-5 and BH16-15s) and one surface water sample was collected from both the Bruce Creek and Berczy Creek monitoring stations (SS1 and SG7, respectively) to characterize the baseline water quality across the Subject Property. The water samples were submitted to a qualified laboratory for analysis of general quality indicators (e.g., ph, hardness, and conductivity), basic ions (including chloride and nitrate) and selected metals. The testing results are provided in Appendix G. 10. Water balance calculations: A spreadsheet model has been used to calculate the pre-development water balance (based on existing land use conditions) and post-development water balance (based on the proposed development concept) to assess the potential impacts of land development on the local groundwater recharge conditions. Separate calculations were completed for the East Draft Plan and West Draft Plan areas for the overall Subject Property as requested by the TRCA. A feature based water balance was also completed specifically for the catchment area of the Woodlot/Wetland feature located within the East Draft Plan area as requested by the TRCA. The detailed water balance calculations are provided in Appendix H. R.J. Burnside & Associates Limited _York Downs Hydrogeological Assessment and Water Balance
9 Sixteenth Land Holdings Inc. 4 Hydrogeological Assessment and Water Balance th Avenue, City of Markham September Physical Setting 2.1 Physiography and Topography The study area is located within a physiographic region known as the Peel Plain (Chapman and Putnam, 1984). The Peel Plain consists of a thin veneer of lacustrine silt and clay deposited over glacial till which has a flat to rolling topography with generally more incised slopes in the vicinity of the watercourses (Figure 2). The land surface regionally slopes to the south, with a maximum relief amplitude across the Subject Property of about 22 m. The highest elevations within the Subject Property are about 198 masl in the north sloping downwards to 174 masl in the southeast (Figure 2). 2.2 Drainage The Subject Property is located in the Rouge River watershed within the jurisdiction of the Toronto and Region Conservation Authority (TRCA). The Subject Property is traversed by both Bruce Creek and Berczy Creek (Figure 2) which bisect the Subject Property and flow southeast. Bruce Creek enters the northern boundary of the property approximately 750 m east of Warden Avenue and 825 m south of Major Mackenzie Drive, meandering close to 2.2 km before exiting the property at 16 th Avenue, approximately 400 m west of Kennedy Road. Berczy Creek enters the western property boundary at Warden Avenue and immediately exits the Subject Property flowing southeast through the existing residential area. Berczy Creek re-enters the Subject Property approximately 550 m east of Warden Avenue and 325 m north of 16 th Avenue, flowing approximately 500 m before exiting the property at 16 th Avenue, approximately 700 m east of Warden Avenue. The southwest corner of the Subject Property drains to the southwest, towards Berczy Creek, and the remainder of the property drains to Bruce Creek (Figure 2). Flow monitoring has been conducted monthly in Bruce Creek at three monitoring locations: SS1 at the northern boundary of the Subject Property, SS2 located midway along the Creek in vicinity of the centre of the Subject Property, and SS3 at the southern boundary of the Subject Property as shown on Figure 4. Monitoring of flows on this watercourse indicate that Bruce Creek is perennial. Flow rates observed along the Creek ranged between a low of 82 L/s at SS2 on June 29, 2016 three days following a rainfall event and a high of 437 L/s at SS3 on April 22, 2016 one day following a rainfall event (Table F-1, Appendix F). On three occasions, the flow in Bruce Creek was found to decrease from SS1 to SS2 then increase from SS2 to SS3. The loss in flow between SS1 and SS2 was found to range from 7 L/s to 36 L/s and may be attributed to flows from Bruce Creek diverted to a series of golf course ponds via culverts located along the Creek valley (Figure 2). Ponds C and D are connected to the flows of Bruce Creek via a culvert system; Bruce R.J. Burnside & Associates Limited _York Downs Hydrogeological Assessment and Water Balance
10 Sixteenth Land Holdings Inc. 5 Hydrogeological Assessment and Water Balance th Avenue, City of Markham September 2016 Creek contributes flow to Pond C; Pond C flows to Pond D; and Pond D drains back to Bruce Creek. The gain in flow between SS2 and SS3 was found to range from 62 L/s on April 22, 2016 during spring runoff conditions and one day following a rainfall event to 10 L/s on June 29, 2016, three days following a rainfall event. As will be discussed in Section of this report, the Bruce Creek valley appears to intersect a sand layer found beneath the Subject Property. Groundwater levels observed in the monitoring wells (discussed below in Sections and 2.4.5), suggests that groundwater is discharging to Bruce Creek from the sand layer (refer to Section 2.3.3) and contributes baseflow to the watercourse. It is noted that data collected on May 20, 2016 does not reflect the pattern observed during the other events reported above and measurement inaccuracy is suspected. Flow was observed to increase from SS1 to SS2 by approximately 10 L/s, and then decrease from SS2 to SS3 by approximately 32 L/s during the May 20, 2016 monitoring event. Monthly flow monitoring was also conducted in Berczy Creek at SS5 located along Warden Avenue, south of Major Mackenzie and SS4 located in the southwest corner of the Subject Property as shown on Figure 3. Flow rates observed along Berczy Creek ranged between a low of 33 L/s on June 29, 2016, three days following a rainfall event and a high of 271 L/s on April 22, 2016, one day following a rainfall event (Table F-1, Appendix F). Flow in Berczy Creek was found to increase from SS5 (upstream) to SS4 (downstream) during three of the monitoring events. Monitoring at SS4 was not accessible during one of the events. The gain in flow was found to range from 10 L/s on June 29, 2016 to 70 L/s on July 29, Geology Surficial Geology Surficial geology mapping published by the Ontario Geological Survey (1999) shows that the majority of the Subject Property are covered by glaciolacustrine silt and clay deposits (Figure 3). The north and northeastern portions of the East Draft Plan area have been mapped as glaciolacustrine sand and gravel deposits and a small area in the northwest corner of the West Draft Plan area is mapped as silty to sandy till. Sand, silt, clay and organics are mapped along the Bruce and Berczy Creek valleys (Figure 3). The geotechnical drilling records generally confirm that the Subject Property are covered by glaciolacustrine silt and clay deposits, though they did not encounter glaciolacustrine sand and gravel at surface as widely shown on the published mapping. The borehole logs, provided in Appendix B, show that sand and gravel deposits were found at surface or underlying the fill material at boreholes BH14-18, BH14-20 and BH16-12 in isolated areas mapped as glaciolacustrine sand and gravel as well as at BH14-5, BH14-14 and R.J. Burnside & Associates Limited _York Downs Hydrogeological Assessment and Water Balance
11 Sixteenth Land Holdings Inc. 6 Hydrogeological Assessment and Water Balance th Avenue, City of Markham September 2016 BH16-14 (refer to Figure 4 for locations). Silty to sandy till was not encountered at the surface during the drilling program in the northwest corner of the West Draft Plan area, but was found to be approximately 1 m to 2 m below ground surface underlying silty clay to clayey silt at boreholes BH14-29 and BH Bedrock Geology Bedrock in the study area consists of layered grey shale bedrock of the Blue Mountain Formation (OGS, 1991). Of the 44 MOECC well records within the Subject Property, six extend to the bedrock (Appendix A). The reported depth to bedrock ranges from approximately 35 m to 57 m and the reported bedrock elevations ranges between 128 masl and 150 masl. Published bedrock topography mapping suggests the bedrock generally slopes to the southwest in this area and the elevation ranges from approximately 134 masl in the southwest corner to 150 masl at the northeast corner of the property Hydrostratigraphy The local MOECC well records (Appendix A) provide geology data that have been used along with all of the site-specific geological information obtained from the geotechnical boreholes and groundwater monitoring wells drilled on the property (Appendix B) to assess the local stratigraphy. To illustrate the local geological conditions, six schematic cross-sections through the Subject Property have been prepared. The cross-section locations are shown on Figure 5 and the cross-sections are shown on Figures 6 through 11. On the cross-sections, an interpretation of the major hydrostratigraphic units has been made based on the overall sediment characteristics. The interpretation has also been informed by modelling work completed by the TRCA for the Rouge River Watershed (2008) that outlined the hydrostratigraphic framework in the Markham area. Cross-sections through the Rouge River Watershed prepared by the TRCA (2008) identified three major overburden aquifer systems described in order of increasing depth as the: 1. Oak Ridges Aquifer Complex (ORAC), formed within the ORM sediments and sometimes referred to as the Upper Aquifer. 2. Thorncliffe Aquifer (or Middle Aquifer), formed by the sandy sediments of the Thorncliffe Formation and generally separated from the overlying ORAC by the Newmarket till aquitard. 3. Scarborough Aquifer (Lower Aquifer), formed by sandy sediments of the Scarborough Formation overlying the bedrock, and separated from the Thorncliffe Aquifer by the Sunnybrook aquitard. R.J. Burnside & Associates Limited _York Downs Hydrogeological Assessment and Water Balance
12 Sixteenth Land Holdings Inc. 7 Hydrogeological Assessment and Water Balance th Avenue, City of Markham September 2016 The cross-sections through the Subject Property (Figures 6 through 11) generally show a thick layer of finer-grained soils (glaciolacustrine silt and clay and glacial till deposits) overlying the bedrock, interspersed with lenses and layers of sand of variable thickness and extent. These silt, clay and till deposits typically restrict groundwater movement and are considered to form aquitard layers and the sandier deposits are considered as aquifers. The overburden sequence ranges in thickness from about 35 m to more than 60 m to bedrock (Figures 6 through 11). The sand lenses and layers encountered between elevations of about 165 masl and 190 masl across the Subject Property are interpreted to be part of the Oak Ridges Aquifer Complex (ORAC) or equivalent deposits. The ORAC thins and pinches out on the south slope of the Oak Ridges Moraine, and in the Markham area, the aquifer may be thin and discontinuous or absent. These sand layers are interpreted to intersect the Bruce Creek valley and may locally provide contributions to baseflow (Figures 6, 8, and 10). A deeper sand layer is found beneath the Subject Property between elevations of about 145 masl and 165 mas (Figures 6 through 11). This layer appears to be continuous from north to south beneath the west side of the Subject Property (Figure 9), but the well data suggest the aquifer may thin and pinch out to the east (Figures 6, 7 and 8). This deeper sand layer is interpreted to be the Thorncliffe Aquifer. There is no evidence of the deeper Sunnybrook aquifer beneath the Subject Property Soil Hydraulic Conductivity and Infiltration Rates There are various methods that can be used to assess soil hydraulic conductivity, i.e., the ability of the soil to transmit groundwater. Grain-size data and soil characteristics can be used to provide a general estimate of hydraulic conductivity. Single well bail-down tests and constant-head tests are used in groundwater monitoring wells to assess site-specific hydraulic conductivity. These methods have been used to estimate the hydraulic conductivity of the soils encountered in the Subject Property as discussed below Estimates from Soil Grain-Size During the 2014 and 2016 drilling programs, 27 representative soil samples were collected and analysed for grain-size distribution by Golder (Appendix C). The grain-size analyses were conducted on various soil types found across the property. A summary of the hydraulic conductivity values estimated from the individual grain-size analyses using the Hazen approximation method is provided in Table C-1 (Appendix C) and ranges of hydraulic conductivities for each soil type are presented below in Table 1a. The Hazen method is designed to approximate the hydraulic conductivity of more permeable R.J. Burnside & Associates Limited _York Downs Hydrogeological Assessment and Water Balance
13 Sixteenth Land Holdings Inc. 8 Hydrogeological Assessment and Water Balance th Avenue, City of Markham September 2016 sediments; however, it is still considered useful in finer grained sediments to provide a general indication of the low range of the hydraulic conductivity values In-situ Well Tests To assess the in-situ hydraulic conductivity of the screened intervals, single well response tests were completed at BH16-5, BH16-6, BH16-9, BH16-12s, BH16-13d, BH16-14s and BH16-15s (refer to Figure 4 for monitoring well locations and Appendix B for borehole logs). A constant-head test was completed in BH16-5 using a Waterra foot valves and tubing assembly to pump the well at different rates and measuring the (quasi) stead-state drawdown at each flow rate, using the field technique described by Rannie and Nadon (1988). Bail-down tests were completed at BH16-6, BH16-9, BH16-12s, BH16-13d, BH16-14s and BH16-15s as steady-state drawdown would not be achieved within a reasonable time frame under continuous, low-flow pumping. The test results are provided in Appendix D and the calculated hydraulic conductivity values are summarized below and in Table 1a. BH16-5 is screened in sand. The recovery in this well was rapid, and the results of the constant-head test at this location suggest a relatively high hydraulic conductivity of 8.3 x 10⁻⁴ cm/sec. BH16-6 is screened in silty sand to sandy silt. The results of the bail-down test at this location suggest a low-moderate hydraulic conductivity of 5.8 x 10⁻⁵ cm/sec. BH16-9 is screened in silty clay, sandy to trace sand. The results of the bail-down test at this location suggest a low-moderate hydraulic conductivity of 1.2 x 10⁻⁵ cm/sec. BH16-12s is screened in sand and silt to sandy silt till. The results of the bail-down test at this location suggest a low-moderate hydraulic conductivity of 1.6 x 10⁻⁵ cm/sec. BH16-13d is screened in sand and silt to sandy silt. The results of the bail-down test at this location suggest a low hydraulic conductivity of 8.8 x 10⁻⁶ cm/sec. BH16-14s is screened in silty sand. The results of the bail-down test at this location suggest a moderate hydraulic conductivity of 2.7 x 10⁻⁴ cm/sec. BH16-15s is screened in sand and silt. The results of the hydraulic conductivity testing at this location indicate a low-moderate hydraulic conductivity of 4.1 x 10⁻⁵ cm/sec. R.J. Burnside & Associates Limited _York Downs Hydrogeological Assessment and Water Balance
14 Sixteenth Land Holdings Inc. 9 Hydrogeological Assessment and Water Balance th Avenue, City of Markham September 2016 Table 1a: Summary of Hydraulic Conductivity Test Results Soil Type Hydraulic Conductivity (cm/sec) Hazen Estimation Hydraulic Conductivity (cm/sec) In-Situ Test Silty Clay <1.0 x Sandy Clayey Silt to Clayey <1.0 x 10⁻⁶ to 2.3 x x 10-5 Sand Till Sandy Silt to Silty Sand Till 1.0 x 10⁻⁶ to 2.2 x x 10-5 Silty Sand to Sand 2.6 x 10⁻⁴ to 8.3 x x 10-6 to 8.3 x Infiltration Tests To assess surficial infiltration potential, a series of tests using a Turf-Tec double ring infiltrometer were completed at selected locations across the site (Figure 4). The test results are provided in Figures D8 to D14, in Appendix D. The tests were completed by removing the topsoil in the test area and installing the infiltrometer in the underlying soil. Both rings of the infiltrometer were then filled with water and the time for the water level in the inner ring to fall 10 mm was recorded. This was repeated until consistent readings were recorded for at least three consecutive intervals. The test results are discussed below and are summarized in Table 1b. Graphs of the test results are provided in Appendix D. Seven infiltration tests were completed across the Subject Property on May 30 and June 3, 2016 (IT1, IT2, IT3, IT4, IT5, IT6 and IT7 on Figure 4). Tests IT1, IT2 and IT3 were completed across the southern extent of the West Draft Plan area. Test IT1 was conducted at a depth of 0.35 m in sandy silt till with some gravel. The results of the test show that the soil has an infiltration rate of approximately 200 mm/hour (Figure D-8, Appendix D). Test IT2 was completed at a depth of 0.4 m in silty sand till and gravel. The results of the test show that the soil has an infiltration rate of approximately 1,000 mm/hour (Figure D-9, Appendix D). Test IT3 was completed at a depth of 0.40 m in sandy silt till with some clay. The results of the test show that the soil has an infiltration rate of approximately 200 mm/hour (Figure D-10, Appendix D). Test IT4 was conducted approximately in the centre of the West Draft Plan area (Figure 4) at a depth of 0.45 m in clayey silt with trace sand. The results of the test show that the soil has an infiltration rate of approximately 135 mm/hour (Figure D-11, Appendix D). Tests IT5 and IT6 were completed in the northeast corner of the East Draft Plan area (Figure 4). Test IT5 was conducted at a depth of 0.35 m in clayey silt till and had an infiltration rate of approximately 50 mm/hour (Figure D-12, Appendix D). Test IT6 was completed at a depth of 0.4 m in sandy silt with trace clay. The results of the test show R.J. Burnside & Associates Limited _York Downs Hydrogeological Assessment and Water Balance
15 Sixteenth Land Holdings Inc. 10 Hydrogeological Assessment and Water Balance th Avenue, City of Markham September 2016 that the soil has an infiltration rate of approximately 360 mm/hour (Figure D-13, Appendix D). Test IT7 was conducted at the northern extent of the West Draft Plan area (Figure 4) at a depth of 0.45 m in silty sand and gravel. The results of the test show that the soil has an infiltration rate of approximately 360 mm/hour (Figure D-14, Appendix D). Table 1b: Summary of Infiltration Rates Soil Type Measured Field Infiltration (mm/hour) Clayey Silt to Clayey Sand Till 50 to 135 Sandy Silt to Silty Sand 200 to Discussion of Hydraulic Conductivity Results The observed infiltration rates of 200 mm/hour to 360 mm/hour at test locations IT1, IT3 and IT7 (Table 1b) are higher than expected based on the nature of the material, i.e., silty sand to sandy silt deposits that would be expected to have a hydraulic conductivity of about 1 x 10⁻⁵ cm/sec (Table 1a). A hydraulic conductivity value of 10-5 cm/sec would be equivalent to about 30 mm/hour (Ontario Ministry of Municipal Affairs & Housing OMAH), 1997 Site Evaluation and Soil Testing Protocol for Stormwater Infiltration). Tests IT4 and IT5 were completed in clayey silt soils and had infiltration rates of approximately 50 mm/hour and 135 mm/hour, respectively (Table 1b). Again, these infiltration rates are higher than expected for clayey silt soils, as the hydraulic conductivity of the clayey silt soils of 10-6 cm/sec or less would be equivalent to about 12 mm/hour or less). Test IT6 was completed in sandy silt with trace clay with and had an infiltration rate of approximately 360 mm/hour. Test IT2 was completed in silty sand and gravel with an infiltration rate of 1,000 mm/hour. All of the field IT test rates show higher values than the other methods. This is likely because the upper sediments are fractured, weathered and disturbed leading to higher secondary permeability, and the tests simulate saturated conditions. This is an important consideration for the success of lot level and shallow infiltration LID measures for stormwater management. Weathering and fracturing is expected to decrease with depth, so the overall infiltration potential across the Subject Property that will contribute groundwater recharge to depth will be more limited. It is concluded that the hydraulic conductivity of the surficial soils is generally suitable for the use of LID measures to promote shallow infiltration. It is noted that all test locations were completed in areas where 0.5 m to 3.5 m of fill material will be added as part of the proposed grading plan. Site-specific testing of the soils proposed for fill material and at R.J. Burnside & Associates Limited _York Downs Hydrogeological Assessment and Water Balance
16 Sixteenth Land Holdings Inc. 11 Hydrogeological Assessment and Water Balance th Avenue, City of Markham September 2016 the depths of the proposed infiltration LID measures should be completed during detailed design to confirm actual infiltration rates. 2.4 Hydrogeology Local Groundwater Use The Subject Property is situated within a developed community. All lands surrounding the Subject Property are residential subdivisions that are municipally serviced with lakebased supplies. The proposed development will also be municipally serviced and there is no proposed on-site groundwater use for the development. The York Downs Golf & Country Club has a Permit to Take Water (PTTW) No DEPTU that allows the golf club to draw water from five groundwater wells and Bruce Creek to supplement irrigation water stored in a large off-line storage reservoir. Groundwater supply wells at the Subject Property are separated into two clusters: the north cluster consisting of PW3 (TW1-69), PW4 (TW3-69) and PW6 (currently not used) and the south cluster consisting of PW1 (TW3-68) and PW2B (Figure 5) (Burnside, 2015). TW1-69 and TW3-69 are completed to depths of 28.3 m and 26.2 m, respectively. TW3-68 is completed to a depth of 31.4 m. Groundwater taking at the site predominantly relies on pumping wells PW1 and PW4 to refill the irrigation storage pond. The total average daily irrigation volume for the golf course is 1,804,700 L (Burnside, 2015). The golf course reports their annual groundwater use to the MOECC in accordance with their permits. It is anticipated that the golf course will continue this water use until such time as the Subject Property is developed. At that time, all pumping wells will be decommissioned in accordance with provincial regulations and, as noted above, there is no proposed future groundwater use for the development. Well Head Protection Areas (WHPAs) are zones around municipal water supply wells where land uses must be carefully planned and restricted to protect the quality of the water supply. Based on our review of WHPA mapping available from the Region of York, the Subject Property is not located within a WHPA, and as such, the development is not considered to pose a significant threat to drinking water supplies Groundwater Levels Groundwater levels have been monitored in monitoring wells and piezometers across the Subject Property since March 2016, and the data are summarized in Tables E-1 and E-2 in Appendix E. Hydrographs for each monitoring location are also provided as Figures E-1 through E-32 in Appendix E to illustrate the water level variations. In R.J. Burnside & Associates Limited _York Downs Hydrogeological Assessment and Water Balance
17 Sixteenth Land Holdings Inc. 12 Hydrogeological Assessment and Water Balance th Avenue, City of Markham September 2016 addition to the manual water level measurements recorded at each location, an automatic water level recorder (datalogger) was installed in six monitoring wells (BH16-5, BH16-7, BH16-12d, BH16-13d, BH16-15d and BH16-6) and in eight piezometers (PZ4s/d, PZ5s/d, PZ8s/d and PZ9s/d) to record continuous water levels. The groundwater monitoring data show the following (refer to Figure 4 for the monitoring locations and the data tables and hydrographs in Appendix E): The shallow monitoring wells installed in the shallow till and shallow sand layers across the Subject Property (BH16-3, BH16-4, BH16-6, BH16-7, BH16-8, BH16-9, BH16-10, BH16-11, BH14-1, BH14-2, BH14-8, BH14-12, BH14-15, BH14-17, BH14-29 and BH14-33) were found to have groundwater levels fluctuating between approximately 0.2 m (BH16-10, Figure E-8 in Appendix-E) to 4.9 m (BH16-3, Figure E-1 in Appendix E) below ground surface. The seasonal variation in groundwater levels in these wells ranged from 0.3 m (BH14-1, Figure E-15 in Appendix E) to 2.1 m (BH14-17, Figure E-21 in Appendix E). Monitoring well BH16-5 is the only shallow well that had groundwater levels above ground surface. This well is located in a topographically low area in the north central portion of the property (Figure 4). Groundwater levels at this well ranged between approximately 0.3 m above ground surface (March and April) to 0.7 m below ground surface (refer to Figure E-3 in Appendix E). Nested monitoring wells (e.g., wells located adjacent to each other but completed at different depths) were installed in BH16-12s/d, BH16-13s/d, BH16-14s/d and BH16-15s/d. Monitoring wells BH14-3 (shallow) and BH16-16 (deep) is also interpreted as a nest, though they are located approximately 25 m apart. Monitoring well nest BH16-12s/d is located within a small valley feature in the northeast corner of the site in vicinity of the existing stormwater management pond Pond H. The shallow well is installed in a sand layer and the deep well is installed in the underlying silty clay till (Figure 9). This well nest is located within a topographically low area adjacent to the stormwater management pond in the north east portion of the property (Figure 4). The groundwater levels in BH16-12s show a seasonal decline in the water levels with groundwater in the sand layer ranging from about 0.3 m to 2 m below grade (Figure D-10, Appendix E). The water levels recorded in BH16-12d have been above ground surface for the duration of the monitoring and have gently been declining over the summer months. The groundwater levels in BH16-12d are approximately 1 m to 2 m higher than the groundwater levels in the shallow well showing a strong upward gradient at this location ranging between approximately m/m to m/m (Figure E-10, Appendix E). R.J. Burnside & Associates Limited _York Downs Hydrogeological Assessment and Water Balance
18 Sixteenth Land Holdings Inc. 13 Hydrogeological Assessment and Water Balance th Avenue, City of Markham September 2016 Monitoring well nests BH16-13s/d, BH16-14s/d and BH14-3/BH16-16 are located in low-lying elevations in the southeast quadrant of the Subject Property and are within approximately 100 m of Bruce Creek (refer to Figure 4 for well locations). The shallow and deep wells are installed in the upper sand layers with the exception of BH16-14d; this well is installed in sandy clayey silt till (Figures 8, 10 and 11). The groundwater levels in BH16-13d are 1 m to 2 m or more higher than the groundwater levels in the shallow well, showing a strong upward gradient (Figure E-11, Appendix E). The water level in the deep well has generally been consistent during the monitoring period. The water level in the shallow well has been declining through the summer months and reflects recent drought conditions. Similarly the water levels in the BH16-14s/d nest have declined over the summer and the groundwater levels in BH16-14d have consistently been approximately 0.2 m higher than the groundwater levels in the shallow well (BH16-14s), showing an upward gradient (Figure E-12, Appendix E). The groundwater levels in BH16-16 were above ground surface in March and April showing spring discharge conditions and have gently been declining over the dry summer months to about 0.6 m below grade (Figure E-14, Appendix E). The groundwater levels in BH16-16 have also been higher than the groundwater levels in BH14-3 (shallow well) showing a strong upward gradient (Figures E-14 and E-17, Appendix E). Cross-sections C-C (Figure 8) and F-F (Figure 11) show that shallow sand deposits are present along the Bruce Creek Valley, and the upward gradients observed in BH16-13d, BH16-14d and BH16-16 suggest groundwater discharge conditions in these sands. Upward gradients in these wells nests ranged between m/m at BH16-14s/d to -0.2 m/m at BH14-3/BH It is interpreted that discharge from these sand layers contributes baseflow to Bruce Creek. The Bruce Creek flow monitoring indicates the creek gains flow as it traverses across the Subject Property. Monitoring well nest BH16-15s/d is located at the south end of the Subject Property in vicinity of the site entrance (Figure 4). The shallow and deep wells are installed silty sand layers that are isolated from each other by a clayey silt till layer (Figure 8). The water levels in the shallow well are more than 3 m below grade and have declined throughout the summer month (Figure E-13, Appendix E). The groundwater levels in the shallow well are approximately 0.5 m to 1.1 m higher than the deep groundwater levels showing a downward gradient ranging between approximately 0.05 m/m to 0.1 m/m and suggesting recharge conditions in this location (Figure E-13, Appendix E). Piezometers were installed adjacent to a number of the golf course ponds that are located along the Bruce Creek (PZ1, PZ2 and PZ6; refer to Figure 4 for locations). Groundwater levels in PZ1 and PZ6 were consistently lower than the surface water levels measured in adjacent ponds at SG1 (Pond C) and SG6 R.J. Burnside & Associates Limited _York Downs Hydrogeological Assessment and Water Balance
19 Sixteenth Land Holdings Inc. 14 Hydrogeological Assessment and Water Balance th Avenue, City of Markham September 2016 (Pond A), respectively (Figures E-24 and E-29, Appendix E). These data suggest that the ponds will have a recharge function when they fill up with runoff and precipitation, particularly in the spring. Groundwater levels at PZ2 were below the surface water levels measured in the adjacent pond at SG2 (Pond D) during the spring and early summer (first four monitoring events), but during the summer months have been measured to be above the surface water level in the pond (Figure E-25, Appendix E). The steady rise in the water level in the piezometer suggests that this pipe is located in very low hydraulic conductivity soils that have restricted the inflow and stabilization to a static water elevation. This low hydraulic conductivity will also result in a lag of response between the pond levels and the local groundwater levels. Based on the closeness of the water elevations, it is interpreted that Pond D is excavated into the local water table and will function as described above for Ponds A and C, i.e., when the surface water levels are high in the ponds, they will have a recharge function. When surface water inputs are low, the local water table will sustain the pond features. Nested piezometers were installed along the Bruce Creek (PZ3s/d) and along Berczy Creek (PZ7s/d; refer to Figure 4 for locations). As shown on Figure E-26 in Appendix E, the groundwater levels in the shallow and deeper piezometer in the PZ3s/d nest are similar, showing a slight downward gradient from April through July (i.e., recharge conditions). The groundwater level in these piezometers was found to range between 0.16 mbgs to 0.68 mbgs. The groundwater levels in the shallow piezometer are very close to or slightly higher than the surface water levels measured at staff gauge SG3 suggesting groundwater discharge conditions to Bruce Creek. Groundwater levels in the deep piezometer were also higher than the surface water level measured at staff gauge SG3 on two occasions (Figure E-26, Appendix E). Groundwater levels in the shallow piezometer (PZ7s) reflect the surface water levels at SG7, illustrating the groundwater/surface water interaction in this location. The shallow groundwater levels at PZ7s were, however, consistently higher than the groundwater levels in the deeper PZ7d, showing a downward gradient (i.e. recharge conditions) in this location along Berczy Creek (Figure E-30, Appendix E). These data suggest that the watercourse may recharge the local groundwater in this area. Piezometer nest PZ4s/d is located within a reed/canary grass mineral marsh meadow (Natural Environment Report/Environmental Impact Study by Beacon, 2016) within the East Draft Plan area that receives runoff from the driving range area (Figure 4). The groundwater level in the shallow piezometer has been highly variable, ranging between approximately 0.2 mags in the spring to about R.J. Burnside & Associates Limited _York Downs Hydrogeological Assessment and Water Balance
20 Sixteenth Land Holdings Inc. 15 Hydrogeological Assessment and Water Balance th Avenue, City of Markham September mbgs during the summer months (Figure E-27, Appendix E). The datalogger in the deeper piezometer has shown a slow recovery of water levels illustrating low hydraulic conductivity soils, but in recent months appears to have stabilized about 0.7 m below grade. The hydraulic gradient is downwards (Figure E-27, Appendix E). It is interpreted that when standing water occurs during spring runoff that the feature has a recharge function Piezometer nests PZ5s/d and PZ8s/d were installed in a woodlot/wetland feature within the East Draft Plan area. This area is referred to as the Feature 1 Woodlot/Wetland in the Natural Environment Report/Environmental Impact Study by Beacon, 2016 (Figure 4). PZ5s/d is located within the wetland portion of the feature and has been monitored since March 2016 (Figure E-28, Appendix E). PZ8s/d is located within the woodlot portion of the feature and has been monitored since June 2016 (Figure E-31, Appendix E). Groundwater levels measured in PZ5s/d and PZ8s/d have been below ground surface throughout the duration of the monitoring period; ranging from approximately 0.4 m to 1.4 mbgs at PZ5s/d and 0.7 to 1.6 mbgs at PZ8s/d. Similar to the discussion for PZ4s/d above, the datalogger in PZ5d has shown a slow recovery of water levels illustrating low hydraulic conductivity soils, but in recent months appears to have stabilized at about 0.8 m below grade and below the surface water elevations in the feature (Figure E-27, Appendix E). The preliminary data for PZ8s/d show below grade groundwater elevation and a strong downward gradient (Figure E-32, Appendix E). It is interpreted that the wetland and woodlot features are supported by precipitation and surface water runoff and have a groundwater recharge function. PZ9s/d was installed within a small wetland near the western limits of the West Draft Plan area on August 5, 2016 (refer to Figure 4 for piezometer nest location). The groundwater level monitored immediately after installation was 0.96 mbgs in the shallow piezometer and 1.51 mbgs in the deep piezometer, suggesting a downward gradient beneath this feature as well (Figure E-32, Appendix E). Interpreted Groundwater Flow Conditions Spring groundwater elevation data from April 2016 are shown on Figure 12, along with the interpreted groundwater elevation contours for the Subject Property. The contours shown on Figure 12 represent the interpreted shallow groundwater in the shallow surficial soils across the Subject Property. The groundwater elevation data suggest that the water table in the upper till soils reflects the general surface topography and that the shallow groundwater flow patterns will mimic the surface water flow patterns (Figure 2), with flow moving from higher elevations R.J. Burnside & Associates Limited _York Downs Hydrogeological Assessment and Water Balance
21 Sixteenth Land Holdings Inc. 16 Hydrogeological Assessment and Water Balance th Avenue, City of Markham September 2016 towards lower elevations. A groundwater divide is interpreted to be roughly coincident with the surface water divide between the Bruce Creek and the Berczy Creek (compare Figure 2 and Figure 12). The shallow groundwater is interpreted to move across the Subject Property towards Bruce Creek, with the exception of the west half of the West Draft Plan area; shallow groundwater within the west half of the West Draft Plan Area is interpreted to flow towards Berczy Creek (Figure 12) Groundwater Flow Systems Areas where water from precipitation percolates or infiltrates into the ground and moves downward from the water table are known as recharge areas. These areas are generally in areas of relatively higher topographic elevation. Areas where groundwater moves upward are discharge areas and these generally occur in areas of relatively lower topographic elevation, such as along watercourses. Recharge and discharge may occur in local, intermediate and more regional flow systems. Infiltrating water at any given location may follow a shallow flow path and discharge a short distance away from the recharge area along the nearest slopes or in small watercourses, swales, agricultural ditches, wetlands, etc. This is referred to as a local groundwater flow system (i.e., flows that closely follow the existing topography with relatively short flow distances, e.g., up to a few hundred metres). Some water may follow much deeper and longer flow paths (hundreds to thousands of metres) to recharge underlying aquifers and discharge to features and watercourses possibly a very long way from the area of recharge. Such conditions may be referred to as intermediate and/or regional groundwater flow systems depending on the scale of analysis. In the study area, the groundwater flow conditions are interpreted to involve: 1) a local shallow system involving groundwater flow in the upper surficial portions of the till and glaciolacustrine sediments, and 2) deeper more regional groundwater flow systems involving the ORAC and Thorncliffe aquifers. The shallow local flow system is superimposed over the regional flow systems and more closely follows the local topography and surface water drainage patterns (Figure 12). Water infiltrating on the Subject Property will move laterally through the shallow soils to recharge the underlying shallow sands and discharge locally in Bruce Creek. The deeper regional systems are driven by recharge originating in the topographically higher Oak Ridges Moraine to the north of the study area. Flow moves through the aquifers to the south, and as the aquifer layers dip, thin and eventually pinch out, groundwater discharge conditions are evident. Artesian pressures are evident in MOECC well records for wells in the western portion of the Subject Property completed in the sand layer that has been interpreted as the Thorncliffe aquifer (refer to Section and refer to Figures 8 and 9). R.J. Burnside & Associates Limited _York Downs Hydrogeological Assessment and Water Balance
22 Sixteenth Land Holdings Inc. 17 Hydrogeological Assessment and Water Balance th Avenue, City of Markham September 2016 As discussed in Section 2.3.3, on the Subject Property, there are only isolated layers and lenses of sand that may be interpreted as possible ORAC deposits and the Thorncliffe aquifer may not be present in all locations. However, where present, the sandy layers of the ORAC may provide a means for shallow groundwater originating north of the Subject Property to locally contribute baseflow to Bruce Creek and the artesian heads in the Thorncliffe will act to support local high water table conditions. Local infiltration that seeps into the surficial soils is not able to move to depth to recharge the underlying Thorncliffe aquifer due to the upward hydraulic pressures Recharge and Discharge Conditions Monitoring well nests installed on the Subject Property indicate both downward and upward hydraulic gradients (Section 2.4.2). Monitoring well nests BH16-13s/d, BH16-14s/d and BH14-3/BH16-16 show upward hydraulic gradients and are within approximately 100 m of Bruce Creek. Upward gradients ranged between m/m at BH16-14s/d to -0.2 m/m at BH14-3/BH The interpreted cross-sections C-C (Figure 8) and F-F (Figure 11) through the Bruce Creek valley show shallow sand deposits are present along the Bruce Creek valley. The upward gradients observed in BH16-13d, BH16-14d and BH16-16 may reflect groundwater discharge from the sandy layers to Bruce Creek. The flow monitoring indicates that Bruce Creek gains flow as it traverses across the Subject Property, supporting the interpretation that the watercourse receives groundwater inputs (Section 2.2 and Table F-2 in Appendix F). Monitoring well nest BH16-12s/d showed an upward gradient ranging between approximately m/m to m/m from a silty clay to a sand and silt unit, indicating a discharge area. The upward gradients observed at BH16-12s/d are interpreted to be influenced by the location of the well nest on the side of a hill sloping toward a topographic low where stormwater management pond Pond H is located (Figure 4). The hydraulic head in the deep well is thought to be driven by a local flow system from the topographically higher recharge area in the northeast corner of the Subject Property. Monitoring well BH16-5, located to the west of Pond H (Figure 4) is the only shallow well that had groundwater levels above ground surface and discharge conditions in March and April This well is screened in a confined sand deposit (refer to Figure E-3 in Appendix E). Similar to BH16-12s/d, this well is located in a topographically low area and the groundwater levels observed in the well are interpreted to be influenced by the local flow system from the topographically higher area to the northeast. Monitoring well nest BH16-15s/d showed a downward gradient ranging between approximately 0.05 m/m to 0.1 m/m from a shallow sand and silt layer towards a deeper gravelly silty sand. These data suggest that this area of the property is a recharge area, i.e., an area where infiltrating precipitation may recharge into the topsoil and underlying sediments. R.J. Burnside & Associates Limited _York Downs Hydrogeological Assessment and Water Balance
23 Sixteenth Land Holdings Inc. 18 Hydrogeological Assessment and Water Balance th Avenue, City of Markham September 2016 Groundwater levels in piezometer PZ4s were observed to be 0.15 m above ground surface on March 29, 2016 suggesting discharge conditions (Figure E-28, Appendix E). Runoff from the driving range area drains and discharges within the mineral marsh meadow via a buried pipe. The groundwater level that suggests discharge conditions may in fact just represent the discharge of runoff water from the driving range. Dataloggers have been installed in both piezometers at PZ4s/d, at staff gauge SG4 to measure surface water elevations and at SG C-2 to monitor surface water flows leaving the mineral marsh meadow to confirm the groundwater/surface water interactions in this feature. Groundwater levels in PZ5s/d, PZ8s/d and PZ9s/d were all observed to have downward gradients indicating recharge conditions. Recharge at these locations is limited as a result of the underlying low hydraulic conductivity soils. Significant Groundwater Recharge Areas (SGRAs) and Ecologically Significant Groundwater Recharge Area (ESGRA) have been mapped for this area (TRCA, 2016). Review of this mapping show that the Subject Property is not located within an SGRA or an ESGRA. The findings of this report support the TRCA mapping as our investigation identified low rates of infiltration across the tableland, limited by the fine grained surficial sediments and till, as well as discharge conditions along the Berczy Creek and Bruce Creek valleys. 2.5 Water Quality Groundwater Quality To characterize the background groundwater quality on the property, groundwater samples were collected in April 2016 from MW16-5 and MW16-15s. The groundwater samples were analysed for ph, conductivity, basic ions and selected metals. The laboratory results are summarized in Table G-1 in Appendix G, and show the following: When compared to the Ontario Drinking Water Standards (ODWS), the groundwater is relatively hard (512 mg/l and 491 mg/l at MW16-5 and MW16-15s, respectively), exceeding the ODWS criteria of 100 mg/l. This is common for groundwater in southern Ontario. The sodium and chloride concentrations were higher at MW16-5 (68.8 mg/l and 150 mg/l, respectively) than MW16-15s (9.57 mg/l and 16 mg/l, respectively). The higher concentrations observed in MW16-5 may be more affected by inputs from surface activities (i.e., recharge of water impacted by road salt) than the shallow groundwater in MW16-15s. The chloride concentrations are below the ODWS of R.J. Burnside & Associates Limited _York Downs Hydrogeological Assessment and Water Balance
24 Sixteenth Land Holdings Inc. 19 Hydrogeological Assessment and Water Balance th Avenue, City of Markham September mg/l in both wells. The sodium concentration in MW16-5 (68.8 mg/l) is above the ODWS of 20 mg/l. The concentration of total dissolved solids (TDS) in MW16-5 (760 mg/l) and MW16-15s (697 mg/l) exceed the ODWS criteria of 500 mg/l. The iron concentration in MW16-15s (1.22 mg/l) exceeds the ODWS of 0.3 mg/l. The manganese concentration in MW16-5 (486 µg/l) and MW16-15s (78.1 µg/l) both exceed the ODWS of 50 µg/l. Nitrate levels in both wells were very low, with reported concentrations of 0.22 mg/l and <0.06 mg/l for MW16-5 and MW16-15s, respectively, and well below the ODWS of 10 mg/l for nitrate. The colour of the water collected from MW16-5 has a value of 7 TCU exceeding the ODWS aesthetic value of 5 TCU. All other concentrations were reported below the ODWS for parameters tested Surface Water Quality Surface water samples were collected at SS1 and SG7 in April 2016 to characterize the water quality in Bruce Creek and Berczy Creek, respectively. The surface water samples were analysed for ph, conductivity, basic ions and selected metals and the laboratory results are summarized in Table G-2 in Appendix G. In addition to the laboratory analyses, field monitoring of ph, temperature, dissolved oxygen, conductivity, salinity, total dissolved solids (TDS) and total suspended solids (TSS) was completed at the surface water stations when flow was present during the flow monitoring program. The results of the field quality monitoring are summarized in Table G-3 in Appendix G. The surface water quality data (Tables G-2 and G-3, Appendix G) show the following: The reported chloride concentrations are 380 mg/l and 120 mg/l at SS1 and SG7, respectively. The sodium concentrations are reported at 241 mg/l and 69.6 mg/l for SS1 and SG7, respectively. The total phosphorus concentrations were reported below the Provincial Water Quality Objective (PWQO) for phosphorus of 30 pg/l. Nitrate levels in both samples were very low, with reported concentrations of 1.99 mg/l and 1.70 mg/l for SS1 and SG7, respectively. R.J. Burnside & Associates Limited _York Downs Hydrogeological Assessment and Water Balance
25 Sixteenth Land Holdings Inc. 20 Hydrogeological Assessment and Water Balance th Avenue, City of Markham September 2016 The field chemistry data show that the TSS concentrations in Bruce Creek ranged from 8 mg/l to 28 mg/l and 10 mg/l to 18 mg/l in Berczy Creek. The ph level measurements in Bruce Creek and Berczy Creek ranged from 8.6 to 9.1. Conductivity measurements in Bruce Creek ranged from 701 ms/cm to 927 ms/cm and 727 ms/cm to 1445 ms/cm in Berczy Creek. The results of the surface water sampling show that the water quality in Bruce Creek and Berczy Creek meet the PWQO for the parameters tested, and show little impact from the surrounding land uses. 3.0 Water Balance In order to assess potential land development impacts on the local groundwater conditions, a detailed water balance analysis has been completed for the East and West draft plans to determine the pre-development infiltration volumes (based on existing land use conditions) and the post-development infiltration volumes that would be expected based on the proposed land use plan. The water balance calculations are provided in Appendix H and discussed below. 3.1 Water Balance Components A water balance is an accounting of the water resources within a given area. As a concept, the water balance is relatively simple and may be estimated from the following equation: P = S + ET +R + I where: P = precipitation S = change in groundwater storage ET = evapotranspiration/evaporation R = surface water runoff I = infiltration The components of the water balance vary in space and time and depend on climatic conditions as well as the soil and land cover conditions (i.e. rainfall intensity, land slope, soil hydraulic conductivity and vegetation). Runoff, for example, occurs particularly during periods of snowmelt when the ground is frozen, or during intense rainfall events. Precise measurement of the water balance components is difficult and as such, approximations and simplifications are made to characterize the water balance of a study area. Field observations of the drainage conditions, land cover and soil types, groundwater levels and local climatic records are important input considerations for the water balance calculations. The groundwater balance components for the Subject Property are discussed below: R.J. Burnside & Associates Limited _York Downs Hydrogeological Assessment and Water Balance
26 Sixteenth Land Holdings Inc. 21 Hydrogeological Assessment and Water Balance th Avenue, City of Markham September 2016 Precipitation (P) The long-term average annual precipitation for the area is 895 mm based on data from the Environment Canada Toronto Buttonville climate station (Station 615HMAK ' N, ' W, elevation masl) for the period between 1981 and Average monthly records of precipitation and temperature from this station have been used for the water balance component calculations in this study (Tables H-1 and H-2, Appendix H). Storage (S) Although there are groundwater storage gains and losses on a short-term basis, the net change in groundwater storage on a long-term basis is assumed to be zero so this term is dropped from the equation. Evapotranspiration (ET) / Evaporation (E) Evapotranspiration and evaporation components vary based on the characteristics of the land surface cover (i.e., type of vegetation, soil moisture conditions, perviousness of surfaces, etc.). Potential evapotranspiration (PET) refers to the water loss from a vegetated surface to the atmosphere under conditions of an unlimited water supply. The actual rate of evapotranspiration (AET) is often less than the PET under dry conditions (i.e., during the summer when there is a soil moisture deficit). In this report, the monthly PET and AET have been calculated using a soil-moisture balance approach, using average temperature data and climate information adjusted to the local latitude (refer to Tables H-1 and H-2 in Appendix H). Water Surplus (R + I) The difference between the mean annual P and the mean annual ET is referred to as the water surplus. Part of the water surplus travels across the surface of the soil as surface or overland runoff and the remainder infiltrates the surficial soil. The infiltration is comprised of two end member components: one component that moves vertically downward to the groundwater table (typically referred to as percolation, deep infiltration or net recharge) and a second component that moves laterally through the shallow soils as interflow that re-emerges locally to surface (i.e., as runoff) at some short time following cessation of precipitation. As opposed to the direct component of surface runoff that occurs overland during precipitation or snowmelt events, shallow interflow becomes an indirect component of runoff. The interflow component of surface water runoff is not accounted for in the water balance equation cited above since it is often difficult to distinguish between interflow and direct (overland) runoff, but both interflow and direct runoff contribute to the overall surface water runoff component from the property. R.J. Burnside & Associates Limited _York Downs Hydrogeological Assessment and Water Balance
27 Sixteenth Land Holdings Inc. 22 Hydrogeological Assessment and Water Balance th Avenue, City of Markham September Approach and Methodology The analytical approach to calculate a water balance for the Subject Property involved monthly soil-moisture balance calculations to determine the pre-development (based on existing land use conditions) and post-development (based on the proposed development concept plan) infiltration volumes. A soil-moisture balance approach assumes that soils do not release water as potential infiltration while a soil moisture deficit exists. During wetter periods, any excess of precipitation over evapotranspiration first goes to restore soil moisture. Once the soil moisture deficit is overcome, any further excess water can then pass through the soil as infiltration and either become interflow (indirect runoff) or recharge (deep infiltration). Considering the nature of the silt soils in the area, a soil moisture storage capacity of 125 mm was used for the predominantly short to moderate-rooted fairways throughout the golf course. A soil moisture storage capacity of 400 mm was used for longer-rooted vegetation, i.e., the wooded areas. Table H-1 (for 125 mm retention) and Table H-2 (for 400 mm retention) in Appendix H detail the monthly potential evapotranspiration calculations accounting for latitude and climate, and the actual evapotranspiration (AET) and water surplus components of the water balance based on the monthly precipitation and soil moisture conditions. The MOECC SWM Planning and Design Manual (2003) methodology for calculating total infiltration based on topography, soil type and land cover was used and a corresponding runoff component was calculated for the two soil moisture storage conditions (i.e., for 125 mm and 400 mm storage as presented on Tables H-1 and H-2 in Appendix H). The calculated water balance components from these tables are used to assess the predevelopment infiltration volumes on a draft plan basis (i.e., for the portions of the Subject Property within the East Draft Plan area and the West Draft Plan area) based on the existing land use characteristics (open space, buildings, wooded areas, etc.). The West Draft Plan area has been further divided into Berczy Creek and Bruce Creek catchment areas to assess conditions for each of these features. A post-development water balance scenario is then calculated for each draft plan area based on the proposed land development plan. The pre- and post-development calculations are provided in Tables H-4 (East Draft Plan), H-5a (West Draft Plan Berczy Creek Catchment area) and H-5b (West Draft Plan Bruce Creek Catchment area) in Appendix H. 3.3 Component Values The detailed monthly calculations show that a water surplus is generally available from December to May. As shown on the calculation tables, infiltration occurs during periods when there is sufficient water available to overcome the soil moisture storage R.J. Burnside & Associates Limited _York Downs Hydrogeological Assessment and Water Balance
28 Sixteenth Land Holdings Inc. 23 Hydrogeological Assessment and Water Balance th Avenue, City of Markham September 2016 requirements. In winter climates, frozen conditions affect when the actual infiltration will occur, however, the monthly balance calculations show the potential volumes available for these water balance components. The monthly calculations are summed to provide estimates of the annual water balance component values (Tables H-1 and H-2, Appendix H). A summary of these values is provided in Table 2. Table 2: Water Balance Component Values Water Balance Component Golf Course/Open Space Woodlot Average Precipitation 853 mm/year 853 mm/year Actual Evapotranspiration 599 mm/year 607 mm/year Water Surplus 254 mm/year 246 mm/year Infiltration 114 mm/year 135 mm/year Runoff 140 mm/year 111 mm/year 3.4 Pre-Development Water Balance (Existing Conditions) The pre-development water balance calculations for the portions of the Subject Property within the East Draft Plan and West Draft Plan areas are presented in Tables H-4 (East Draft Plan), H-5a (West Draft Plan Berczy Creek Catchment area) and H-5b (West Draft Plan Bruce Creek Catchment area) in Appendix H. As summarized on Tables H-4, H-5a and H-5b, the total areas of the Subject Property that are proposed for development within the East Draft Plan area, West Draft Plan Berczy Creek area and West Draft Plan Bruce Creek area are about ha, ha and ha, respectively. Land use is predominantly the golf course or open space land and wooded lands. The total areas for these two land cover types have been estimated and assigned appropriate water balance component values for either short-rooted vegetation for the golf course and open space (125 mm soil moisture storage) or longer-rooted vegetation for the wooded areas (400 mm soil moisture storage). The total calculated pre-development infiltration, runoff and evapotranspiration volumes are summarized in Table 3. R.J. Burnside & Associates Limited _York Downs Hydrogeological Assessment and Water Balance
29 Sixteenth Land Holdings Inc. 24 Hydrogeological Assessment and Water Balance th Avenue, City of Markham September 2016 Table 3: Summary of Pre-Development Infiltration, Runoff and Evapotranspiration Draft Plan Estimated Pre- Development Infiltration Volume (m 3 /year)* Estimated Pre- Development Runoff Volume (m 3 /year) Estimated Pre- Development Evapotranspiration (m 3 /year) East Draft Plan 81, , ,800 West Draft Plan 42,500 58, ,700 Berczy Creek West Draft Plan 59,400 95, ,600 Bruce Creek Total 183, , ,100 *It is acknowledged that infiltration rates are directly dependent upon the hydraulic conductivity of soils that may naturally vary over several orders of magnitude. Recognizing the wide margins of error associated with this analysis, the infiltration volumes presented in this report are considered simply as reasonable estimates for water balance comparisons and not firm values of actual infiltration. 3.5 Potential Urban Development Impacts to Water Balance Development of an area affects the natural water balance. The most significant difference is the addition of impervious surfaces as a type of surface cover (i.e., roads, parking lots, driveways, and rooftops). Impervious surfaces prevent infiltration of water into the soils and the removal of the vegetation removes the evapotranspiration component of the natural water balance. The evaporation component from impervious surfaces is relatively minor (estimated to be 10% to 20% of precipitation) compared to the evapotranspiration component that occurs with vegetation in this area (about 71% of precipitation in the study area). So the net effect of the construction of impervious surfaces is that most of the precipitation that falls onto impervious surfaces becomes surplus water and direct runoff. The natural infiltration components (interflow and deep recharge) are reduced. Water balance calculations of the potential water surplus for impervious areas are shown at the bottom of Table H-1 in Appendix H. There is an evaporation component from impervious surfaces and this is typically estimated to be between about 10% and 20% of the total precipitation. For the purposes of the calculations in this study, the evaporation has been estimated to be 15% of precipitation. The remaining 85% of the precipitation that falls on impervious surfaces is assumed to become runoff. Therefore, assuming an evaporation/loss from impervious surfaces of 15% of the precipitation, there is a potential water surplus from impervious areas of 725 mm/year. It is noted that the proposed development will be serviced by municipal water supply and waste water services. Therefore there will be no impact on the water balance and local groundwater or surface water quantity and quality conditions related to any on-site R.J. Burnside & Associates Limited _York Downs Hydrogeological Assessment and Water Balance
30 Sixteenth Land Holdings Inc. 25 Hydrogeological Assessment and Water Balance th Avenue, City of Markham September 2016 groundwater supply pumping or disposal of septic effluent. There are some existing groundwater supply wells within the Subject Property used for golf course irrigation (refer to Section 2.4.1). Further discussion on interim monitoring and decommissioning of any active water supply wells in the study area is provided in Sections 5.5 and Post-Development Water Balance With No Mitigation In order to assess the potential development impact on infiltration, the post-development infiltration volumes have been calculated for the East Draft Plan and West Draft Plan areas on Tables H-4 (East Draft Plan), H-5a (West Draft Plan Berczy Creek Catchment area) and H-5b (West Draft Plan Bruce Creek Catchment area) in Appendix H. These calculations assume no mitigation is in place and allow for the quantification of an infiltration target for the design of a low impact development (LID) strategy for stormwater management. The total areas for the proposed land uses in each subcatchment area have been estimated by Stantec based on the proposed development concept and the infiltration and runoff components for the postdevelopment land uses have been calculated using the MOECC SWM Planning and Design Manual (2003) methodology based on topography, soil type and land cover as shown on Tables H-1 and H-2 in Appendix H. The infiltration and runoff factors for the post-development calculations reflect the proposed grading across the Subject Property as shown on Table H-3. The total calculated post-development infiltration, runoff, and evapotranspiration volumes (without mitigation) are summarized in Table 4. Table 4: Summary of Post-Development Infiltration, Runoff and Evapotranspiration (no LID measures) Draft Plan Estimated Post- Development Infiltration Volume (m 3/ year) Estimated Post- Development Runoff Volume (m 3 /year) Estimated Post- Development Evapotranspiration (m 3 /year) East Draft Plan 38, , ,300 West Draft Plan 23, , ,000 Berczy Creek West Draft Plan 49, , ,600 Bruce Creek Total 111, , ,900 Comparing the values in Tables 3 and 4, the water balance calculations show that development has the potential to reduce the natural infiltration by 52% (42,800 m 3 /a) in the East Draft Plan area, 44% (18,500 m 3 /a) in the West Draft Plan Berczy Creek Catchment area and 18% (10,400 m 3 /a) in the West Draft Plan Bruce Creek Catchment area, with an overall site reduction of 39%. LID measures for stormwater management are recommended to try to make up the difference between the pre- and R.J. Burnside & Associates Limited _York Downs Hydrogeological Assessment and Water Balance
31 Sixteenth Land Holdings Inc. 26 Hydrogeological Assessment and Water Balance th Avenue, City of Markham September 2016 post-development infiltration conditions, i.e., the overall infiltration deficit volume of 71,700 m 3 /year. As noted above, with the wide margins of error associated with this type of analysis, the infiltration deficit volume is considered as a reasonable estimate that is suitable as a target or guide for LID strategy design. Comparisons of the pre-development and post-development runoff volumes show that there is an increase in runoff within the catchment areas by 170% in the East Draft Plan area, 180% in the West Draft Plan Berczy Creek Catchment area and 80% in the West Draft Plan Bruce Creek Catchment area, with an overall site increase of 140%. Further discussion of the stormwater management strategies to address the surface water runoff are provided in the FSR (Stantec, 2016). As discussed in Section 2.2, the East Draft Plan area and the eastern portion of the West Draft Plan area are within the Bruce Creek catchment. Comparing the pre-development infiltration and runoff to the post-development infiltration and runoff within the Bruce Creek Catchment area, the water balance calculations show that development has the potential to reduce the natural infiltration by 38% (53,100 m 3 /a) and increase the runoff by approximately 130% (303,700 m 3 /a). Comparisons of the pre-development and post-development evapotranspiration rates show that there is a significant decrease in evapotranspiration within the East and West Draft Plan areas as is typical of urban development due to the increase of impervious areas. Measures to promote and enhance vegetation in the urbanized areas can be used to improve the post-development evapotranspiration. On the Subject Property, it is intended that rates of evapotranspiration will improve as a result of enhanced plantings in Area E and within the Bruce Creek valley; specifically, in vicinity of the existing ponds as the majority are proposed to be filled in. Further discussion of the enhanced planting areas is provided in the Natural Environment Report (Beacon, 2016). 3.7 Water Balance Mitigation Strategies The basic premise for low impact development is to try to manage stormwater to minimize the runoff of rainfall and increase the potential for infiltration. As outlined in the MOECC SWMP Design Manual (2003) and Low Impact Development Stormwater Management Planning and Design Guide published by the CVC and TRCA (2010), there are a wide variety of mitigation techniques that can be used to try to reduce the increases in direct runoff that occur with land development and increase the potential for post-development infiltration. Techniques to maximize the water availability in pervious areas such as designing grades to direct roof runoff towards lawns, side and rear yard swales, and other pervious areas throughout the development where possible can considerably increase the volume of infiltration in developed areas. These types of surface LID techniques promote R.J. Burnside & Associates Limited _York Downs Hydrogeological Assessment and Water Balance
32 Sixteenth Land Holdings Inc. 27 Hydrogeological Assessment and Water Balance th Avenue, City of Markham September 2016 natural infiltration simply by providing additional water volumes in the pervious areas (i.e., these areas would receive precipitation as well as extra water from roof runoff). Increasing the topsoil thickness by about two times the normal thickness is also considered as beneficial to enhance storage of water in the topsoil and increase the potential for infiltration. This may be particularly effective in the summer months, when natural infiltration would not generally occur because the additional water overcomes the natural soil moisture deficit. Other mitigation techniques that can be considered to mitigate increases in runoff and reductions in infiltration include such measures as: permeable pavements, rain gardens, bioswales, subsurface infiltration trenches, galleries and pervious pipe systems. Subsurface methods should only be considered in areas where there is sufficient depth to water table to accommodate the systems within the unsaturated zone and sufficient soil hydraulic conductivity to function effectively. The MOECC manual recommends that subsurface galleries or trenches should be about 1 m above the high water table. The water balance calculations suggest that, without mitigation, the developed area will receive about 61% of the current amount of average annual groundwater infiltration. To minimize the potential development impacts to infiltration, the FSR (Stantec, 2016) proposes the incorporation of amended soils, downspout disconnection, bioretention and infiltration facilities into the development plan. East Draft Plan Area Amended soils are proposed for select areas within the East Draft Plan area using infiltration rates shown in Table H-6 in Appendix H. The amended soils will aid in the infiltration of runoff from roof downspout disconnection to rear yard lawns. A volumetric runoff reduction of 25% was applied as the surficial soils across the site are generally characterized as hydrologic soil groups (HSG) C and D. The estimated volume of precipitation that will be infiltrated across the East Draft Plan area as a result of downspout disconnection from 34,400 m 2 of roof area is approximately 6,200 m 3 /a (~14% of target) (refer to Table H-7). Stantec also proposes to direct precipitation from 40,000 m 2 of roof area within the East Draft Plan to perforated roof leader collector pipes (RLC), bioretention or infiltration facilities designed to infiltrate a 25 mm storm event. The Buttonville Airport precipitation data was used to correlate storm events to annual precipitation volumes in Table H-7 in Appendix H. The 25 mm storm event accounts for approximately 93% of precipitation. The annual precipitation data from the Buttonville climate station of 853 mm has been used for these calculations. Assuming 15% of the precipitation is loss to evaporation, the rate of precipitation directed to the infiltration trenches is calculated to be 725 mm/year. Using a total impervious area of 40,000 m 2 from which roof runoff will be directed to RLC, a bioretention enclave or infiltration facilities, the total annual volume of R.J. Burnside & Associates Limited _York Downs Hydrogeological Assessment and Water Balance
33 Sixteenth Land Holdings Inc. 28 Hydrogeological Assessment and Water Balance th Avenue, City of Markham September 2016 runoff directed to these facilities was then calculated. The calculations in Table H-7 (Appendix H) show that, assuming 93% of the precipitation (i.e., the 25 mm storm) is infiltrated in the bioretention and infiltration facilities, approximately 63% of the target can be met (~27,000 m 3 /a). The calculations suggest that natural infiltration that occurs on pervious surfaces, along with the mitigative measures proposed to address the groundwater infiltration deficit, do not meet the pre-development infiltration volume for the East Draft Plan area leaving a deficit of approximately 9,200 m 3 /a (~11% of pre-development infiltration volumes). It is noted that due to the high water table and the amount of cut proposed in the westcentral portion of the East Draft Plan area, infiltration trenches are not proposed as they could intersect the water table. In addition, Stantec has advised that approximately 3,700 m 3 /a of precipitation collected from roof tops will be directed to the West Draft Plan area to replicate similar conditions observed in the mineral marsh meadow in enhancement Area E. West Draft Plan Area Similar to the East Draft Plan area, amended soils are proposed for select areas within the West Draft Plan area using infiltration rates shown in Table H-6 in Appendix H. The amended soils aid in the infiltration of runoff from roof downspout disconnection from 32,500 m 2 of roof area to rear yard lawns; 20,500 m 2 of roof area in the West Draft Plan Berczy Creek Catchment area infiltrating approximately 3,800 m 3 /a (~21% of target) and 12,000 m 2 of roof area in the West Draft Plan Bruce Creek Catchment area infiltrating approximately 2,200 m 3 /a (~21% of target). Stantec also proposes to direct precipitation from 73,900 m 2 of roof area (34,600 m 2 from West Draft Plan Berczy Creek Catchment area and 39,300 m 2 from West Draft Plan Bruce Creek Catchment area) to the RLC, bioretention enclaves or infiltration facilities designed to infiltrate a 25 mm storm event. Using the same methodology described above for the East Draft Plan area, the calculations in Tables H-8a and H-8b (Appendix H) show that, assuming 93% of the precipitation (i.e., the 25 mm storm) is infiltrated in the RLC, bioretention and infiltration facilities, the targets will be exceeded by approximately 26% in the West Draft Plan Berczy Catchment area (~23,300 m 3 /a) and by 154% in the West Draft Plan Bruce Creek Catchment area (~26,500 m 3 /a). Together, this results in an overall increase of 72% over target for the overall West Draft Plan area. Natural infiltration that occurs on pervious surfaces along with the proposed mitigative measures for the West Draft Plan exceed the pre-development infiltration volume by approximately 8,800 m 3 /a (~21% increase in infiltration) for the West Draft Plan Berczy Creek Catchment area and approximately 20,200 m 3 /a (~34% increase in infiltration) for the West Draft Plan Bruce Creek Catchment area, with a total increase of approximately R.J. Burnside & Associates Limited _York Downs Hydrogeological Assessment and Water Balance
34 Sixteenth Land Holdings Inc. 29 Hydrogeological Assessment and Water Balance th Avenue, City of Markham September ,000 m 3 /a (~28% increase in infiltration) to the West Draft Plan area. The overall site-wide water balance for th Avenue, incorporating low impact development techniques into the proposed development, will infiltrate 111% of the pre-development infiltration volume, amounting to an increase of ~19,800 m 3 /a. Comparing the pre-development infiltration of the Bruce Creek Catchment area to the post-development infiltration, the water balance calculations show that development with the proposed comprehensive LID strategy has the potential to increase infiltration by approximately 8% (11,000 m 3 /a). 4.0 Woodlot/Wetland Feature Based Water Balance The Feature 1 woodlot/wetland is located within the East Draft Plan area (Figure 2) and is approximately 43,200 m 2 in size (including buffer area); 32,100 m 2 of woodlot and 11,100 m 2 of wetland. There is an external catchment area of approximately 29,700 m 2 that also drains to the feature (refer to Stantec Figure 2.14 in Appendix H). Monitoring well BH16-4 and piezometer nest PZ5s/d are located within the wetland portion of the feature and have been monitored since March Piezometer nest PZ8s/d is located within the woodlot portion of the feature and has been monitored since June As discussed in Section and 2.4.4, groundwater levels measured in BH16-4, PZ5s/d and PZ8s/d have been below ground surface throughout the duration of the monitoring period, indicating groundwater does not discharge to these features and that the woodlot/wetland feature is fed by precipitation and surface water runoff. Dataloggers have been installed in both piezometers at PZ5s/d and PZ8s/d, at staff gauges SG4 and SG8 to measure surface water elevations and at SG C-1 to monitor surface water flows leaving the woodlot/wetland feature to confirm the groundwater/surface water interactions in this feature (refer to Figure 4). A detailed water balance analysis has been completed for this feature to determine the pre-development runoff volumes (based on existing land use conditions) and the post-development runoff volumes that would be expected based on the proposed land use plan. The water balance calculations are provided in Appendix H and discussed below. 4.1 Pre-Development Water Balance (Existing Conditions) The pre-development water balance calculations for the woodlot/wetland feature and external drainage area is presented in Table H-9 in Appendix H. Similar to the site-wide water balance methodology discussed in Section 3, a soil moisture storage capacity of 125 mm was used for the predominantly short to moderate-rooted wetland area and a soil moisture storage capacity of 400 mm was used for longer-rooted vegetation, i.e., the wooded areas (refer to Table H-1 (for 125 mm retention) and Table H-2 (for 400 mm R.J. Burnside & Associates Limited _York Downs Hydrogeological Assessment and Water Balance
35 Sixteenth Land Holdings Inc. 30 Hydrogeological Assessment and Water Balance th Avenue, City of Markham September 2016 retention) in Appendix H). In summary from these appendix tables, the total calculated pre-development runoff volumes are summarized in Table 5. Table 5: Summary of Pre-Development Runoff to Woodlot/Wetland Feature Land Use Area Estimated Pre-Development Runoff Volume (m 3 /year) Estimated Pre-Development Evapotranspiration (m 3 /year) Wetland 1,550 6,650 Woodlot 3,550 19,500 External Drainage Area 4,150 17,800 Total 9,250 43, Post-Development Water Balance and Mitigation Strategies The development of the East Draft Plan area proposes to build houses and roads within the external drainage area to the feature, essentially eliminating surface water contributions from the upland area and creating a runoff deficit of approximately 4,150 m 3 /a (~45% of pre-development runoff). The wetland and woodlot areas will remain the same in post-development. The FSR (Stantec, 2016) proposes the incorporation of amended soils and downspout disconnection into the development plan to maintain the surface water runoff contribution to the woodlot/wetland feature. Similar to the methods discussed above in Section 3.7, amended soils are proposed for the rear yards backing onto the woodlot/wetland feature using the runoff rates shown in Table H-6 in Appendix H. The amended soils will also aid in the infiltration of runoff from roof downspout disconnection to rear yard lawns. The volume of precipitation that will runoff and be directed as sheet flow to the woodlot/wetland feature as a result of runoff from rear yard lawns and downspout disconnection from approximately 6,900 m 2 of roof area is approximately 4,100 m 3 /a (~99% of target). In summary from the appendix tables, the total calculated pre-development runoff volumes are summarized in Table 6. R.J. Burnside & Associates Limited _York Downs Hydrogeological Assessment and Water Balance
36 Sixteenth Land Holdings Inc. 31 Hydrogeological Assessment and Water Balance th Avenue, City of Markham September 2016 Table 6: Summary of Post-Development Runoff and Evapotranspiration to Woodlot/Wetland Feature With Mitigation Land Use Area Estimated Post-Development Runoff Volume (m 3 /year) Estimated Post-Development Evapotranspiration (m 3 /year) Wetland 1,550 6,650 Woodlot 3,550 19,500 External Natural Runoff from 300 1,600 Drainage Area Rear Yard Lawns Roof Downspout 4,100 0 Disconnection Total 9,200 27, Construction Considerations 5.1 Water Quality Depending on land use, runoff from urban developments may contain a variety of dilute contaminants such as suspended solids, chloride from road salt, oil and grease, metals, pesticide residues, bacteria and viruses. Generally, with the exception of the dissolved constituents such as nitrogen and salt, most contaminants are attenuated by filtration during groundwater transport through the soils. As such, the potential for effects on groundwater quality from infiltration in the urban areas is therefore expected to be limited. Any potential changes to the shallow groundwater quality are not expected to influence conditions in the surface water features given the limited discharge volumes. The deeper aquifer zones in the study area are well protected by thick layers of low hydraulic conductivity sediments and upward gradients and no effect on the groundwater quality in these aquifers is expected from the proposed development. 5.2 Construction Below Water Table The construction of buried services below the water table has the potential to capture and redirect groundwater flow through more permeable fill materials typically placed in the base of excavated trenches. Over the long-term, these impacts can lower the local groundwater table. To mitigate this effect, services to be installed below the water table should be constructed to prevent redirection of groundwater flow. This will involve the use of anti-seepage collars or clay plugs surrounding the pipes to provide barriers to flow and prevent groundwater flow along granular bedding material and erosion of the backfill materials. R.J. Burnside & Associates Limited _York Downs Hydrogeological Assessment and Water Balance
37 Sixteenth Land Holdings Inc. 32 Hydrogeological Assessment and Water Balance th Avenue, City of Markham September Dewatering/Depressurization Requirements The water table can be seasonally close to the existing ground surface in some areas, particularly along the watercourse valleys and in the west-central portion of the East Draft Plan area. Much of the upland area will be above the water table, however, subsurface excavations may encounter wet soil conditions, particularly in the spring and fall. The construction dewatering requirements may vary significantly depending on the local soils, the climate conditions, the construction season and the depth and size of the excavations. Over most of proposed development area, the surficial soils encountered during servicing will predominantly be relatively low hydraulic conductivity silt, clay and till sediments that would not be expected to produce much water. Minor seepage into excavations within the silty clayey soils can likely be handled, as required, by pumping from sumps within the trench excavations. There are areas where coarser-grained sand or gravel layers and/or heavily weathered and fractured till deposits may be encountered that may produce more significant volumes of groundwater flow. The shallow sand layers encountered across the Subject Property appear to be relatively discontinuous (refer to Section 5.3.2) and may not sustain significant flow of groundwater; however, for excavations and servicing, such areas may require more active dewatering or groundwater control systems involving networks of well points or groundwater control wells. Regional artesian conditions are evident in the western portion of the Subject Property, that are interpreted to be related to the presence of the Thorncliffe Aquifer (refer to Section 2.4.4). It is not anticipated that the regional aquifer will be directly encountered during servicing of the Subject Property; however, deeper excavations may require depressurization for construction. Dewatering and/or depressurization requirements and anticipated water flow volumes will be confirmed by geotechnical and hydrogeological investigations completed in support of detailed servicing design. The studies will build on the current knowledge of the existing hydrogeological conditions (i.e., areas where saturated sand and gravel layers are present) and determine the most effective method to control groundwater during construction. A groundwater management plan and sediment control system will be established such that the dewatering discharge water is returned to the local environment in a clear (non-turbid) condition. Recently the MOECC has introduced new regulations that allow for construction related dewatering to proceed under the Environmental Activity Sector Registry (EASR) process if dewatering volumes are below 400,000 L/d. Based on our knowledge of the regulations, the dewatering will either be allowed by a Category 3 Permit to Take Water (PTTW) or under the EASR process depending on the expected volume of water taking. Both the EASR process and the Category 3 PTTW application allow for the uncertainties R.J. Burnside & Associates Limited _York Downs Hydrogeological Assessment and Water Balance
38 Sixteenth Land Holdings Inc. 33 Hydrogeological Assessment and Water Balance th Avenue, City of Markham September 2016 of the construction process in relation to the duration of the dewatering period. The determination of which process should be followed (PTTW or EASR) is based on the expected volume of taking during dewatering; takings between 50,000 L/d and 400,000 L/d are required to register for the EASR while takings above 400,000 L/d are regulated by the PTTW process. 5.4 Well Decommissioning Prior to or during construction, it is necessary to ensure that all inactive wells within the development footprint have been located and properly decommissioned by a licensed water well contractor according to Ontario Regulation 903. This regulation applies to the active and inactive irrigation supply wells for the golf course and the groundwater monitoring wells installed for this study unless they are maintained throughout the construction for monitoring purposes. 6.0 Monitoring Groundwater and surface water monitoring at all monitoring wells, drive point piezometers, staff gauges and surface water stations will be completed on a monthly basis for a period of one year to establish seasonal fluctuations, confirm stable water elevations and assess the water table response to precipitation. Following one year of monthly monitoring, the monitoring frequency will change to quarterly for a period of one to two years, depending on the type and sensitivity of the features (wetlands, woodlots, etc.) in accordance with the ToR. Automatic water level recorders (dataloggers) were installed in six of the on-site monitoring wells (BH16-5, BH16-7, BH16-12d, BH16-13d, BH16-15d and BH16-16) and in eight of the piezometers (PZ4s/d, PZ5s/d, PZ8s/d and PZ9s/d) in order to record continuous water level fluctuations. Dataloggers were also installed at staff gauges SG4, SG5, SG8 and SG9 as well as at culverts SG C-1 and SG C-2. Monitoring of the groundwater elevation and surface water flow conditions will continue during and post-construction activities following the LID implementation. New monitoring wells may be installed where necessary to replace existing monitoring wells that may be decommissioned to accommodate construction activities. The proposed monitoring locations and frequency will be determined based on the final LID strategy design. R.J. Burnside & Associates Limited _York Downs Hydrogeological Assessment and Water Balance
39 Sixteenth Land Holdings Inc. 34 Hydrogeological Assessment and Water Balance th Avenue, City of Markham September Bibliography and References Chapman, L.J. and D.F. Putnam, The Physiography of Southern Ontario, Third Edition; Ontario Geological Survey, Special Volume 2, 270p. Accompanied by Map Environment Canada, Canadian Climate Normals , Toronto Buttonville Airport, Ontario. Golder Associates, June 12, Preliminary Geotechnical Investigation. Acquisition Due Diligence, York Downs Golf and Country Club, th Ave, Markham, Ontario. Report No Golder Associates, March 28, Technical Memorandum. Monitoring Well Log Summary, York Downs Golf Club Redevelopment, Markham, Ontario. Report No (8000). Ontario Geological Survey Bedrock Geology of Ontario, southern sheet, Ontario Geological Survey, Map 2544, scale 1:1,000,000. Ontario Geological Survey, Bedrock Topography, Markham area, southern Ontario. Holden, K.M., Thomas, J. and Karrow, R.F. Open File Map 196, scale 1:50,000. Ontario Ministry of the Environment, Storm Water Management Planning and Design Manual, March Ontario Ministry of Environment, Ontario Drinking Water Standards, Objectives and Guidelines, Revised June Ontario Ministry of the Environment and Climate Change, Water Well Records. Rannie, E.H. and R.L. Nadon, An inexpensive, multi-use, dedicated pump for groundwater monitoring wells. Ground Water Monitoring Review, v. 8, no. 4, p R.J. Burnside & Associates Limited, Permit to Take Water Renewal Application, York Downs Golf and Country Club Limited, Markham, Ontario. File No. PGD R.J. Burnside & Associates Limited _York Downs Hydrogeological Assessment and Water Balance
40 Sixteenth Land Holdings Inc. 35 Hydrogeological Assessment and Water Balance th Avenue, City of Markham September 2016 Sharpe, D.R., and P.J. Barnett Surficial Geology of the Markham Area, NTS 30M/14, Southern Ontario, Geological Survey of Canada, Open File 3300, Scale 1:50,000. Toronto and Region Conservation Authority (TRCA), Significant Groundwater Recharge Area (SGRA) mapping for the Rouge River Watershed. Kristina Anderson, personal communication, April 6, Toronto and Region Conservation Authority (TRCA), Ecologically Significant Groundwater Recharge Area (ESGRA) mapping for the Rouge River Watershed. Kristina Anderson, personal communication, March 17, R.J. Burnside & Associates Limited _York Downs Hydrogeological Assessment and Water Balance
41 Figures Figures


,")


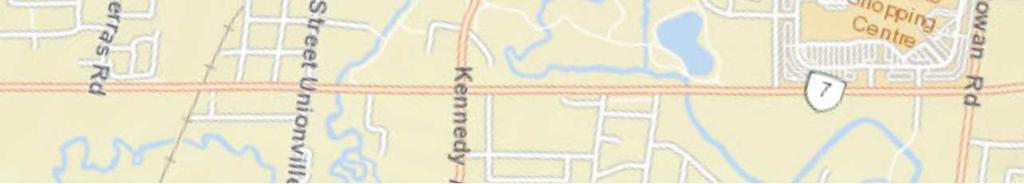
42 o Sources: Esri, HERE, DeLorme, USGS, Intermap, increment P Corp., NRCAN, Esri Japan, METI, Esri China (Hong Kong), Esri (Thailand), TomTom, MapmyIndia, OpenStreetMap contributors, and the GIS User Community LEGEND SUBJECT LANDS HYDROGEOLOGICAL ASSESSMENT AND WATER BALANCE TH AVENUE FIGURE 1 SITE LOCATION ,000 1,500 Metres SEPTEMBER 2016


43 HYDROGEOLOGICAL ASSESSMENT AND WATER BALANCE TH AVENUE! FIGURE 2 ROADWAY WOODED SURFACE WATER FLOW DIRECTION CONTOUR (1m intervals - masl) OPEN WATER Metres ÉÉ ÉÉ ÉÉ WETLAND ÉÉ ÉÉ ÉÉ DRAINAGE DIVIDE TOPOGRAPHY AND DRAINAGE 600 SEPTEMBER Print Date: 2016/09/21 Time: 10 :06 AM File Path: E:\Burnside work\ York Downs\ York Downs T&D.mxd ! ! ! ! ! ! ! 3!! D ! D Y R OA POND A K EN N E ! WATERCOURSE LEGEND SUBJECT LANDS ! WOODLOT WETLAND FEATURE TH AVENUE POND F 183 É ÉÉ É É É ÉÉ ÉÉ ÉÉ ÉÉ É É ÉÉ ÉÉ É ÉÉ É ÉÉ ÉÉ É 180 1É POND H UCE CREEK o BR POND E POND G É É É É ÉÉ ÉÉ 182 É É ÉÉ É É 83 É ÉÉ É É É ! POND D AVENU E ! POND B WARDE N POND C É É É É 19 7 É ÉÉ ÉÉ ÉÉ É ÉÉ É ÉÉ É ÉÉ É É É É BE RC ZY CREE K
44 5b 19 o BERCZYCREEK 5b POND C POND B POND H 9c POND D 5b WARDEN AVENUE POND G POND E BRUCECREEK 8a 5b 8a POND F KENNEDY ROAD 5b 16TH AVENUE Metres LEGEND SUBJECT LANDS WATERCOURSE ROADWAY OPEN WATER 5b: Stone-poor, carbonate-derived silty to sandy till 8a: Fine-textured glaciolacustrine deposits: Massivewell laminated 9c: Coarse-textured glaciolacustrine deposits: Foreshore-basinal deposits 19: Modern alluvial deposits POND A HYDROGEOLOGICAL ASSESSMENT AND WATER BALANCE TH AVENUE FIGURE 3 SURFICIAL GEOLOGY SEPTEMBER 2016 File Path: E:\Burnside work\ York Downs\ York Downs SG.mxd Print Date: 2016/09/21 Time: 10:08 AM


 SG2 \" S \" IT6")
 SG3 \" Ò BH14-29")

 SG8 \" BH16-4 Ò")


 SG5 SG C-1 # *")


 SG7 # * SS4 \" Ò \"")
 \" IT2")


45 # * o BH16-3 BH14-17 SS5 # * " S " BE RC ZY CREE K SS1 IT7 Ò BH16-7 " " " S Ò " Ò " " Ò IT5 BH14-8 " BH16-6 Ò PZ1 POND B! ( " SG1 POND C ) " Ò BH16-12s/d BH16-5 " Ò POND H PZ2 POND D! ( " ) SG2 " S " IT6 PZ3s/d BH14-33! ( " ) SG3 " Ò BH14-29 POND E AVENU E " ) SG9 " S " PZ4s/d! (" ) SG4 PZ8s/d! ( " ) SG8 " BH16-4 Ò SS2 " BH14-1 Ò BH14-2 "Ò Ò " BH14-34 Ò " BH14-3 "Ò BH16-16 K EN N E POND F D Y R OA " BH16-9 Ò! ( " ) SG5 SG C-1 # * IT4 PZ5s/d SG C-2 ì " Ò! ( " BH16-8 Ò ì POND G U C E C RE E K BH16-10 BR WARDE N PZ9s/d " Ò D BH16-13s/d BH14-15 " Ò BH16-14s/d " SÒ " BH16-11 Ò BH14-12 " PZ7s/d! (" ) SG7 # * SS4 " Ò " IT1 " S POND A PZ6! ( SG6 " ) " IT2 BH16-15s/d " Ò " Ò Print Date: 2016/09/21 Time: 10:11 AM " # * SS3 16TH AVENUE " Ò " Ò! ( SUBJECT LANDS " ) STAFF GAUGE MONITORING WELL (GOLDER 2014) ì LEGEND CULVERT MONITORING WELL (GOLDER 2016) # * SURFACE WATER MONITORING LOCATION WATERCOURSE " S INFILTRATION TEST LOCATION " HYDROGEOLOGICAL ASSESSMENT AND WATER BALANCE TH AVENUE FIGURE 4 DRIVE POINT PIEZOMETER MONITORING LOCATIONS Metres SEPTEMBER 2016 File Path: E:\Burnside work\ York Downs\ York Downs ML.mxd " S IT3


46 Ä ß á Äâ ß á â â Ä ß á Ä ß á â Ä ß á â Ä ß á â Ä â ß á â Ä ß á Ä ß á â Ä ß á â Äâ ß á â Ä ß á Äâ ß á â Ä ß á â Ä ß á Ä ß á â Ä ß á â Ä ß á â Äâ ß á â Ä ß á Ä ß á â Äâ ß á â Ä ß á Äâ ß á â Ä ß á Ä â ß á Ä ß á â Ä ß á â Ä ß á â Ä ß á â D BH14-26 " A â Ä ß á Ä ß á â BE RC ZY CREE K BH14-17 " BH16-6 Ò PW " BH16-2 "! Ò " BH14-10! Ò BH14-33 BH " Ò " BH14-30 "! Ò " BH16-8 Ò Ä ß á â AVENUE "! Ò " Ò "! Ò POND F " â Ä ß á Ä ß á â Ä ß á â Ä ß á â Ä ß á â Ä ß á â BH14-23 Ä ß á â Ò BH16-16 " BH14-1 " " BH14-2 BH14-34 " BH14-3 " ÄÒ!" ß á â Ä ß á â Ä ß á â " BH Ä ß á â D Y R OA Ò Ò ÒÒ " "! Ò KENNE " BH14-9 "! "Ò Ò BH14-24 BH BH16-9 B' " "! Ò â Ä ß á Ä ß á â " BH14-5 Ä ß á â POND E POND G " Ò Ä ß á â U C E C RE E K BH16-10 " Ò BR WARDE N B â Ä ß á Ä ß á â " Ò POND H â Ä ß á Ä ß á â " BH14-32 " "! Ò "! Ò BH16-12s/d BH16-5 " Ä ß á â Ä ß á â POND D BH Ä ß á â " "! Ò " Ò A' BH14-7 " "! Ò â Ä ß á Ä ß á â " "! Ò " BH14-18 "! Ò BH14-6 " BH16-1 "! Ò " â Ò ÄÒ!"" BH14-25 POND B ß BH16-7á POND C " Ò BH14-8 Ò " o BH16-3 " Ò PW4 "! Ò Ä ß á â F PW E Ä ß á â ââ Ä ß á Ä ß á â Ä ß á âá Ä ß Ä á ß á â â Ä ß " BH14-11 "! Ò " BH4-4 "! Ò BH14-12 BH16-15s/d " Ò PW BH16-14s/d BH16-11 " Ò " Ò Ä ß á â BH14-14 " "! Ò POND A Ä ß á ââ Ä ß á Ä ß á â Ä ß á â Ä ß á Äâ ß á â C' Ä ß á â " "! Ò BH " BH16-13s/d Ò BH14-15 " Ò Ä ß á â TH AVENUE Ä ß á â D' Ä ß á â Ä ß á â E' Ä ß á â LEGEND SUBJECT LANDS " Ò " Ò MONITORING WELL (GOLDER 2014) " "! Ò " "! Ò BOREHOLE (GOLDER 2016) MONITORING WELL (GOLDER 2016) Ä ß á â MOECC WELL RECORD LOCATION Ä ß á â F' Ä ß á â HYDROGEOLOGICAL ASSESSMENT AND WATER BALANCE TH AVENUE CROSS SECTION LOCATION KEY FIGURE 5 BOREHOLE (GOLDER, 2014) CROSS SECTION LOCATION KEY WATERCOURSE Metres SEPTEMBER 2016 Print Date: 2016/09/21 Time: 10:17 AM C â Ä ß á Ä ß á ÄÒ "â ß á â PW "! Ò " BH14-16 "! Ò BH14-22 File Path: E:\Burnside work\ York Downs\ York Downs XS.mxd D Ä ß á â "
47 A W 210 BH14-26 BH BH14-25 BH BH14-6 BH14-18 BH16-5 BH14-19 BH14-7 BH16-12 BH A' E INTERPRETED AS POSSIBLY ORAC OR EQUIVALENT DEPOSITS 200 BRUCE CREEK ELEVATION (masl - vertical exaggeration = 10x) INTERPRETED AS THORNCLIFFE AQUIFER 0m BEDROCK DISTANCE MW9 WELL IDENTIFICATION EXISTING GROUNDLINE GEOLOGICAL STRATIGRAPHY CONTACT STATIC WATER LEVEL (MOECC WELL RECORD) MEASURED WATER LEVEL (APRIL 22, 2016) WELL SCREEN CLAYEY SILT TILL SANDY SILT SHALE INTERPRETED GEOLOGICAL CONTACT CL Clay Si Silt cl clayey SA Sand si silty GR Gravel sa sandy STN Stones gr gravelly BLD Boulder TS Topsoil LMSN Limestone WATERCOURSE CROSSING FIGURE 6 INTERPRETED GEOLOGICAL CROSS SECTION A-A' SEPTEMBER 2016
48 B W 210 BH16-10 BH BH BH14-28 BH14-5 BH BH BH16-4 BH14-24 BH B' E BRUCE CREEK ELEVATION (masl - vertical exaggeration = 10x) INTERPRETED AS THORNCLIFFE AQUIFER INTERPRETED AS POSSIBLY ORAC OR EQUIVALENT DEPOSITS 0m DISTANCE BEDROCK MW9 WELL IDENTIFICATION EXISTING GROUNDLINE GEOLOGICAL STRATIGRAPHY CONTACT STATIC WATER LEVEL (MOECC WELL RECORD) MEASURED WATER LEVEL (APRIL 22, 2016) WELL SCREEN CLAYEY SILT TILL SANDY SILT SHALE INTERPRETED GEOLOGICAL CONTACT CL Clay Si Silt cl clayey SA Sand si silty GR Gravel sa sandy STN Stones gr gravelly BLD Boulder TS Topsoil LMSN Limestone WATERCOURSE CROSSING FIGURE 7 INTERPRETED GEOLOGICAL CROSS SECTION B-B' SEPTEMBER 2016
49 C W BH BH16-15s/d BH14-4 BH14-13 BH16-11 BH14-15 BH16-14s/d BH C' E BERCZY CREEK 190 INTERPRETED AS POSSIBLY ORAC OR EQUIVALENT DEPOSITS BRUCE CREEK ELEVATION (masl - vertical exaggeration = 10x) INTERPRETED AS THORNCLIFFE AQUIFER 0m DISTANCE BEDROCK INTERPRETED AS POSSIBLY ORAC OR EQUIVALENT DEPOSITS MW9 WELL IDENTIFICATION EXISTING GROUNDLINE GEOLOGICAL STRATIGRAPHY CONTACT STATIC WATER LEVEL (MOECC WELL RECORD) MEASURED WATER LEVEL (APRIL 22, 2016) WELL SCREEN CLAYEY SILT TILL SANDY SILT SHALE INTERPRETED GEOLOGICAL CONTACT CL Clay Si Silt cl clayey SA Sand si silty GR Gravel sa sandy STN Stones gr gravelly BLD Boulder TS Topsoil LMSN Limestone WATERCOURSE CROSSING FIGURE 8 INTERPRETED GEOLOGICAL CROSS SECTION C-C' SEPTEMBER 2016
50 D N BH14-26 BH16-1 BH BH14-27 BH BH14-31 BH BH D' S BERCZY CREEK ELEVATION (masl - vertical exaggeration = 10x) m 500 DISTANCE INTERPRETED AS THORNCLIFFE AQUIFER BEDROCK MW9 WELL IDENTIFICATION EXISTING GROUNDLINE GEOLOGICAL STRATIGRAPHY CONTACT STATIC WATER LEVEL (MOECC WELL RECORD) MEASURED WATER LEVEL (APRIL 22, 2016) WELL SCREEN CLAYEY SILT TILL SANDY SILT SHALE INTERPRETED GEOLOGICAL CONTACT CL Clay Si Silt cl clayey SA Sand si silty GR Gravel sa sandy STN Stones gr gravelly BLD Boulder TS Topsoil LMSN Limestone WATERCOURSE CROSSING FIGURE 9 INTERPRETED GEOLOGICAL CROSS SECTION D-D' SEPTEMBER 2016
51 E N 210 BH14-7 BH14-18 BH BH14-10 BH BH14-1 BH14-3 BH16-16 BH14-16 BH16-11 BH14-13 E' S INTERPRETED AS POSSIBLY ORAC OR EQUIVALENT DEPOSITS BRUCE CREEK ELEVATION (masl - vertical exaggeration = 10x) m 500 DISTANCE BEDROCK INTERPRETED AS THORNCLIFFE AQUIFER MW9 WELL IDENTIFICATION EXISTING GROUNDLINE GEOLOGICAL STRATIGRAPHY CONTACT STATIC WATER LEVEL (MOECC WELL RECORD) MEASURED WATER LEVEL (APRIL 22, 2016) WELL SCREEN CLAYEY SILT TILL SANDY SILT SHALE INTERPRETED GEOLOGICAL CONTACT CL Clay Si Silt cl clayey SA Sand si silty GR Gravel sa sandy STN Stones gr gravelly BLD Boulder TS Topsoil LMSN Limestone WATERCOURSE CROSSING FIGURE 10 INTERPRETED GEOLOGICAL CROSS SECTION E-E' SEPTEMBER 2016
")
 MEASURED WATER LEVEL (APRIL 22, 2016) WELL SCREEN CLAYEY SILT")

52 F N 210 BH14-7 BH16-12s/d BH14-24 BH BH14-21 BH14-22 BH16-13s/d BH F' S SWMP INTERPRETED AS POSSIBLY ORAC OR EQUIVALENT DEPOSITS BRUCE CREEK ELEVATION (masl - vertical exaggeration = 10x) BEDROCK 0m 500 DISTANCE MW9 WELL IDENTIFICATION EXISTING GROUNDLINE GEOLOGICAL STRATIGRAPHY CONTACT STATIC WATER LEVEL (MOECC WELL RECORD) MEASURED WATER LEVEL (APRIL 22, 2016) WELL SCREEN CLAYEY SILT TILL SANDY SILT SHALE INTERPRETED GEOLOGICAL CONTACT CL Clay Si Silt cl clayey SA Sand si silty GR Gravel sa sandy STN Stones gr gravelly BLD Boulder TS Topsoil LMSN Limestone WATERCOURSE CROSSING FIGURE 11 INTERPRETED GEOLOGICAL CROSS SECTION F-F' SEPTEMBER 2016


53 ! ! HYDROGEOLOGICAL ASSESSMENT AND WATER BALANCE TH AVENUE FIGURE 12 INTERPRETED SHALLOW GROUNDWATER FLOW SEPTEMBER File Path: E:\Burnside work\ York Downs\ York Downs GW.mxd Print Date: 2016/09/21 Time: 10:18 AM ! ! 185! INTERPRETED GROUNDWATER FLOW DIRECTION MEASURED WATER LEVEL (APRIL 22, 2016) Metres 19 WOODED D 200 D Y R OA 100! 0 K EN N E OPEN WATER 7 19 INTERPRETED GROUNDWATER CONTOUR (masl) WATERCOURSE DRIVE POINT PIEZOMETER 190! ( DRAINAGE DIVIDE ÉÉ ÉÉ ÉÉ WETLANDAREA ÉÉ ÉÉ ÉÉ " MONITORING WELL (GOLDER 2014) Ò " MONITORING WELL (BURNSIDE 2016) Ò contour_site_1m! ( LEGEND ROADWAY PZ SUBJECT LANDS " Ò Ò BH16-14s/d " BH16-11 Ò BH16-13s/d " BH14-15 " Ò " BH BH16-15s/d " Ò PZ8s/d! ( na BH " Ò ! ( TH AVENUE ! ( Ò ! 181 PZ7s/d 20 " BH16-4 Ò BH14-12 " PZ5s/d Ò ! ( ! ! BH16-12s/d " PZ4s/d! " BH16-9 Ò É ÉÉ É É É ÉÉ ÉÉ ÉÉ ÉÉ É É ÉÉ ÉÉ É ÉÉ É ÉÉ ÉÉ É 180 É " Ò BH É É É É ÉÉ ÉÉ 182 É É ÉÉ " Ò BH14-8 Ò " Ò BH "Ò Ò " BH14-34 Ò " BH "Ò na ! ÉÉ É ÉÉ É É É BH " BH16-8 Ò U C E C RE E K Ò " Ò PZ3s/d! ( BR BH16-10 " PZ9s/d! ( na AVENU E BH14-129! PZ2! ( WARDE N ! ( BH " Ò PZ " Ò BH Ò BE RC ZY CREE K BH " É É É É É ÉÉ ÉÉ ÉÉ É ÉÉ 195 É ÉÉ É ÉÉ É É o É É !
54 Appendix A MOECC Well Records Appendix A
55 TOWNSHIP CONCESSION (LOT) CON 05(014) CON 05(014) CON 05(014) CON 05(014) CON 05(014) CON 05(014) CON 05(014) CON 05(015) CON 05(015) CON 05(015) CON 05(015) 343 Well Computer Print Out Data as of November Page: 79 / UTM 1 DATE 2 CNTR / W / W / W / W / W / W / W / W / W / W W 1966/ CASING DIA 4 STAT LVL/PUMP LVL 7 RATE 8 /TIME HR:MIN WATER USE 9 SCREEN WELL # (AUDIT#) WELL TAG # INFO 10 DEPTHS TO WHICH FORMATIONS EXTEND 5,11 WATER5,6 DETAIL () BRWN CLAY 0003 BLUE CLAY 0007 BLDR CLAY MSND 0013 FSND 0024 BLUE CLAY 0030 BLUE CLAY MSND 0039 MSND SILT CLAY 0069 BLUE CLAY 0075 MSND SILT CLAY 0088 BLUE CLAY SILT 0123 BLUE CLAY MSND GRVL 0163 BLUE CLAY MSND BLDR 0164 BLUE CLAY MSND 0177 BLUE CLAY MSND GRVL 0181 BLDR CLAY MSND 0182 BLUE CLAY MSND 0185 BLUE CLAY GRVL 0208 BLUE SHLE SA / / 24:0 MN 02 FR / 006 / 3: FR / / 3:0 DO 02 FR / 006 / 3:30 DO 34 FR / / :0 04 FR 0036 / / 2:0 06 FR / 004 / : DO () BLCK LOAM 0002 BLCK MUCK SAND GRVL 0015 GREY GRVL BLDR 0020 GREY SAND GRVL CLAY 0028 GREY GRVL CLAY 0035 GREY CLAY SAND 0051 GREY CLAY SAND GRVL 0076 GREY CLAY 0096 GREY CLAY SILT 0104 GREY CLAY SILT FSND 0108 GREY SAND GRVL CLAY 0111 GREY SAND GRVL 0125 GREY SHLE () PRDG 0020 FSND 0022 BLUE CLAY 0040 GRVL () LOAM 0005 HPAN 0055 GRVL 0060 HPAN 0095 WHIT MSND 0210 SHLE () LOAM 0004 BRWN CLAY MSND 0013 BLUE CLAY STNS 0038 GRVL 0042 DO () LOAM 0001 YLLW CLAY 0010 BLUE CLAY 0030 BLUE CLAY MSND 0040 DO () PRDG 0013 BLUE CLAY 0032 BRWN CSND 0036 DO () GREY CLAY GRVL BLDR 0128 GREY GRNT () BRWN CLAY SAND 0018 GREY CLAY SAND 0065 GREY CLAY 0075 GREY CLAY SAND 0085 GREY CLAY 0160 GREY CLAY SAND 0170 GREY CLAY 0200 GREY CLAY SAND 0220 GREY SHLE FR / / 5:0 DO 07 FR 0208 FR / / 5:0 DO () BRWN CLAY 0040 BRWN CLAY MSND 0047 BRWN MSND 0070 GREY FSND 0185 GREY SHLE () LOAM 0001 BRWN CLAY 0010 HPAN BLDR 0063 BLUE CLAY GRVL 0110 BLUE CLAY 0159 MSND 0161 BLUE CLAY 0171 CLAY MSND 0185 BLUE CLAY 0208 FSND 0212 CSND GRVL 0213
56 TOWNSHIP CONCESSION (LOT) CON 05(015) CON 05(015) CON 05(015) 343 Well Computer Print Out Data as of November Page: 80 / UTM 1 DATE 2 CNTR / W / W / W 1413 CASING DIA 4 STAT LVL/PUMP LVL 7 RATE 8 /TIME HR:MIN WATER5,6 DETAIL 06 FR 033 / / 4:0 05 FR 0069 FR / / 2:30 DO 05 FR / / 3:0 DO WATER USE 9 DO SCREEN WELL # (AUDIT#) WELL TAG # INFO 10 DEPTHS TO WHICH FORMATIONS EXTEND 5, () FILL 0003 BRWN CLAY 0012 GREY CLAY GRVL 0083 GREY CLAY SAND 0111 FSND 0122 GREY CLAY SAND 0131 CSND 0141 GREY CLAY SAND () BRWN LOAM 0001 YLLW CLAY BLDR 0016 BLUE CLAY SAND 0047 BLUE CLAY 0069 GREY SAND GRVL 0098 BLUE CLAY GRVL 0110 GREY SAND GRVL () HPAN 0125 FSND 0132 CON 05(015) CON 05(016) CON 05(016) CON 05(016) CON 05(016) / W / W / W / W / W FR / 006 / :0 DO () FILL 0003 BRWN CLAY 0018 BLUE CLAY 0036 CLAY QSND 0050 HPAN 0072 CLAY 0091 MSND () BRWN CLAY 0020 GRVL CLAY BLDR 0024 BLUE CLAY 0060 BLUE CLAY MSND 0067 BLUE CLAY 0092 CLAY MSND 0095 HPAN 0119 BLUE SHLE FR 0018 / / :0 04 FR 0037 / / :0 DO 06 FR 0017 / / :0 DO DO () BLCK LOAM 0002 BRWN CLAY MSND 0009 BLUE CLAY 0018 GREY MSND 0020 BLUE CLAY STNS () BRWN CLAY 0004 MSND 0014 BLUE MSND 0020 FSND () PRDG 0009 BLUE CLAY 0017 CON 05(016) CON 05(016) CON 05(016) CON 05(016) / W / W / W / W FR / / 4:10 06 FR 0062 / / 1:0 06 FR 0118 / / 1:0 06 FR / / 3:0 DO DO DO (13698) BRWN CLAY STNS HARD 0006 BRWN SAND STNS LOOS 0014 GREY CLAY SLTY 0069 BRWN SAND GRVL CLN 0079 GREY CLAY DNSE (58314) BRWN CLAY 0007 BLUE CLAY SOFT 0016 BLUE CLAY GRVL 0019 BLUE CLAY SAND 0040 GREY SAND FSND 0054 GREY CLAY STNS 0062 GREY GRVL (91655) BRWN CLAY DNSE 0017 GREY CLAY DNSE 0037 GREY CLAY SILT LYRD 0078 BLCK SAND GRVL CGVL 0118 BLCK SHLE HARD () CLAY GRVL BLDR 0019 SAND 0031 CLAY GRVL SAND 0053 SAND SHLE 0061 CLAY 0076 SAND CLAY 0153 CLAY SILT 0183 SAND GRVL CLAY 0197 SAND 0204 GRVL SHLE 0209 BRWN SHLE 0210
57 TOWNSHIP CONCESSION (LOT) CON 05(016) CON 05(016) CON 05(016) CON 05(016) CON 05(016) CON 05(016) CON 05(016) CON 05(016) CON 05(016) CON 05(016) CON 05(016) CON 05(016) CON 05(016) 343 Well Computer Print Out Data as of November Page: 81 / UTM 1 DATE 2 CNTR / W / W / W / W / W / W / W / W / W / W W 1968/ / W W 1978/ CASING DIA 4 WATER5,6 DETAIL 04 FR 0065 / / :0 34 FR / / :0 STAT LVL/PUMP LVL 7 RATE 8 /TIME HR:MIN 07 FR / 070 / 1:0 06 FR / / 1:0 06 FR / / :0 06 FR 0189 FR / 004 / 2:0 WATER USE 9 SCREEN WELL # (AUDIT#) WELL TAG # INFO 10 DEPTHS TO WHICH FORMATIONS EXTEND 5,11 DO () BRWN CLAY 0020 HPAN CLAY STNS 0049 BLUE CLAY MSND 0065 FSND 0072 FSND CSND 0075 ST DO 06 FR / / :0 NU 06 FR / / :0 06 UK / / 2:0 07 FR / 016 / 2:0 06 FR / 010 / 2:0 06 FR / / : () LOAM 0001 YLLW CLAY MSND 0010 BLUE CLAY 0030 GRVL 0032 IR (Z19436) A BLCK LOAM 0001 BRWN CLAY SAND 0018 BRWN MSND 0032 BLUE CLAY GRVL LYRD 0093 GREY SAND CLAY DRTY 0097 GREY MSND FSND 0123 BLUE CLAY FSND LYRD 0128 DO () LOAM 0002 BRWN CLAY 0018 BLUE CLAY 0060 BLUE CLAY SAND 0069 BLUE CSND 0075 NU (206290) BRWN CLAY SNDY 0000 YLLW UNKN 0007 BRWN CLAY SNDY GRVL 0021 YLLW UNKN 0063 DO DO MN NU DO () PRDG 0015 BLUE CLAY STNS 0031 BLUE CLAY SOFT 0038 BLUE SAND () CLAY SAND STNS 0025 SAND GRVL BLDR 0050 GRVL SAND CLAY 0065 SAND CLAY SILT 0189 MSND 0206 CLAY SAND STNS 0211 BRWN SHLE () LOAM 0001 BRWN CLAY 0015 BLUE CLAY 0030 GRVL MSND 0032 CLAY MSND 0066 MSND CLAY 0075 MSND 0077 BLUE CLAY 0094 MSND GRVL 0098 CLAY MSND 0103 MSND 0108 MSND SILT () BRWN CLAY 0019 BLUE CLAY STNS 0038 BLUE CLAY SAND SOFT 0046 BLUE SAND CLAY SOFT 0050 BLUE SAND () SAND CLAY LYRD 0009 CLAY HARD 0015 SAND SILT CMTD 0033 FSND MSND SILT 0043 CLAY GRVL STNS () LOAM 0008 CLAY MSND GRVL 0011 CLAY GRVL 0020 BLUE CLAY 0052 CLAY MSND GRVL 0056 CLAY MSND 0087 MSND GRVL () SAND CLAY STNS 0062 CLAY HARD 0090 CLAY SOFT 0142 CLAY SAND LYRD () PRDG 0197
58 TOWNSHIP CONCESSION (LOT) CON 05(016) CON 05(016) CON 05(016) CON 05(016) CON 05(016) CON 05(016) CON 05(017) CON 05(017) CON 05(017) CON 05(017) CON 05(017) 343 Well Computer Print Out Data as of November Page: 82 / UTM 1 DATE 2 CNTR / W / W / W / W / W / W / W / W / W / W / W 2204 CASING DIA 4 STAT LVL/PUMP LVL 7 RATE 8 /TIME HR:MIN WATER5,6 DETAIL 06 FR 0070 / / 2: / / :0 DO 06 FR / / 2:30 06 FR / / 1:0 07 FR / / 9:0 WATER USE 9 DO DO ST SCREEN WELL # (AUDIT#) WELL TAG # INFO 10 DEPTHS TO WHICH FORMATIONS EXTEND 5, DO IR () LOAM 0002 BLUE CLAY 0020 BLUE CLAY SILT 0058 FSND 0068 CSND () BRWN CLAY 0008 BLUE CLAY 0015 BLUE CLAY () BRWN CLAY SAND PCKD 0016 BLUE CLAY DNSE 0079 GREY SAND SILT CLAY 0122 GREY SAND CLN () BRWN CLAY STNS 0014 BLUE CLAY 0030 BLUE CLAY SAND 0035 BLUE CLAY 0058 BLUE CLAY SOFT 0064 BLUE SAND CLAY 0067 BLUE GRVL () BRWN CLAY 0010 CLAY MSND STNS 0020 MSND CLAY 0030 BLUE CLAY 0051 CLAY GRVL 0055 CLAY MSND GRVL 0087 MSND GRVL 0097 MSND GRVL CLAY 0102 CLAY MSND GRVL 0160 BLUE SHLE 0194 UK 0044 NU () LOAM 0001 BRWN CLAY 0020 BLUE CLAY 0044 MSND 0048 MSND 0084 BLUE CLAY MSND FR / / 2:0 DO (01193) BRWN CLAY SAND 0009 GREY CLAY STNS 0023 GREY CLAY SILT 0044 GREY CLAY STNS 0053 GREY SAND STNS SILT 0058 GREY CLAY SAND STNS 0097 GREY SILT SAND 0107 GREY CLAY STNS 0111 GREY SAND STNS () LOAM 0004 CLAY GRVL BLDR 0009 MSND 0017 BLUE CLAY 0033 MSND SILT 0040 CLAY BLDR 0043 SILT FSND 0053 MSND GRVL 0064 CLAY GRVL 0069 CLAY GRVL BLDR 0070 CLAY GRVL SHLE FR 0046 NU () CLAY 0002 MSND GRVL BLDR 0006 MSND BLDR 0022 BLUE CLAY 0030 CLAY MSND 0044 GRVL CLAY 0046 FSND CLAY 0052 FSND 0058 CLAY 0064 BLUE CLAY GRVL FR FR / 020 / :0 DO NU () BRWN CLAY 0007 CLAY BLDR 0010 CLAY 0034 CLAY GRVL 0039 CLAY MSND 0059 MSND 0062 MSND CLAY 0064 CLAY 0066 CLAY GRVL () BLCK LOAM 0002 GRVL 0004 BLUE CLAY 0064 CSND 0065
59 TOWNSHIP CONCESSION (LOT) CON 05(017) CON 05(017) CON 05(017) CON 05(017) CON 05(017) CON 05(018) CON 05(018) CON 05(018) CON 05(018) CON 05(018) CON 05(018) CON 05(018) CON 05(018) 343 Well Computer Print Out Data as of November Page: 83 / UTM 1 DATE 2 CNTR / W / W / W / W / W / W / L / W / W / W / W W 1963/ / W 3108 CASING DIA 4 WATER5,6 DETAIL STAT LVL/PUMP LVL 7 RATE 8 /TIME HR:MIN WATER USE 9 SCREEN WELL # (AUDIT#) WELL TAG # INFO 10 DEPTHS TO WHICH FORMATIONS EXTEND 5, () CLAY GRVL BLDR 0012 BLUE CLAY 0078 FSND CLAY 0113 BLUE CLAY FR 0072 NU () BRWN CLAY 0015 BLUE CLAY 0030 CLAY MSND 0063 MSND CLAY 0076 CLAY 0115 SHLE CLAY FR / / 2:0 34 FR / / :0 07 FR / / 5:0 06 FR / / 1:0 06 FR / / 1:0 04 FR / / 13:0 DO () BRWN CLAY 0015 BLUE CLAY 0035 GREY SAND 0080 DO () LOAM 0001 YLLW CLAY 0009 BLUE CLAY GRVL STNS 0015 MSND CLAY 0021 NU DO DO DO () LOAM 0002 BRWN CLAY 0014 CLAY GRVL 0052 MSND GRVL 0062 MSND FSND 0070 CLAY (213471) BLUE LOAM 0001 BRWN GRVL SAND 0009 BLUE CLAY SLTY SILT 0041 BLUE CLAY 0064 GREY SAND 0066 BLUE CLAY SAND 0129 GREY MSND 0137 GREY FSND (166608) BRWN CLAY HARD 0017 GREY CLAY HARD 0109 GREY CGVL () LOAM 0002 CSND 0035 FSND 0068 GREY CLAY 0105 MSND CLAY () LOAM 0002 BRWN CLAY BLDR 0024 BLUE CLAY 0029 MSND BLDR 0032 CLAY MSND 0078 CLAY GRVL FR / / 3:0 02 FR 0050 / / 8:0 NU 04 FR / / 8:0 04 FR / / 2:30 DO DO DO () BRWN CLAY STNS DNSE 0017 GREY CLAY SILT LYRD 0034 GREY CLAY STNS HARD 0097 GREY CLAY SILT LYRD 0129 GREY CLAY SAND LOOS () LOAM 0001 BLDR CLAY 0003 CLAY GRVL BLDR 0012 CLAY GRVL 0050 SILT FSND 0052 MSND GRVL 0053 CLAY 0056 SILT 0059 CLAY 0070 CLAY GRVL 0073 SILT CLAY 0087 CLAY GRVL BLDR 0092 CLAY 0187 SHLE () LOAM 0001 MSND GRVL 0080 BLUE CLAY 0107 MSND () LOAM 0001 BRWN CLAY STNS 0012 BLUE CLAY STNS 0025 BLUE CLAY MSND 0052 BLUE CLAY 0120 BLUE CLAY STNS 0139 MSND 0144
60 TOWNSHIP CONCESSION (LOT) CON 05(018) CON 05(018) CON 05(018) CON 05(018) CON 05(018) CON 05(018) CON 05(018) CON 05(018) CON 05(018) CON 05(018) CON 05(018) 343 Well Computer Print Out Data as of November Page: 84 / UTM 1 DATE 2 CNTR / L / W / L L 2000/ / W / W / W / W / W / W / W 4610 CASING DIA 4 STAT LVL/PUMP LVL 7 RATE 8 /TIME HR:MIN WATER5,6 DETAIL 04 FR / / 4:0 06 FR / / 3:0 DO 06 FR / / 1:0 WATER USE 9 DO SCREEN WELL # (AUDIT#) WELL TAG # INFO 10 DEPTHS TO WHICH FORMATIONS EXTEND 5, FR / / 1:0 02 FR / 003 / 8:0 34 FR / 004 / :0 34 FR / 002 / :0 05 FR / / 7:0 06 FR 0049 FR 0070 / / 24:0 IR 07 FR / / 6:0 IR DO DO () LOAM 0001 YLLW CLAY 0052 BLUE CLAY 0126 MSND 0135 CLAY MSND 0142 MSND 0149 BLUE MSND CLAY 0154 MSND () LOAM 0002 BRWN CLAY 0019 BLUE CLAY 0040 BLUE CLAY GRVL 0080 BLUE CLAY 0114 BLUE CSND (221537) BRWN CLAY SOFT 0018 GREY CLAY 0032 GREY CLAY SNDY 0070 GREY CLAY SAND SOFT 0081 GREY CLAY SNDY 0084 GREY MSND 0088 GREY CLAY SNDY 0090 GREY MSND 0094 GREY MSND (221536) BLCK LOAM 0001 BRWN CLAY 0013 GREY CLAY STNS SOFT 0028 GREY CLAY SAND 0070 GREY CLAY SAND SOFT 0079 GREY CSND 0081 GREY CLAY SILT 0083 GREY MSND 0094 GREY FSND 0099 GREY CLAY GRVL 0102 GREY CLAY GRVL 0126 GREY SAND CLAY SOFT 0134 GREY CLAY STNS (166603) BRWN CLAY HARD 0017 GREY CLAY STNS HARD 0050 GREY CLAY DNSE 0105 GREY CSND 0110 GREY CGVL () CLAY 0041 CLAY MSND 0052 BLUE CLAY 0078 MSND 0089 QSND 0093 WHIT CLAY 0103 MSND 0108 DO () LOAM 0001 YLLW CLAY 0010 MSND GRVL 0014 BLUE CLAY 0034 DO () LOAM 0001 YLLW CLAY 0010 BLUE CLAY 0025 MSND 0026 BLUE CLAY 0046 DO () PRDG 0047 CLAY GRVL 0060 BLUE CLAY 0120 CLAY MSND 0141 MSND () LOAM 0002 BRWN CLAY STNS 0024 BLUE CLAY SILT 0033 MSND SILT GRVL 0049 CLAY MSND SILT 0070 CSND FSND CLAY 0076 FSND SILT 0080 FSND CSND CLAY 0085 FSND SILT CLAY () CLAY MSND 0020 BLUE CLAY 0028 FSND CLAY 0072 CSND 0082 MSND CLAY 0086 HPAN 0096
61 TOWNSHIP CONCESSION (LOT) CON 05(018) CON 05(018) CON 05(018) CON 05(018) CON 05(018) CON 05(018) CON 05(018) CON 05(018) CON 05(018) CON 05(019) 343 Well Computer Print Out Data as of November Page: 85 / UTM 1 DATE 2 CNTR / W / W W 1970/ / W / W / W / W / W / W / W 3108 CASING DIA 4 STAT LVL/PUMP LVL 7 RATE 8 /TIME HR:MIN WATER5,6 DETAIL 06 FR / / : FR / / 5:0 05 FR / / 2:50 05 FR / / 6:0 WATER USE 9 DO DO DO DO SCREEN WELL # (AUDIT#) WELL TAG # INFO 10 DEPTHS TO WHICH FORMATIONS EXTEND 5, () BLCK LOAM 0002 BRWN CLAY SOFT 0019 BLUE CLAY SOFT 0031 BLUE CLAY STNS 0079 BLUE CLAY SOFT 0113 BLUE SAND () BRWN CLAY SAND LYRD 0011 GREY CLAY STNS HARD 0031 GREY CLAY DNSE 0060 GREY CLAY STNS HARD 0116 BRWN CLAY SAND LYRD 0119 GREY CLAY DNSE 0129 BRWN CLAY SAND LYRD 0134 GREY CLAY DNSE 0144 GREY CLAY STNS HARD 0185 GREY CLAY SHLE HARD 0196 GREY SHLE DNSE () BLCK LOAM 0002 BLUE CLAY STNS 0100 SILT 0111 GREY CLAY 0142 GRVL 0150 MSND () BRWN CLAY STNS 0008 GRVL CLAY 0010 BRWN CLAY BLDR 0045 BLUE CLAY 0140 GRVL SILT CLAY 0155 GREY MSND FR () LOAM 0002 GRVL 0006 CLAY 0025 CLAY SILT 0029 CLAY 0069 SILT 0073 CLAY SILT 0080 CLAY 0092 GRVL MSND 0096 SILT 0108 SILT FSND 0119 CLAY 0178 CLAY BLDR 0192 SHLE FR / / 6:0 06 FR 0105 FR / / 48:0 05 FR / / 3:0 DO DO DO () LOAM 0002 CLAY STNS 0050 HPAN 0110 WHIT CLAY 0125 BLCK CSND () LOAM 0006 GRVL 0033 HPAN 0044 CLAY 0049 CLAY GRVL 0064 SILT CLAY 0105 MSND SILT 0112 SILT 0134 MSND () LOAM 0001 BLDR CLAY 0035 CLAY MSND STNS 0148 MSND () LOAM 0001 CLAY 0018 CLAY GRVL 0025 SILT 0030 CLAY 0091 CLAY BLDR 0150 SHLE (166663) CON 05(019) CON 05(019) / W / W FR / / 10:0 05 FR / / 3:0 DO DO () PRDG 0005 BRWN CLAY STNS 0040 BLUE CLAY 0100 HPAN 0115 BLUE CLAY 0121 MSND GRVL () CLAY BLDR 0060 BLUE CLAY MSND 0098 GRVL MSND 0100
62 TOWNSHIP CONCESSION (LOT) CON 05(019) CON 05(019) CON 05(019) CON 05(019) CON 05(019) CON 05(019) 343 Well Computer Print Out Data as of November Page: 86 / UTM 1 DATE 2 CNTR / W / W / W / L / L / W 3108 CASING DIA 4 STAT LVL/PUMP LVL 7 RATE 8 /TIME HR:MIN WATER5,6 DETAIL 06 FR / / 72:0 DO 05 FR / / 8:0 34 FR 0030 / / :0 06 FR / / 1:0 06 FR / / 1:30 WATER USE 9 DO SCREEN WELL # (AUDIT#) WELL TAG # INFO 10 DEPTHS TO WHICH FORMATIONS EXTEND 5, () LOAM 0001 BRWN CLAY MSND 0020 GREY CLAY MSND STNS 0115 GRVL MSND CLAY () PRDG 0023 BLUE CLAY STNS 0038 BLUE CLAY 0110 BLUE CLAY BLDR 0120 MSND SILT GRVL 0130 DO () LOAM 0001 BRWN CLAY 0011 BLUE CLAY BLDR 0034 DO DO (141542) BLCK LOAM 0002 BRWN CLAY STNS 0018 GREY CLAY STNS 0065 GREY CLAY SLTY 0115 GREY SAND GRVL CLAY 0127 GREY CLAY STNS 0148 GREY SAND MUCK 0156 GREY CLAY STNS (211663) BLCK LOAM 0002 BRWN CLAY SAND STNS 0014 GREY CLAY SNDY 0058 GREY CLAY SAND SILT 0071 GREY MSND 0075 GREY CLAY SNDY (166662) CLAY 0010 FILL CLAY CMTD 0010 CON 05(019) CON 05(019) CON 05(019) CON 05(019) CON 05(019) CON 05(019) CON 05(019) / W / W / W W 1977/ / W W 1969/ / W FR / / 3:0 06 FR 028 / / 4:0 06 FR / / 5:0 30 FR / / :0 06 UK / / 3:0 DO 06 FR 0059 / / 11:0 FR 0109 FR / / 6:0 DO DO DO () BRWN CLAY 0020 BLUE CLAY STNS 0080 GREY SAND CLAY 0105 GREY SAND () LOAM 0002 BRWN CLAY GRVL 0008 GREY CLAY GRVL 0104 SAND 0114 SAND CLAY () BLUE CLAY STNS MSND 0035 BLUE CLAY STNS 0118 MSND GRVL 0125 DO () LOAM 0002 BRWN CLAY STNY 0025 BLUE CLAY STNY 0043 SAND 0045 BLUE CLAY STNY DO () BRWN CLAY 0012 BRWN GRVL SAND 0027 BLUE CLAY STNS 0121 BLUE FSND 0124 BLUE CLAY 0145 BLUE CSND () BRWN CLAY 0004 BRWN CLAY MSND GRVL 0007 BLUE CLAY MSND 0024 BLUE CLAY 0057 GREY MSND SILT 0059 GREY MSND GRVL 0063 NU () BRWN CLAY 0008 YLLW CLAY MSND 0024 HPAN 0042 BLUE CLAY 0109 BLUE CLAY SILT 0113 BLUE CLAY 0145 GREY FSND SILT 0153 BLUE CLAY SILT 0167 SHLE 0180
63 TOWNSHIP CONCESSION (LOT) CON 05(019) CON 05(019) CON 05(019) 343 Well Computer Print Out Data as of November Page: 87 / UTM 1 DATE 2 CNTR / W / W / W 2527 CASING DIA 4 STAT LVL/PUMP LVL 7 RATE 8 /TIME HR:MIN WATER5,6 DETAIL 30 FR / 002 / :0 34 FR / 004 / :0 WATER USE 9 SCREEN WELL # (AUDIT#) WELL TAG # INFO 10 DEPTHS TO WHICH FORMATIONS EXTEND 5,11 ST () YLLW CLAY 0007 BLUE CLAY 0012 GRVL STNS 0015 BLUE CLAY STNS 0027 DO () YLLW CLAY MSND 0006 YLLW CLAY 0012 BLUE CLAY () PRDG 0004 BRWN CLAY STNS 0027 CON 05(019) CON 05(019) CON 05(019) CON 05(019) CON 05(019) CON 05(019) CON 05(019) CON 05(019) CON 05(019) CON 05(019) CON 05(019) CON 05(019) / W / W / W / W / W / W / W / W W 1966/ / W W 1966/ / W FR / / 8:0 04 FR / / 8:0 34 FR / / :0 05 FR / / 4:0 05 FR / / 24:0 34 FR / / :0 05 FR / / 5:0 05 FR / / 4:0 05 FR / / 15:0 05 FR / / 4:0 04 FR / / 8:0 05 FR / / 5:0 DO () PRDG 0005 BLUE CLAY BLDR 0030 BLUE CLAY 0115 CSND 0155 FSND 0160 DO () CLAY MSND STNS 0001 GREY CLAY BLDR 0047 GRVL 0048 DO () LOAM 0001 YLLW CLAY 0009 BLUE CLAY MSND 0036 DO DO () PRDG 0034 BRWN CLAY MSND 0045 BRWN CLAY BLDR 0070 BLUE CLAY MSND 0110 GREY MSND 0135 BLUE CLAY MSND 0166 GREY MSND () CLAY STNS MSND 0050 BLUE CLAY 0105 GRVL CLAY 0118 CSND 0122 DO () LOAM 0001 YLLW CLAY 0012 BLUE CLAY STNS 0035 CLAY MSND STNS 0040 DO DO DO DO DO DO () PRDG 0035 BLUE CLAY 0105 MSND CSND 0107 CLAY () CLAY BLDR 0055 CLAY MSND STNS 0092 GRVL MSND () CLAY BLDR 0045 CLAY STNS 0102 MSND () LOAM 0002 YLLW CLAY MSND 0008 BRWN CLAY BLDR 0045 BLUE CLAY BLDR 0115 GREY FSND () LOAM 0002 CSND STNS 0020 GREY CLAY 0100 GRVL CLAY 0102 FSND CLAY 0103 CSND () BRWN MSND 0006 BLDR CLAY 0022 CLAY MSND 0040 BLUE CLAY 0102 GREY MSND 0105
64 TOWNSHIP CONCESSION (LOT) CON 05(019) CON 05(019) 343 Well Computer Print Out Data as of November Page: 88 / UTM 1 DATE 2 CNTR / W / W 5420 CASING DIA 4 STAT LVL/PUMP LVL 7 RATE 8 /TIME HR:MIN WATER5,6 DETAIL 05 FR / / 20:0 05 FR / / 10:0 WATER USE 9 DO DO SCREEN WELL # (AUDIT#) WELL TAG # INFO 10 DEPTHS TO WHICH FORMATIONS EXTEND 5, () BRWN CLAY 0007 YLLW CLAY STNS 0028 BRWN CLAY STNS 0040 BLUE CLAY 0106 MSND CLAY 0111 GREY MSND () PRDG 0046 CLAY 0106 MSND 0112 CON 05(019) CON 05(020) CON 05(020) CON 05(020) CON 05(020) CON 05(020) CON 05(020) / W / W / W / L / W / W W 1982/ UK / / 4:0 06 FR / / 2:0 DO 06 FR 0158 / / 3:0 06 FR / / 2:0 06 FR / / :0 06 FR / / 10:0 DO DO DO DO (166661) () BLCK CLAY MSND STNS 0006 YLLW CLAY STNS 0021 BLUE CLAY STNS 0065 STNS MSND 0067 BLUE CLAY SILT STNS 0115 GREY MSND GRVL () BRWN CLAY 0005 BLUE CLAY STNS 0093 BLUE CLAY SILT 0111 GREY SAND STNS SILT 0137 BLUE CLAY SILT 0184 GREY SAND SILT 0205 WHIT CLAY STNS 0209 GREY SAND STNS CLN (85054) BRWN CLAY SNDY 0014 GREY CLAY SAND STNS 0067 GREY CLAY SILT 0113 GREY SAND STNS 0119 GREY CLAY SILT 0147 GREY CLAY SAND STNS 0158 GREY SAND FSND 0164 GREY CLAY SAND STNS 0168 GREY CLAY SILT () BRWN CLAY 0018 BLUE CLAY SAND STNS 0122 SAND 0127 SAND () BRWN CLAY 0016 BLUE CLAY STNS 0114 BLUE CLAY FSND 0125 BLUE MSND 0134 DO () BLUE HPAN STNS SAND 0051 CON 05(020) CON 05(020) CON 05(020) CON 05(020) CON 05(020) / W / W W 1979/ / W / W FR / / :0 06 FR / / 4:0 06 FR / / 2:0 06 FR / / 5:0 06 FR / / 2:30 DO () LOAM 0002 BRWN CLAY STNY 0016 SAND GRVL 0036 DO () CLAY SAND 0020 CLAY STNS 0028 GRVL 0035 BLUE CLAY 0070 CLAY 0077 DO () GREY CLAY 0018 GREY SILT CLAY STNS 0065 GREY GRVL HPAN 0080 DO DO () PRDG 0036 BLUE CLAY MSND 0077 BLUE CLAY 0093 BLUE MSND 0097 BLUE CLAY GRVL MSND () BRWN CLAY 0022 BLUE CLAY 0154 FSND 0163
65 TOWNSHIP CONCESSION (LOT) CON 06(014) CON 06(014) CON 06(014) CON 06(014) CON 06(014) CON 06(014) CON 06(014) CON 06(014) CON 06(014) CON 06(015) CON 06(015) 343 Well Computer Print Out Data as of November Page: 118 / UTM 1 DATE 2 CNTR / W / W / W / W / W W 1979/ / W / W W 1960/ / L / W 3903 CASING DIA 4 WATER5,6 DETAIL 01 FR 0050 FR 0043 STAT LVL/PUMP LVL 7 RATE 8 /TIME HR:MIN 006 / / 6:0 06 FR 0025 / / :0 NU 05 FR / / 12:0 DO 30 FR / 019 / :0 DO 04 FR / / 5:0 06 FR / / 4:30 05 FR 0032 FR FR / / 48:0 02 FR 0024 FR 0193 WATER USE 9 NU ST DO -004 / / 4:0 NU / / 10: FR 0112 / / 70: / / :0 SCREEN WELL # (AUDIT#) WELL TAG # INFO 10 DEPTHS TO WHICH FORMATIONS EXTEND 5, DO NU IR CO () LOAM 0002 BRWN CLAY 0012 BLUE CLAY STNS 0042 MSND 0043 BLUE CLAY 0050 FSND 0100 MSND CLAY SILT 0110 FSND 0128 GRVL 0137 CLAY GRVL 0139 CLAY 0145 CLAY STNS 0205 SHLE () LOAM 0002 BLUE CLAY STNS 0025 FSND CLAY 0087 CLAY STNS 0175 CLAY BLDR 0177 CLAY STNS 0198 SHLE () PRDG 0030 BRWN MSND 0065 CLAY STNS MSND 0100 CLAY MSND () BRWN CLAY 0011 GREY CLAY 0021 GRVL () BRWN CLAY 0018 GRVL BLDR 0050 GRVL CLAY 0180 CSND () BRWN LOAM 0001 BRWN SAND CLAY 0048 GRVL CLAY HARD 0096 CLAY 0108 GREY SAND () LOAM 0002 BLUE CLAY 0005 GRVL 0006 BLUE CLAY 0032 MSND STNS 0050 MSND 0054 MSND STNS 0060 MSND CLAY 0061 FSND 0070 MSND CLAY 0074 GRVL HPAN () LOAM 0001 BRWN CLAY 0002 BLUE CLAY 0047 MSND 0117 GRVL BLDR 0131 CLAY STNS 0175 GRVL CLAY 0177 CLAY MSND STNS 0201 SHLE () LOAM 0002 BLUE CLAY 0018 BLUE CLAY STNS 0024 GRVL CLAY 0036 CLAY STNS MSND 0040 CLAY BLDR 0043 BLUE CLAY 0100 GRVL CLAY 0137 BLDR 0139 GRVL CLAY 0170 GRVL CLAY BLDR 0193 GRVL CLAY 0206 CLAY STNS 0214 SHLE (227712) BRWN CLAY STNS HARD 0026 GREY CLAY SILT LYRD 0070 BRWN SAND CLAY LYRD 0112 DO (26721) PRDG 0034 CON 06(016) / W 1663 NU (253165)
66 TOWNSHIP CONCESSION (LOT) CON 06(016) CON 06(016) 343 Well Computer Print Out Data as of November Page: 119 / UTM 1 DATE 2 CNTR / W / W 3903 CASING DIA 4 STAT LVL/PUMP LVL 7 RATE 8 /TIME HR:MIN WATER5,6 DETAIL 06 FR / / 2:0 WATER USE 9 DO SCREEN WELL # (AUDIT#) WELL TAG # INFO 10 DEPTHS TO WHICH FORMATIONS EXTEND 5,11 NU (165712) () BRWN CLAY STNS 0039 BRWN SAND SILT 0059 GREY SAND STNS 0078 BLUE CLAY STNS 0092 BLUE CLAY SILT 0108 GREY SAND STNS 0127 CON 06(016) CON 06(016) / W W (186409) NU (Z05066) A CON 06(016) / W FR / / 4:0 DO ST () LOAM 0002 CLAY MSND 0055 MSND 0062 CON 06(016) / W FR / / :0 DO () GREY CLAY 0038 MSND 0043 CON 06(016) CON 06(016) CON 06(016) CON 06(016) CON 06(016) CON 06(016) CON 06(016) CON 06(016) CON 06(016) / W / W / W / W / W W 1997/ / W / W / W FR / / :0 34 FR / 002 / :0 DO 34 FR / / :0 05 FR / / 2:0 34 FR / / :0 DO DO () LOAM 0001 YLLW CLAY 0008 BLUE CLAY 0014 CLAY MSND () LOAM 0001 CLAY SILT 0012 FSND 0035 DO () LOAM 0001 BRWN CLAY 0010 BLUE CLAY 0025 BLDR CLAY 0029 DO FR FR 0064 / / 12:0 ST NU (165713) () LOAM 0001 FILL 0009 BRWN MSND 0021 BLUE CLAY 0082 BLUE MSND () LOAM 0001 BRWN CLAY 0012 BLUE CLAY STNS 0023 BLUE CLAY MSND BLDR (174629) BRWN SILT CLAY SAND 0013 BRWN CLAY FSND DNSE () LOAM 0001 BRWN MSND 0024 BLUE CLAY MSND 0064 BLUE MSND (186408) CON 06(016) / W FR / / 1:0 DO ST (Z19210) A BRWN CLAY STNS HARD 0050 BRWN SAND PCKD 0097 GREY SAND MSND 0125 GREY CLAY STNS HARD 0164 GREY SHLE SOFT 0198
67 TOWNSHIP CONCESSION (LOT) CON 06(016) CON 06(016) 343 Well Computer Print Out Data as of November Page: 120 / UTM 1 DATE 2 CNTR / W / W 1413 CASING DIA 4 STAT LVL/PUMP LVL 7 RATE 8 /TIME HR:MIN WATER5,6 DETAIL 06 FR / / 1:0 05 FR / / 2:0 DO ST ST DO WATER USE 9 SCREEN WELL # (AUDIT#) WELL TAG # INFO 10 DEPTHS TO WHICH FORMATIONS EXTEND 5, (Z19211) A BRWN CLAY STNS HARD 0040 GREY CLAY STNS HARD 0075 BRWN SAND LOOS 0137 GREY CLAY SILT GRVL 0177 GREY SHLE HARD () CLAY STNS 0020 FSND 0046 CON 06(016) / W FR / 002 / :0 ST () YLLW CLAY 0006 MSND 0032 CON 06(016) CON 06(016) CON 06(016) CON 06(018) CON 06(018) CON 06(018) CON 06(018) / W / W / W / W / L / W / W FR / / 2:0 DO () CLAY 0008 MSND SILT 0058 GREY CSND 0063 HPAN 0103 GREY MSND () PRDG 0030 BLUE CLAY STNS 0075 BLUE FSND 0164 BLUE FSND CLAY FR / 020 / 1:0 DO (78254) BRWN CLAY STNS 0027 GREY CLAY STNS 0075 GREY SAND VERY FSND 0090 GREY SAND MSND (186425) (213180) (186427) (186426) CON 06(018) CON 06(018) CON 06(018) / W / W / W FR / / 8:0 06 FR 0041 / / 3:0 DO () LOAM 0001 BRWN CLAY STNS 0030 GREY CLAY STNS 0060 GREY CLAY GRVL 0064 DO () LOAM 0001 BRWN CLAY STNS 0012 GREY CLAY 0041 BRWN GRVL 0042 NU (213428) CON 06(018) W 1997/ (186424) CON 06(018) CON 06(018) W 1962/ / W FR / / :0 DO 34 FR / / :0 DO () LOAM 0001 YLLW CLAY 0014 BLUE CLAY STNS 0048 CSND () LOAM 0001 YLLW CLAY 0017 CLAY MSND 0028 CSND 0042
68 TOWNSHIP CONCESSION (LOT) CON 06(018) CON 06(018) CON 06(018) CON 06(019) CON 06(019) 343 Well Computer Print Out Data as of November Page: 121 / UTM 1 DATE 2 CNTR / W / W / W / W / L 1663 CASING DIA 4 STAT LVL/PUMP LVL 7 RATE 8 /TIME HR:MIN WATER5,6 DETAIL 06 FR 0045 / / 2:0 DO 34 FR 0020 / 010 / :0 30 FR / / 12:0 DO 30 FR / / 8:0 DO WATER USE 9 SCREEN WELL # (AUDIT#) WELL TAG # INFO 10 DEPTHS TO WHICH FORMATIONS EXTEND 5, () LOAM 0001 BRWN CLAY 0009 BRWN GRVL MSND 0024 GREY CLAY STNS 0034 BRWN FSND 0040 BRWN FSND STNS 0045 BRWN FSND 0049 DO () LOAM 0001 BRWN CLAY 0008 BLUE CLAY 0020 FSND 0024 NU (227400) () LOAM 0001 BRWN CLAY SLTY 0011 BLUE CLAY STNY () LOAM 0002 BRWN CLAY SLTY 0016 BLUE CLAY SLTY 0027 CSND 0030 CON 06(019) CON 06(020) CON 06(020) CON 06(020) CON 06(020) CON 06(020) CON 06(020) CON 06(020) CON 06(020) CON 06(020) / W / W / W / W / W / W / W / W / W / L FR / 020 / 2:0 34 FR 0030 FR / / :0 06 UK / / 0:30 DO DO ST DO () BRWN CLAY SAND 0017 GREN CLAY SAND GRVL 0111 GREN MSND () LOAM 0001 YLLW CLAY 0012 BLUE CLAY STNS 0050 MSND CLAY () YLLW CLAY 0015 CLAY GRVL 0061 BLUE CLAY SNDY 0081 BLUE CLAY GVLY 0108 BLUE SAND NU () BRWN SILT HPAN 0003 GREY SILT CLAY HPAN 0022 GREY SILT SAND STNS 0076 GREY SILT CLAY 0100 GREY FSND STNS 0187 GREY SAND SILT 0205 GREY SHLE FR / / :0 ST DO NU (190437) () LOAM 0001 YLLW CLAY STNS 0012 CLAY MSND 0020 GRVL 0029 NU (198163) BRWN SAND CLAY 0000 YLLW SAND 0008 BRWN SAND CLAY 0009 YLLW SAND 0050 NU (240051) NU (240050) 36 NU (264104)
69 Appendix B Borehole and Monitoring Well Logs Appendix B
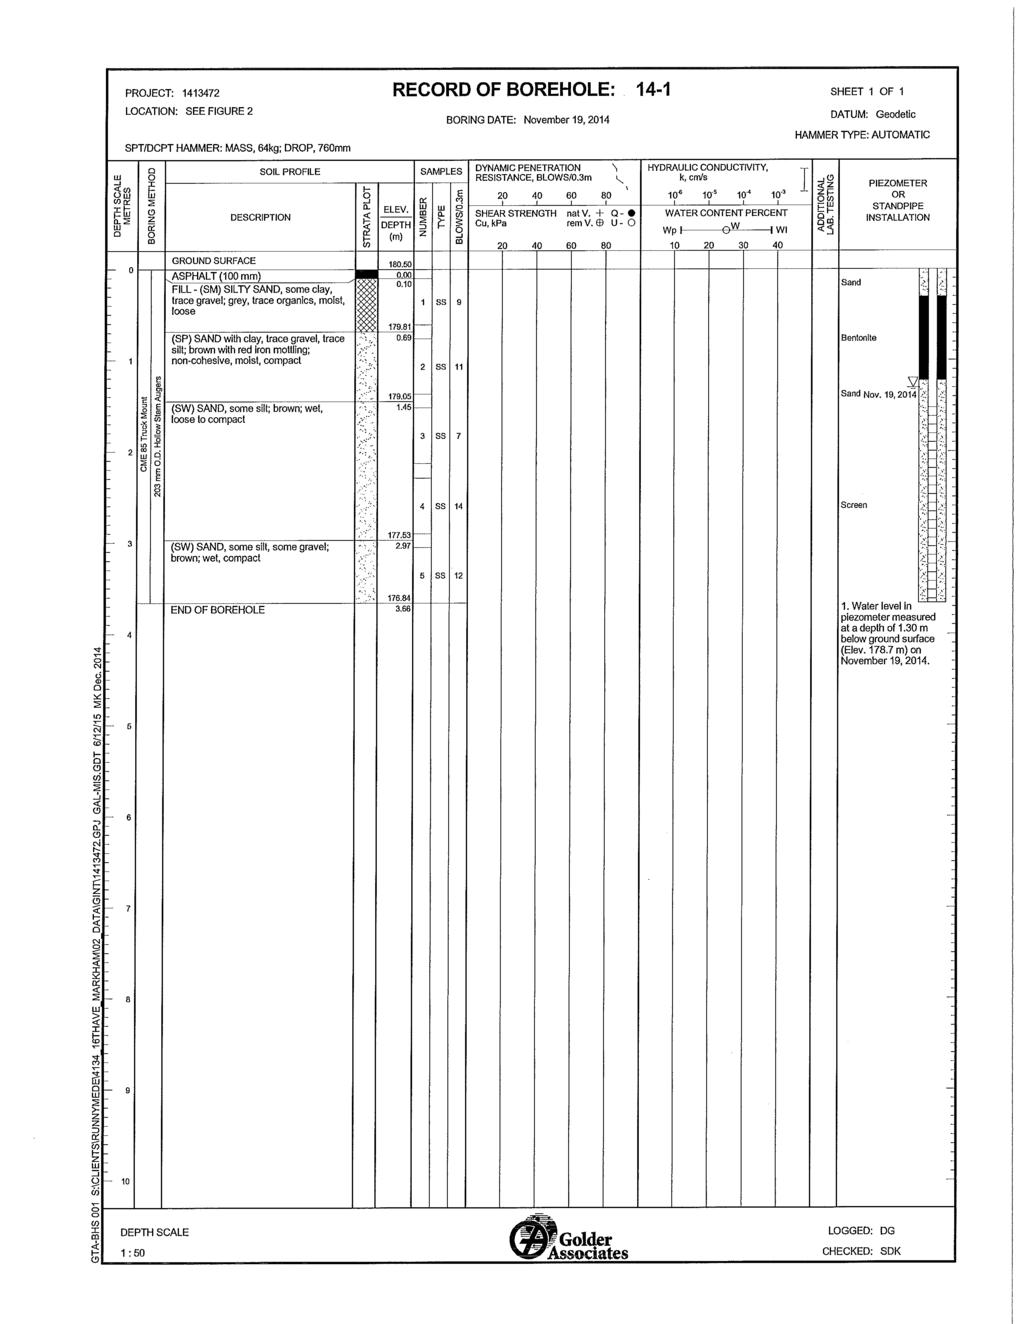
70
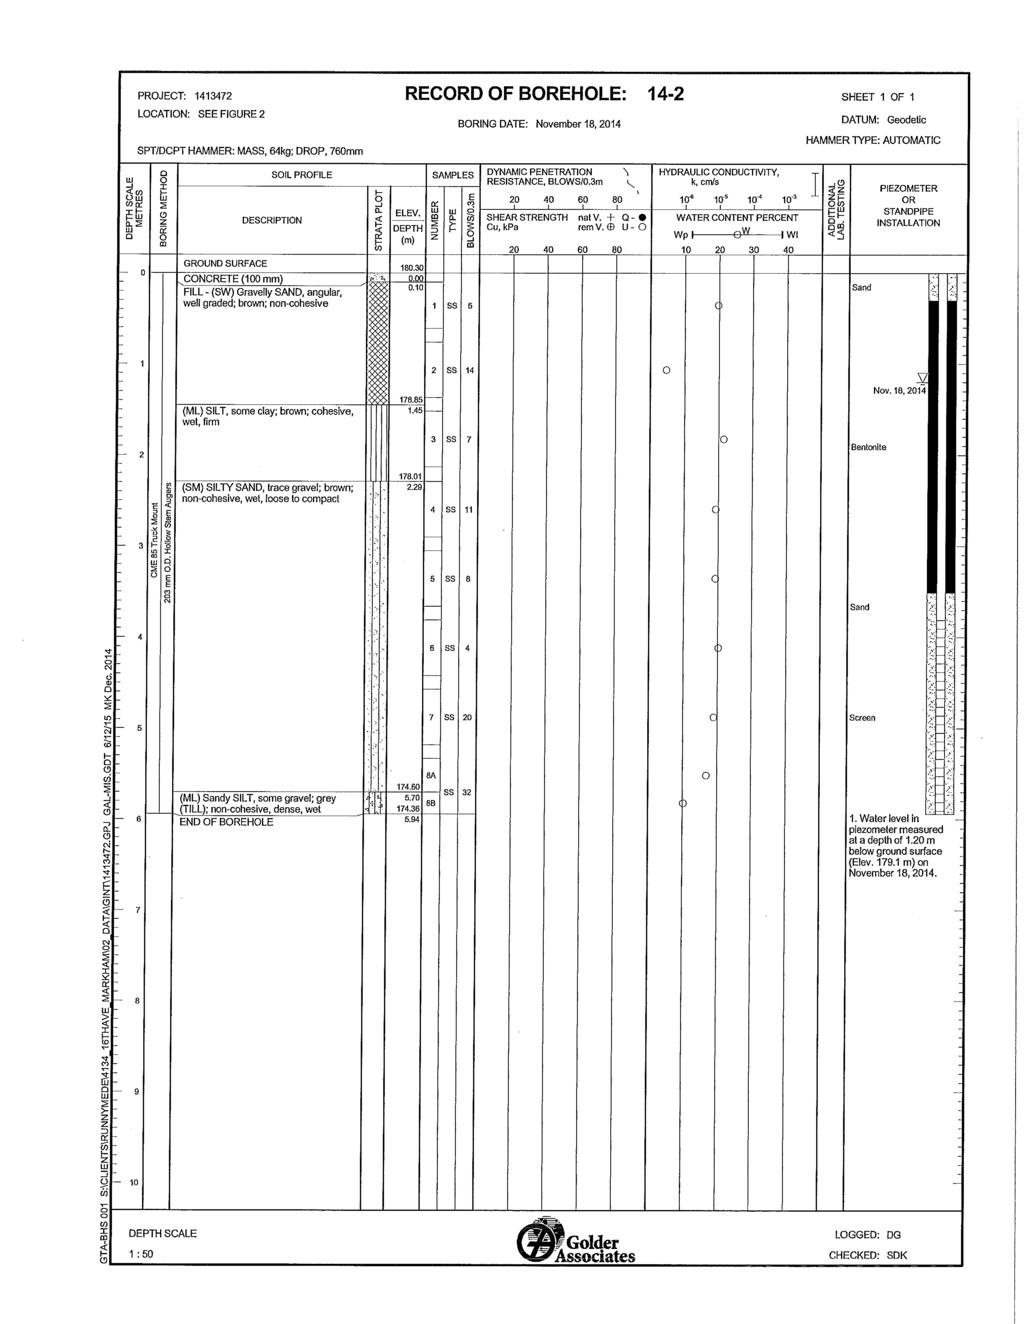
71
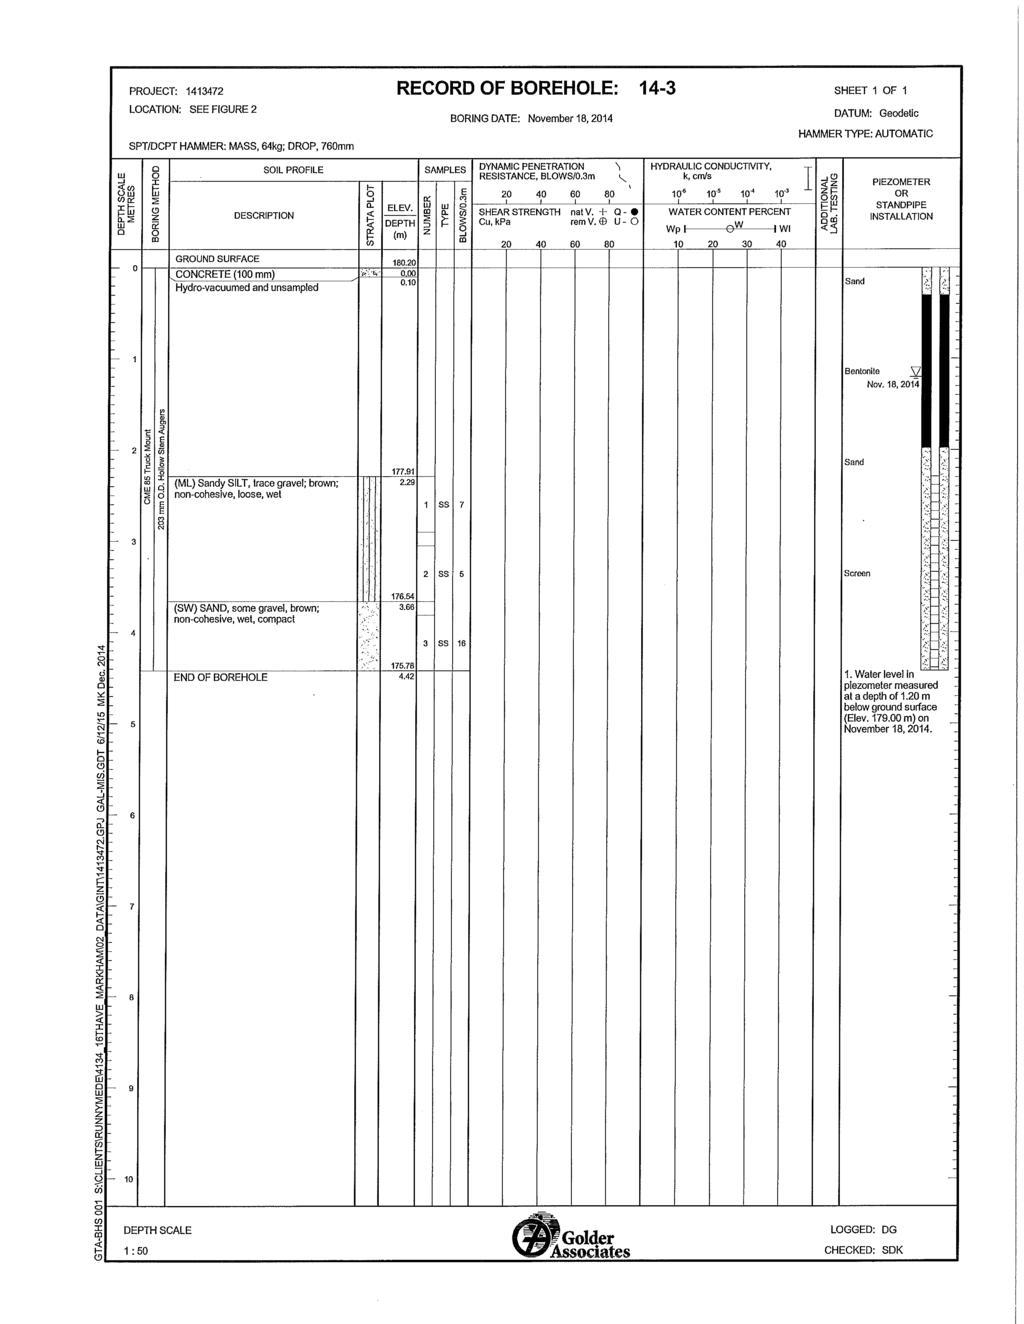
72
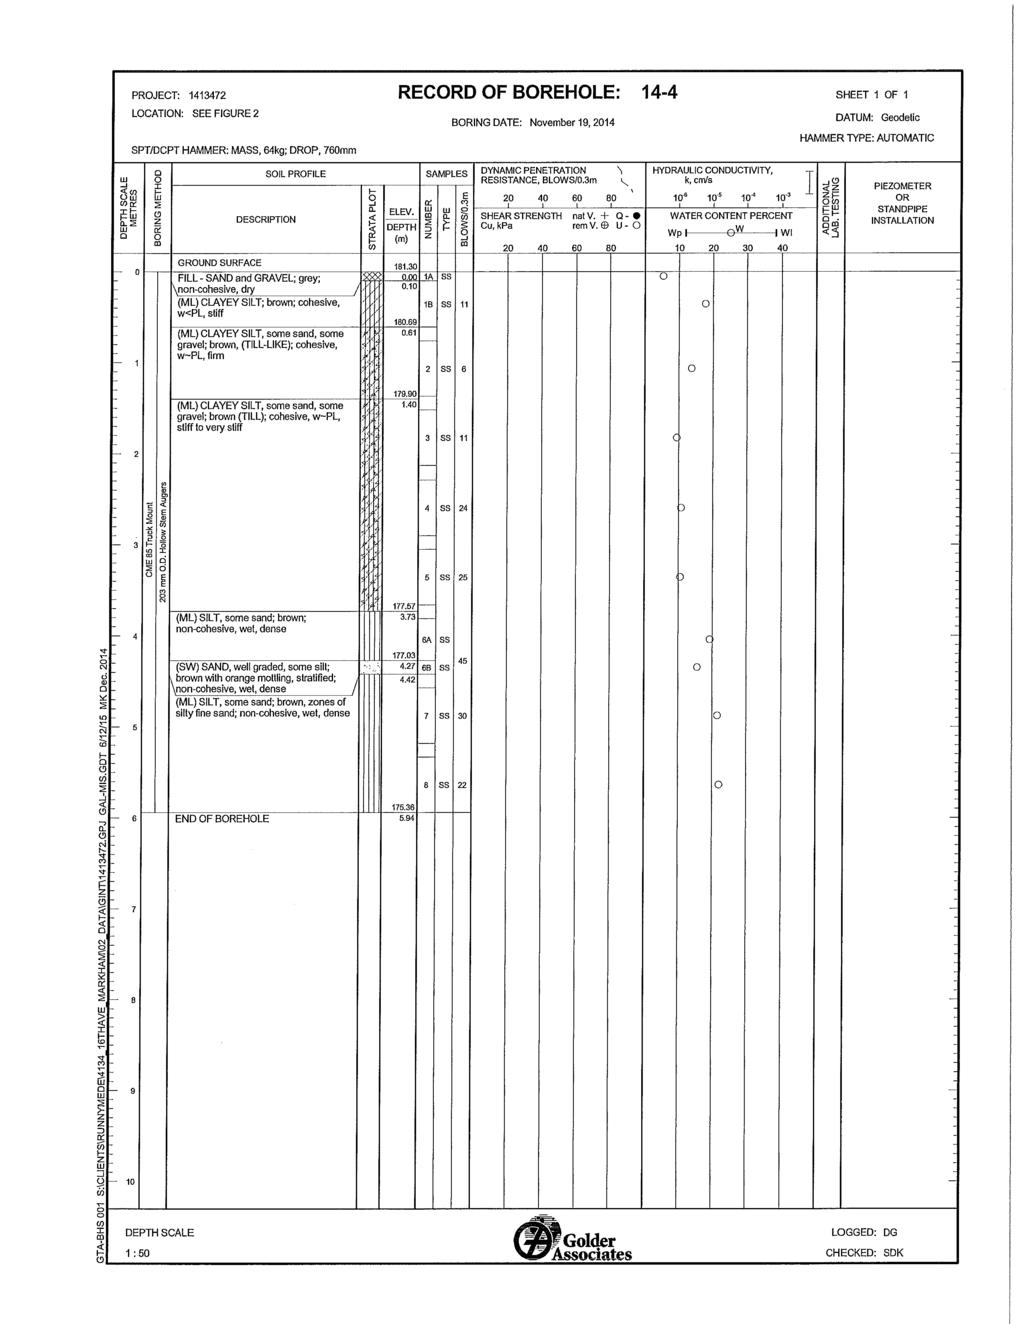
73

74
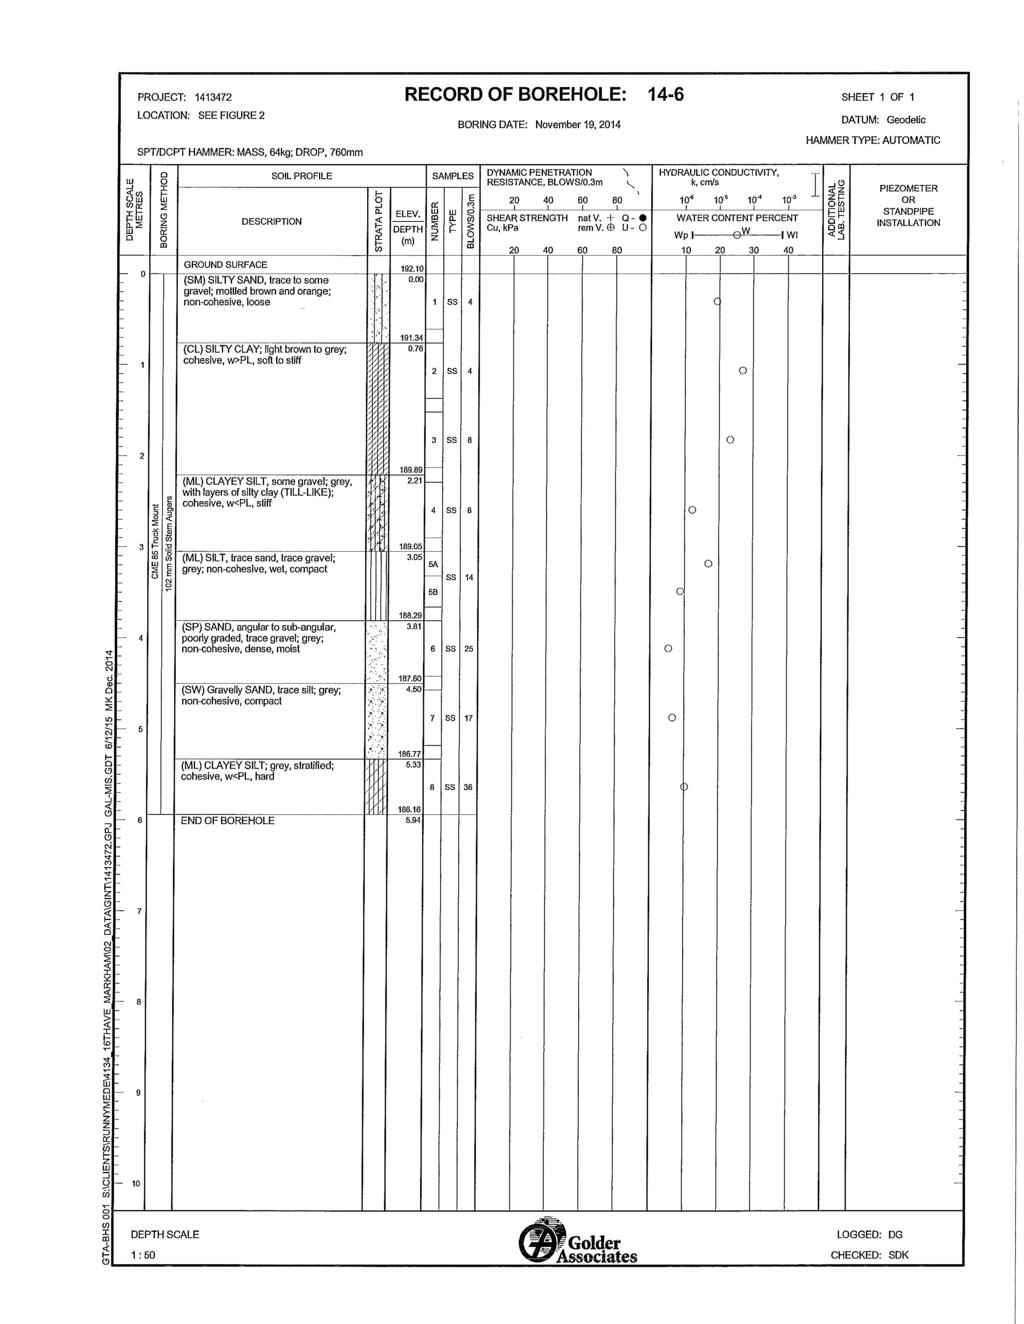
75
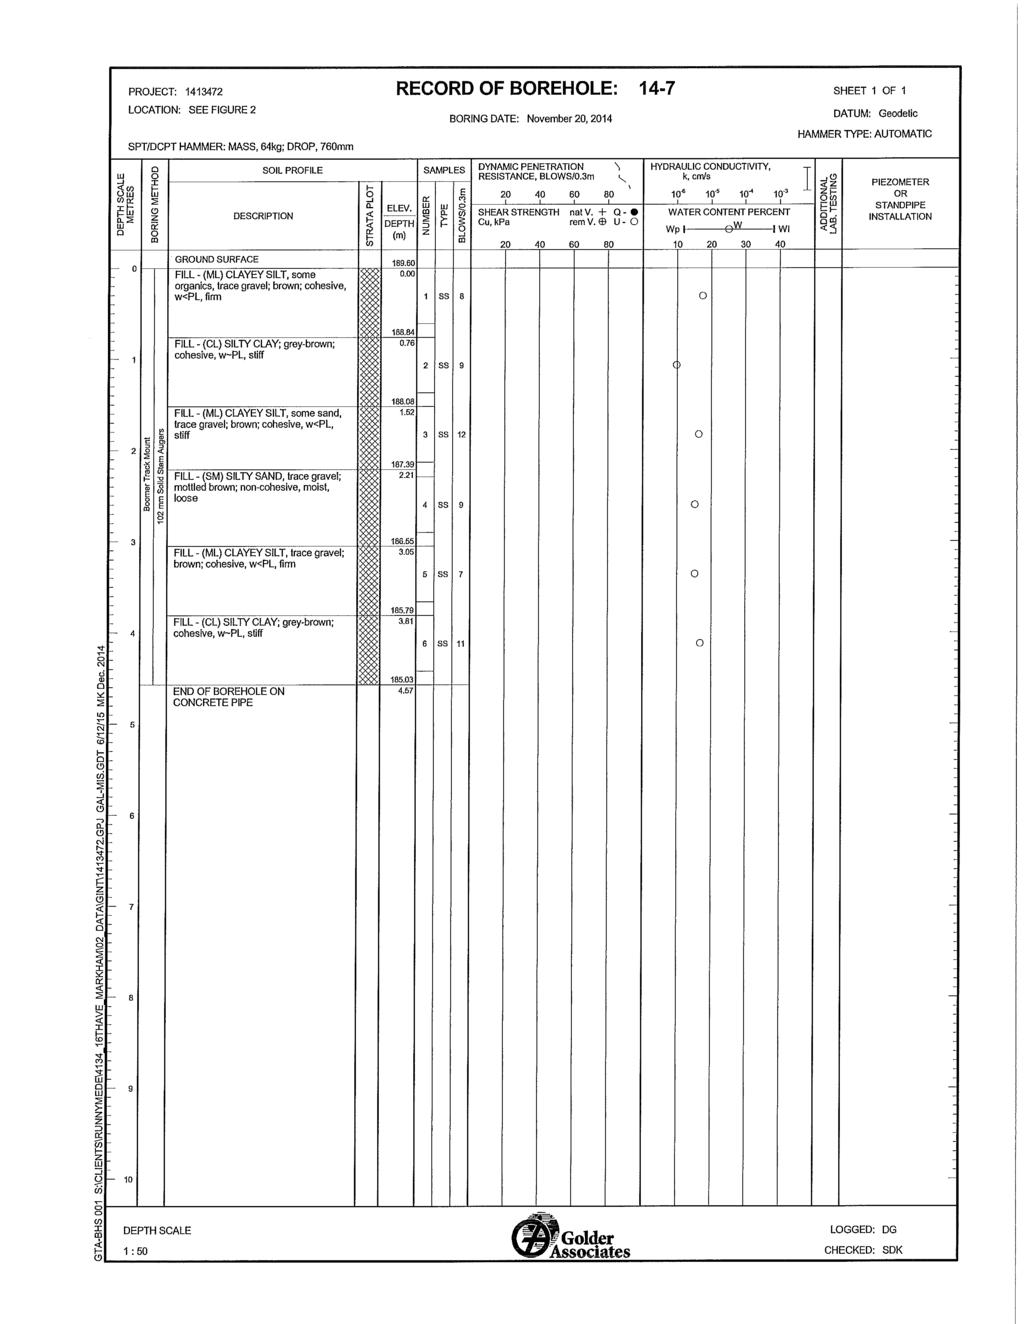
76
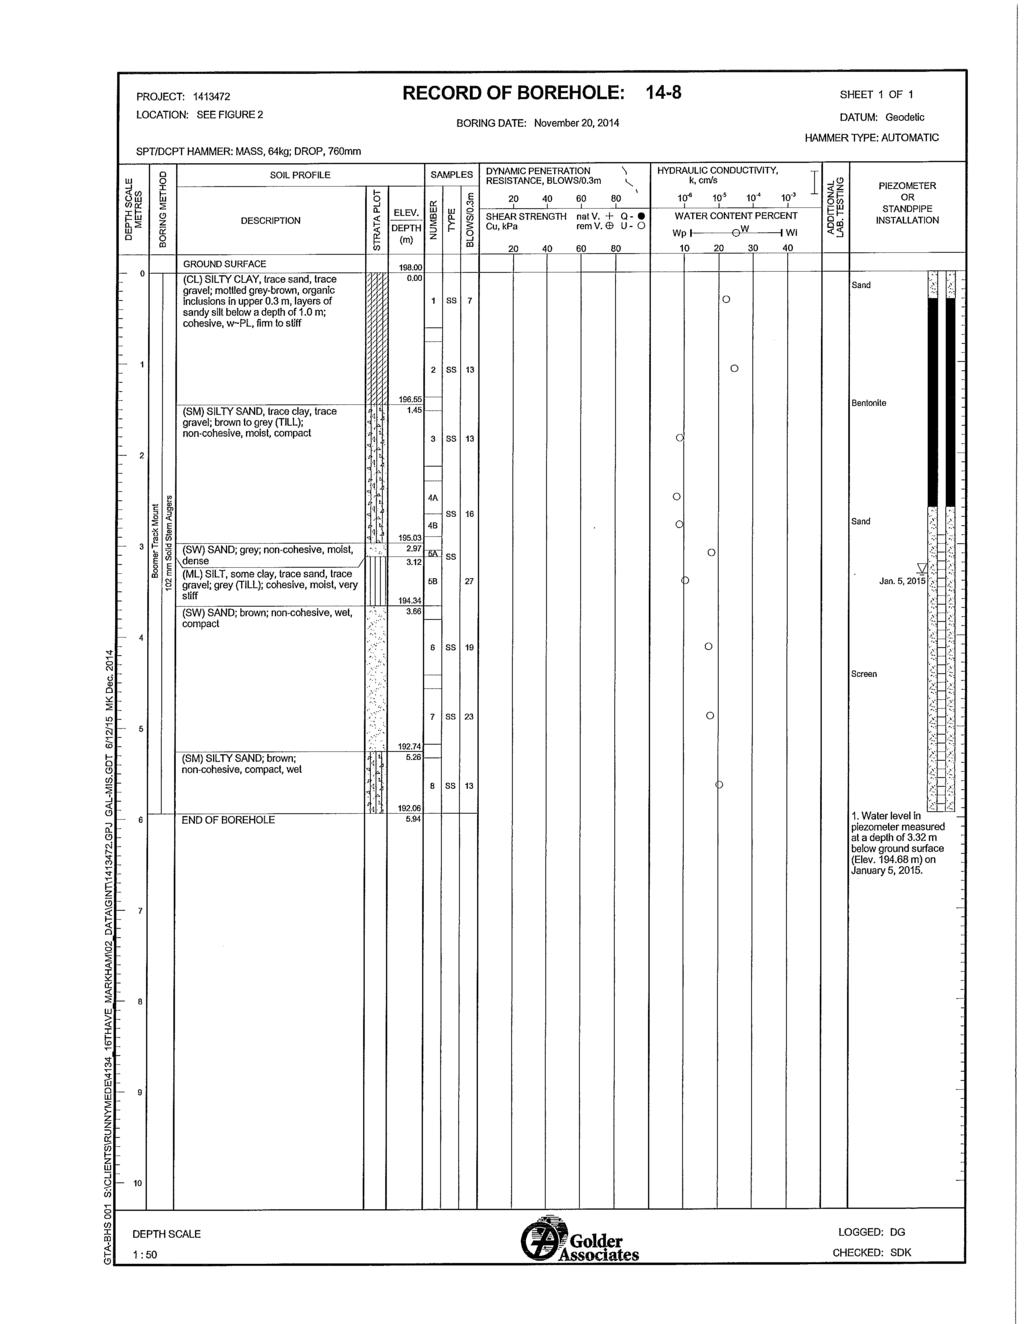
77

78
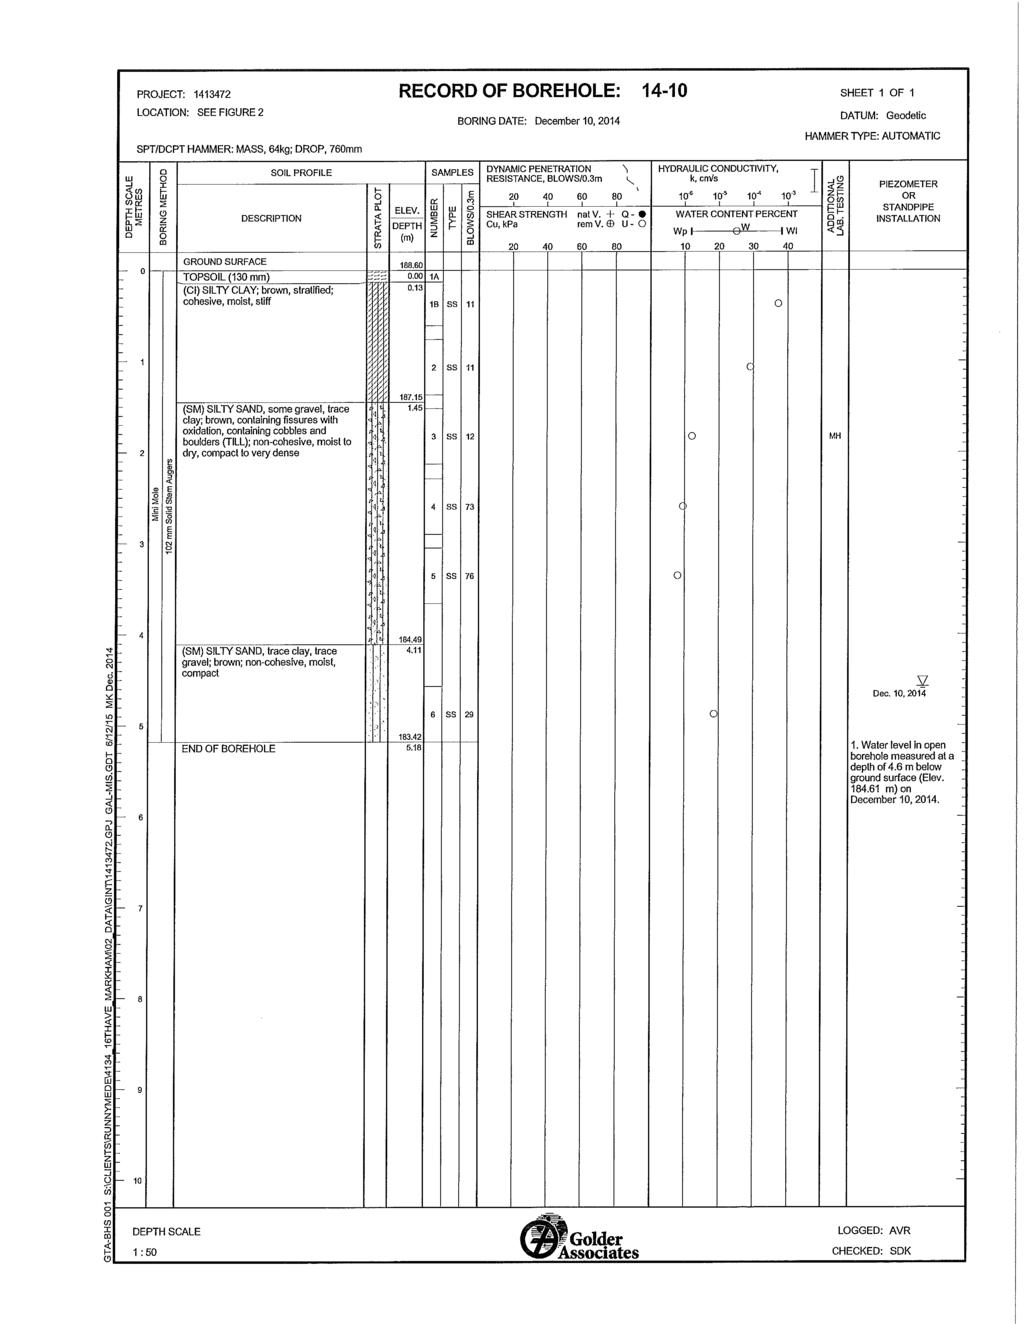
79
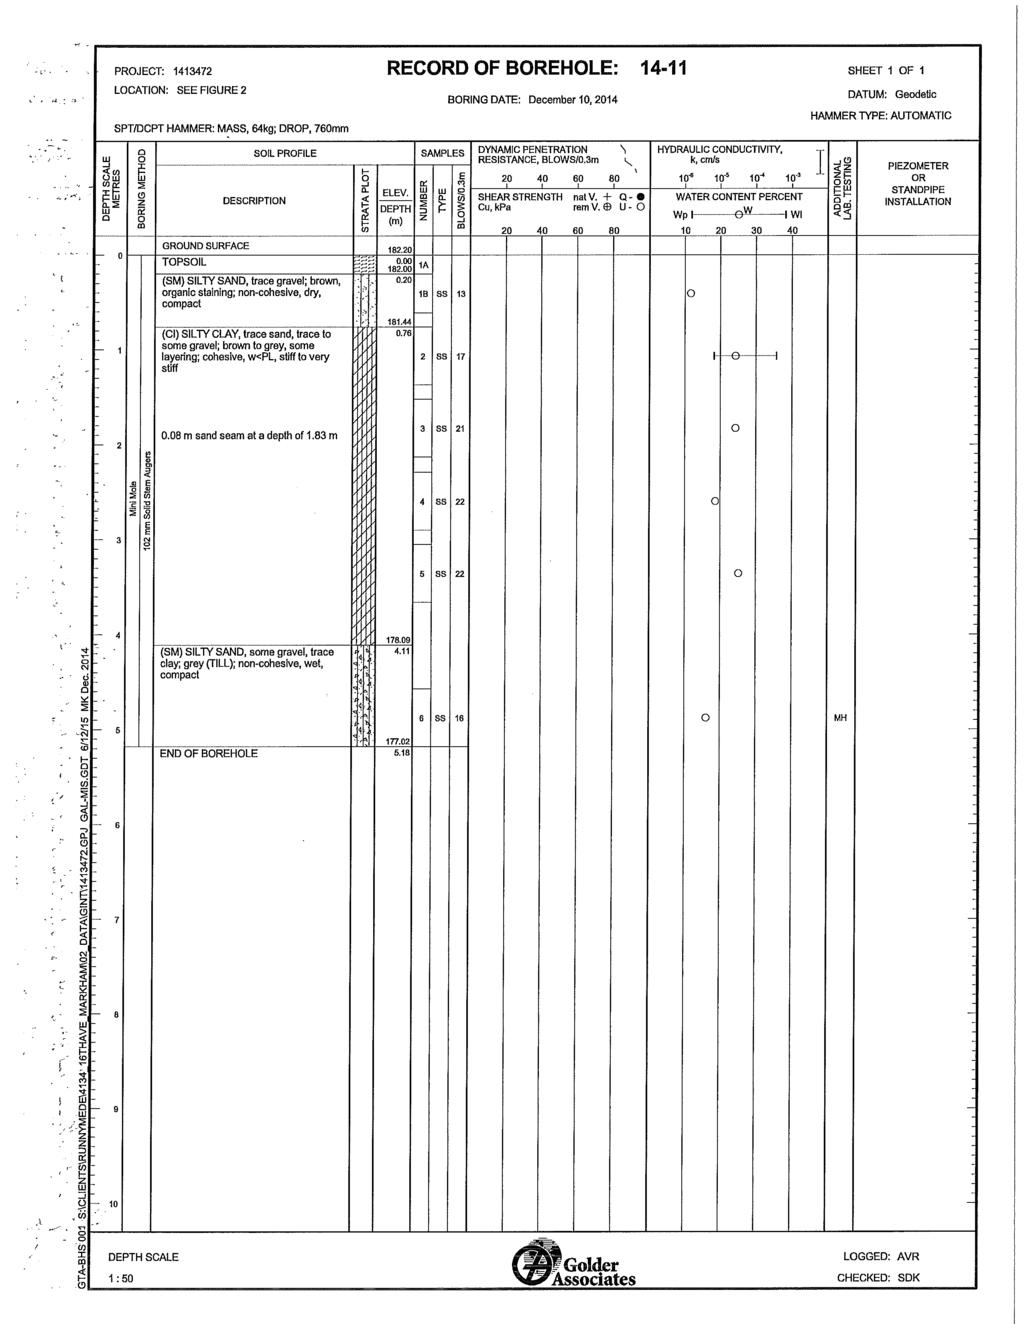
80
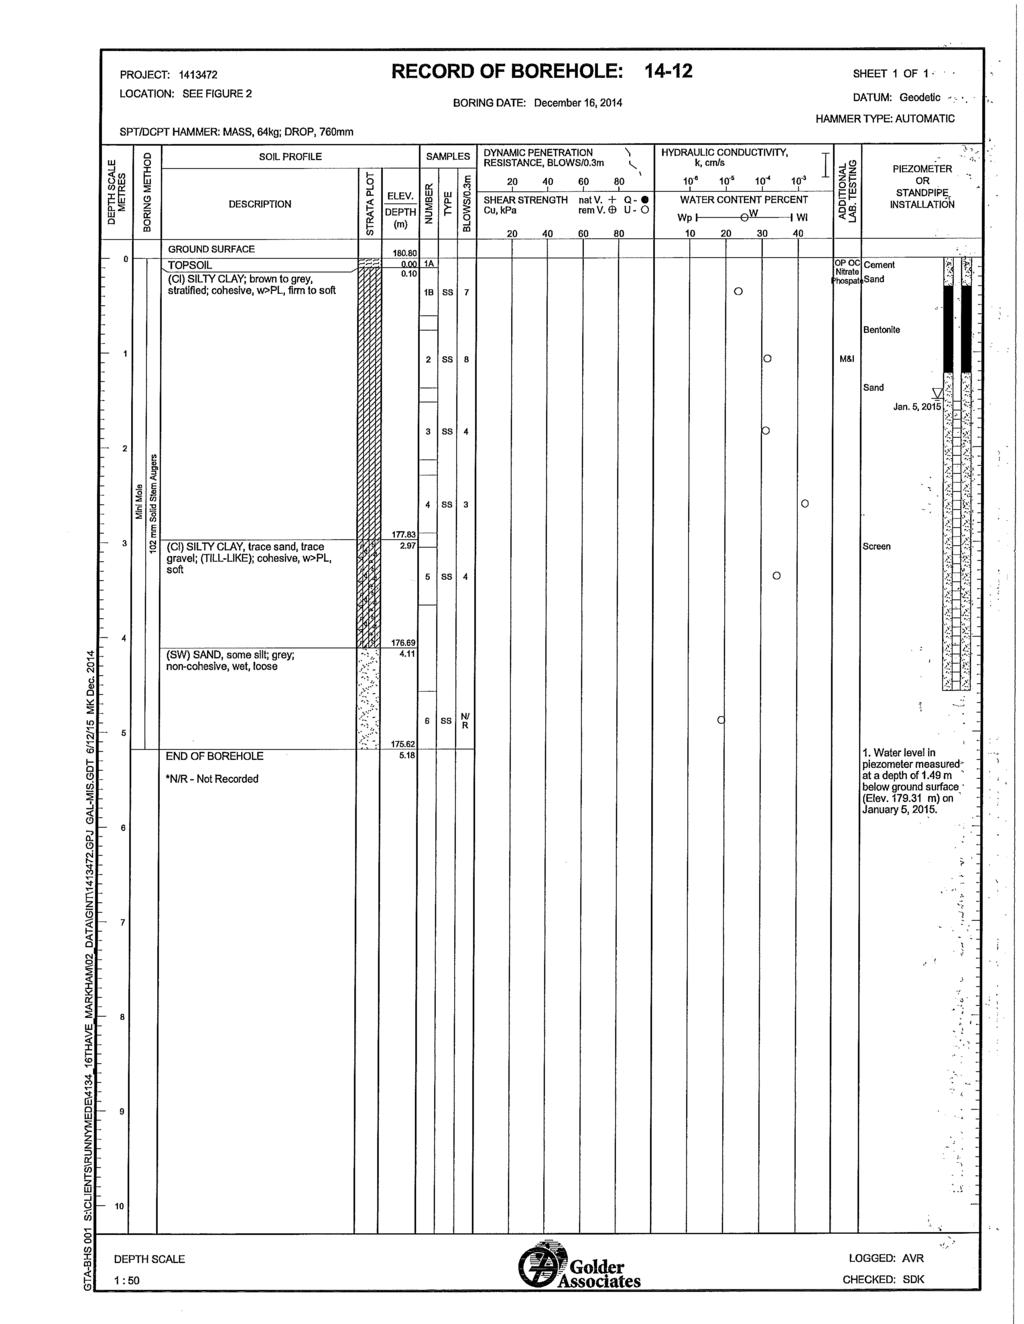
81
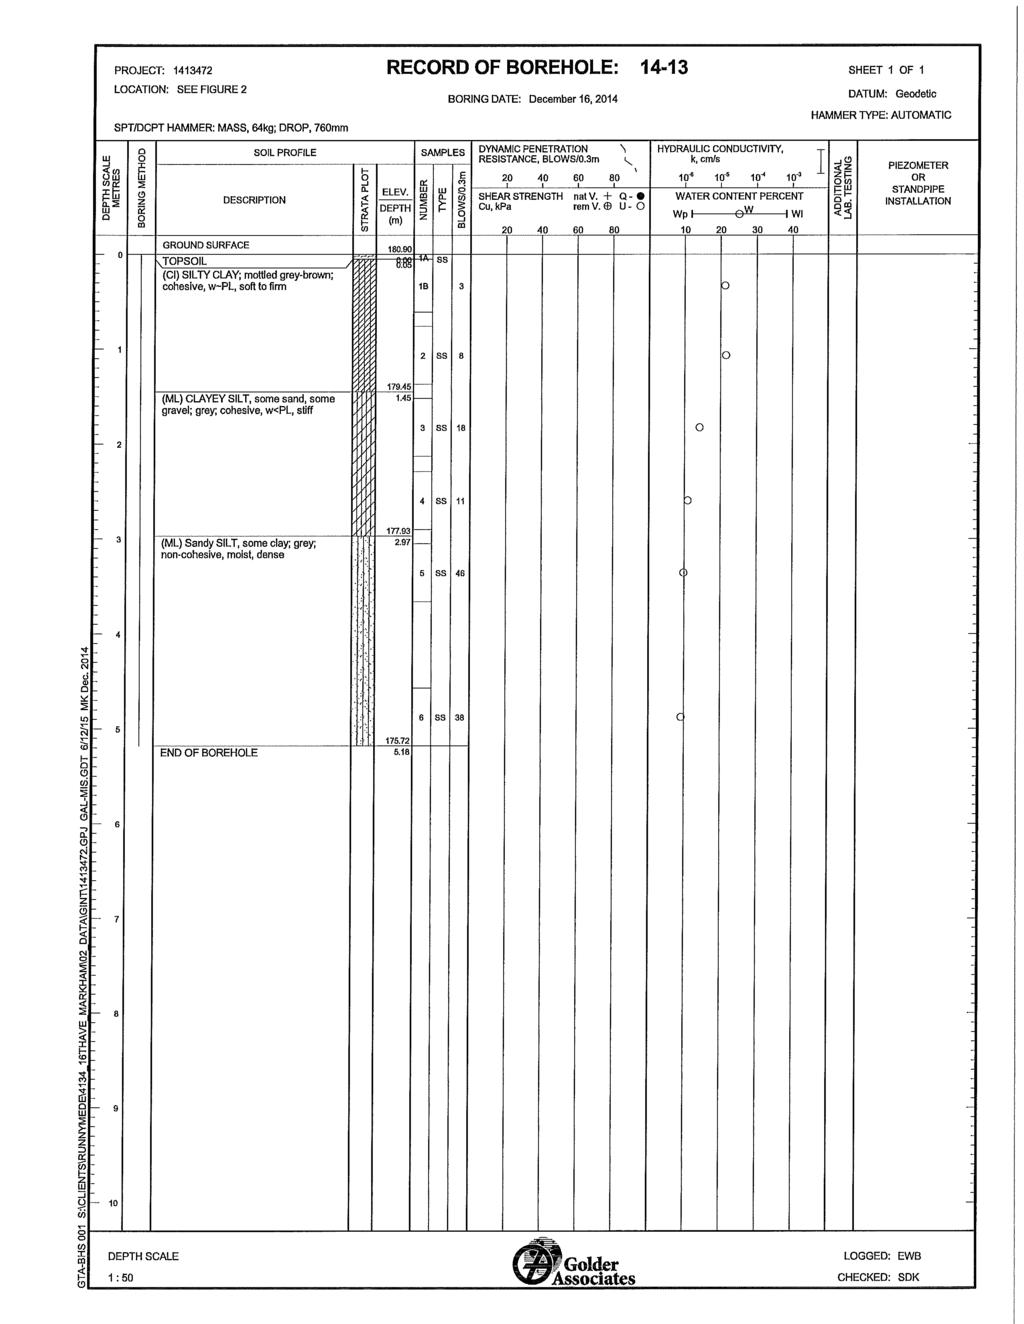
82
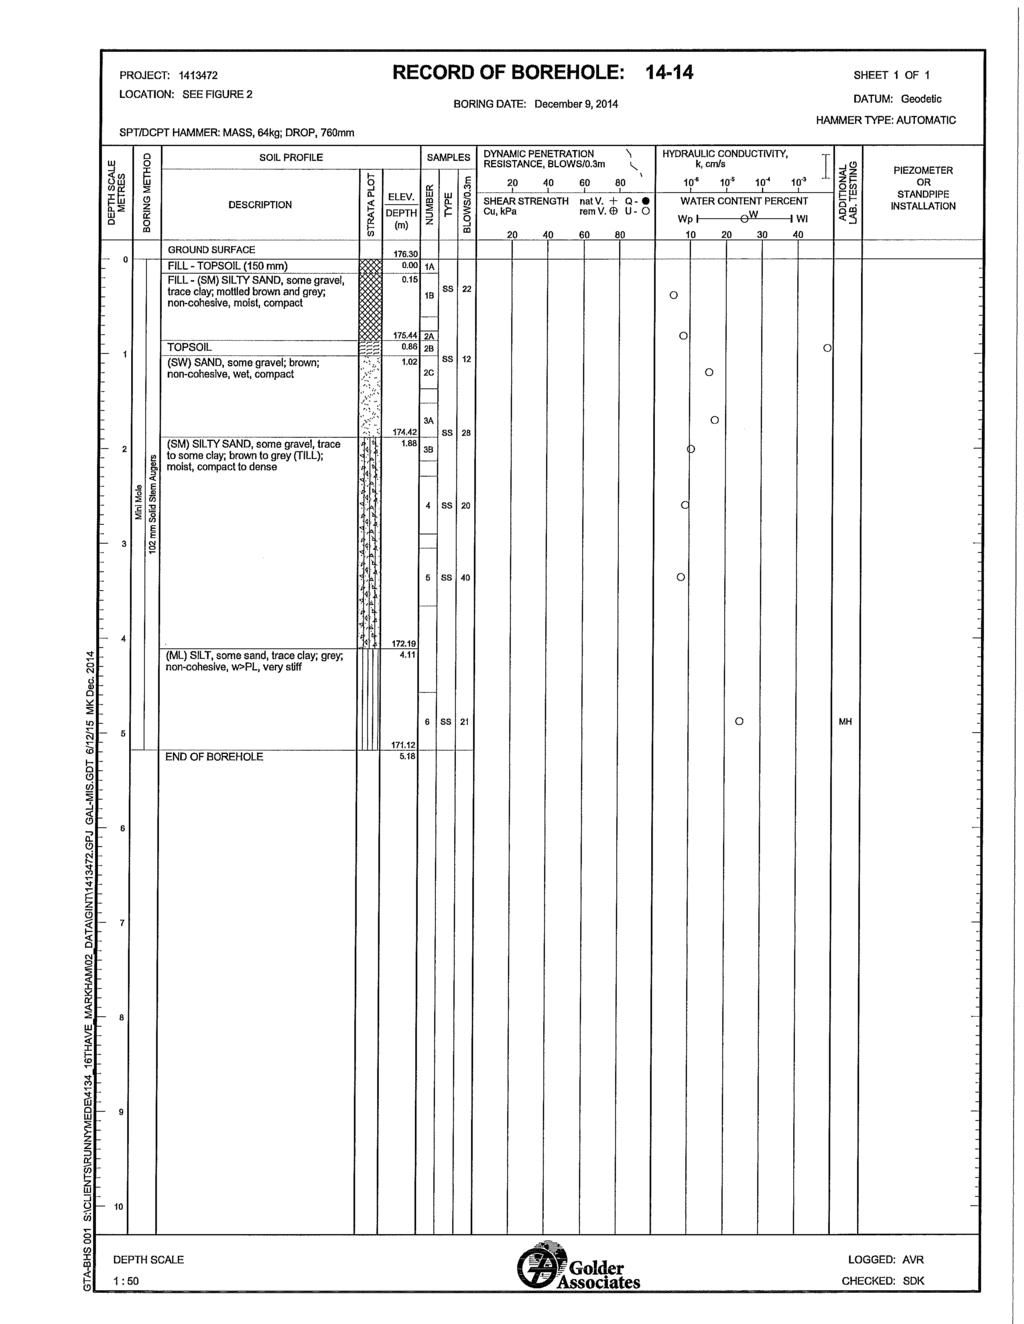
83

84

85
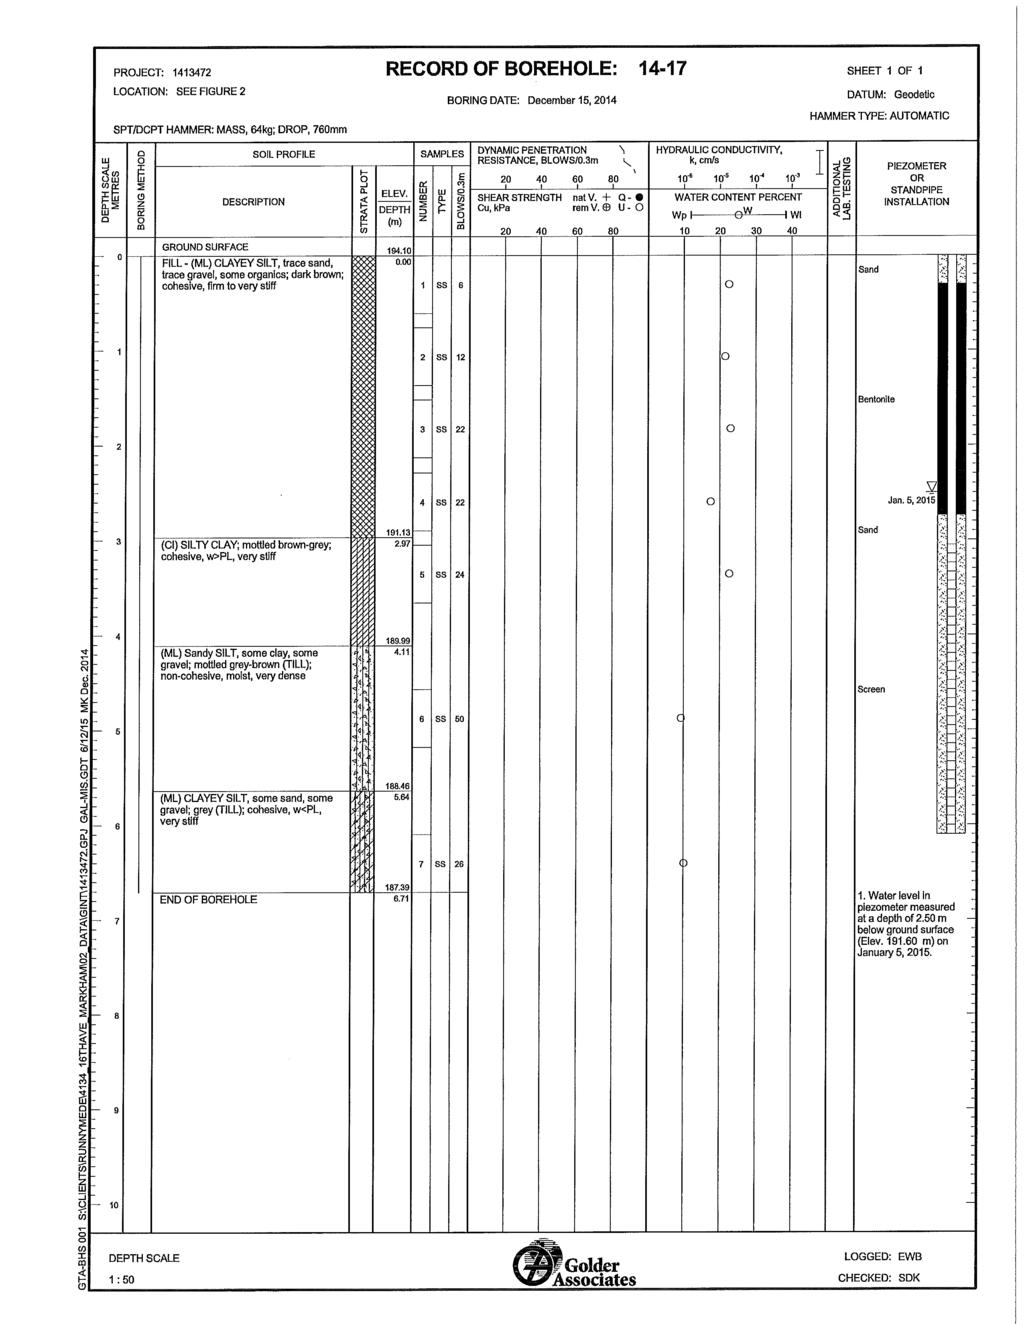
86
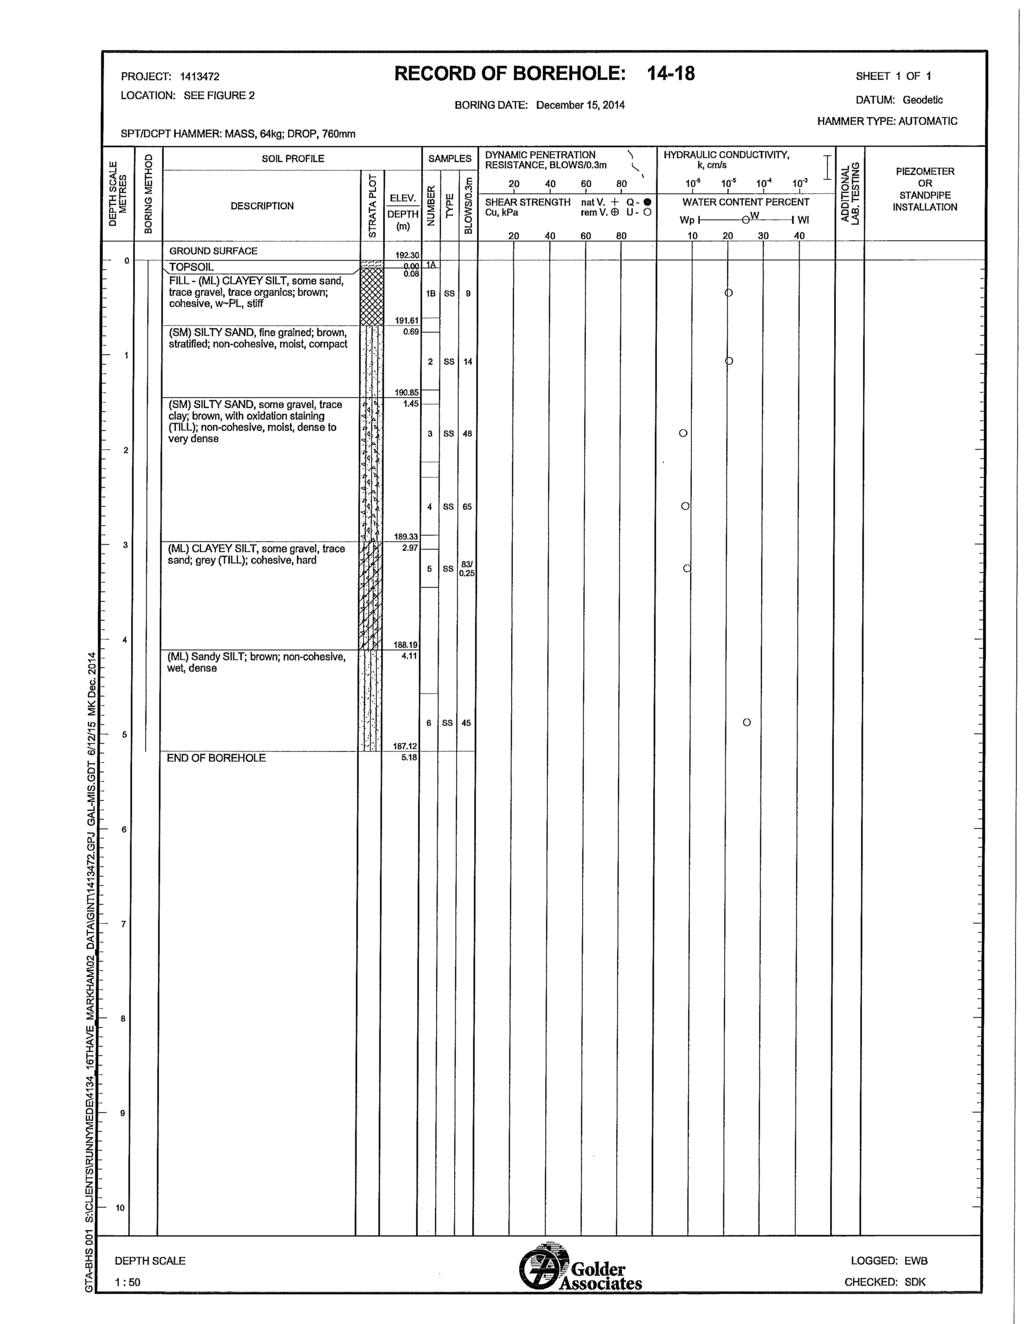
87
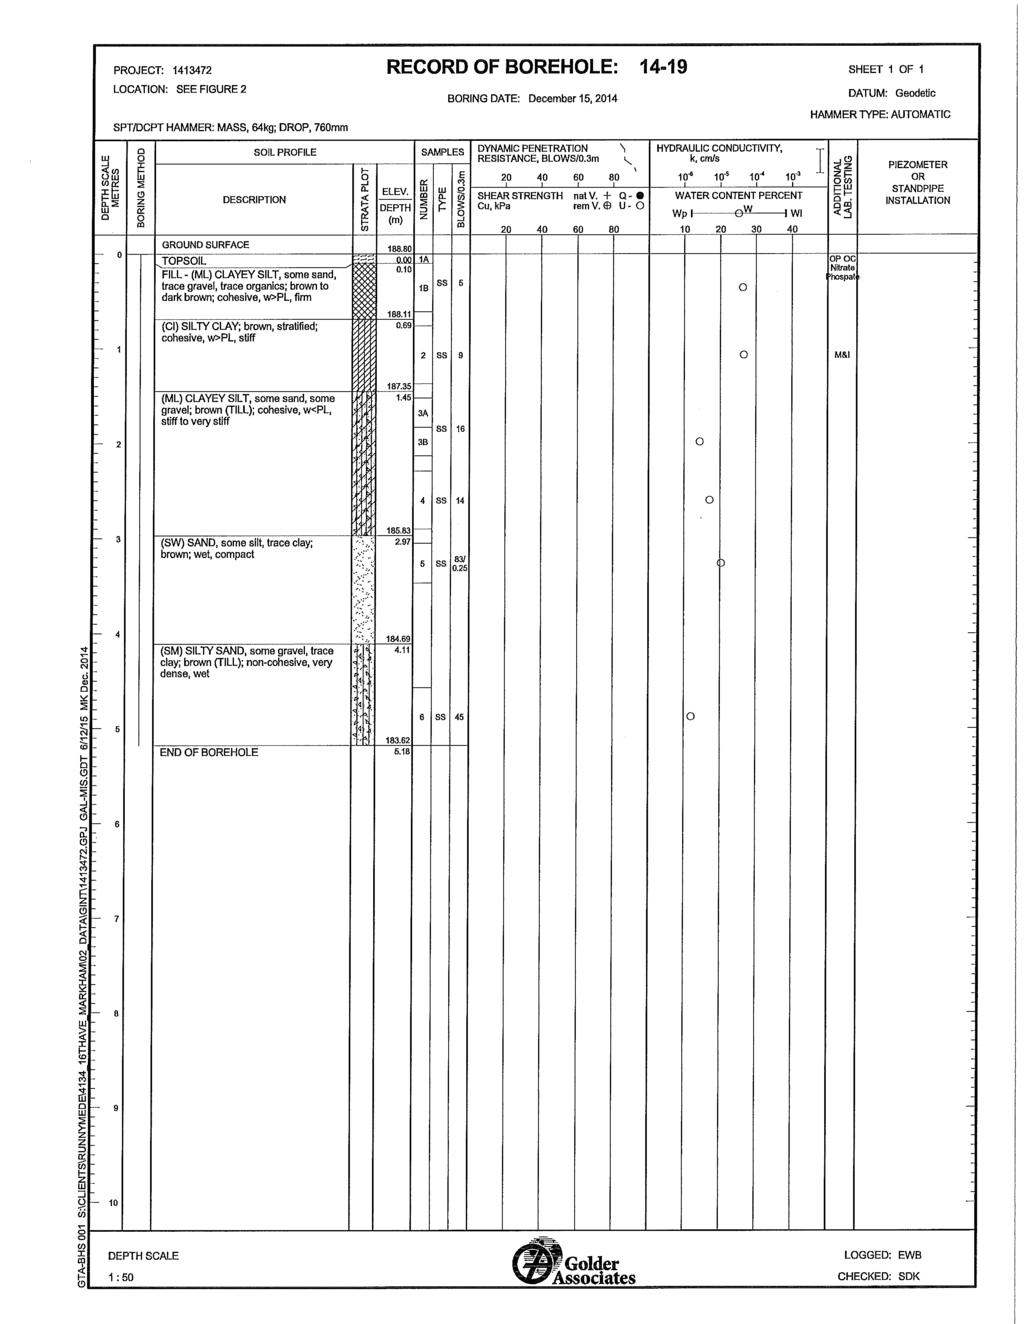
88
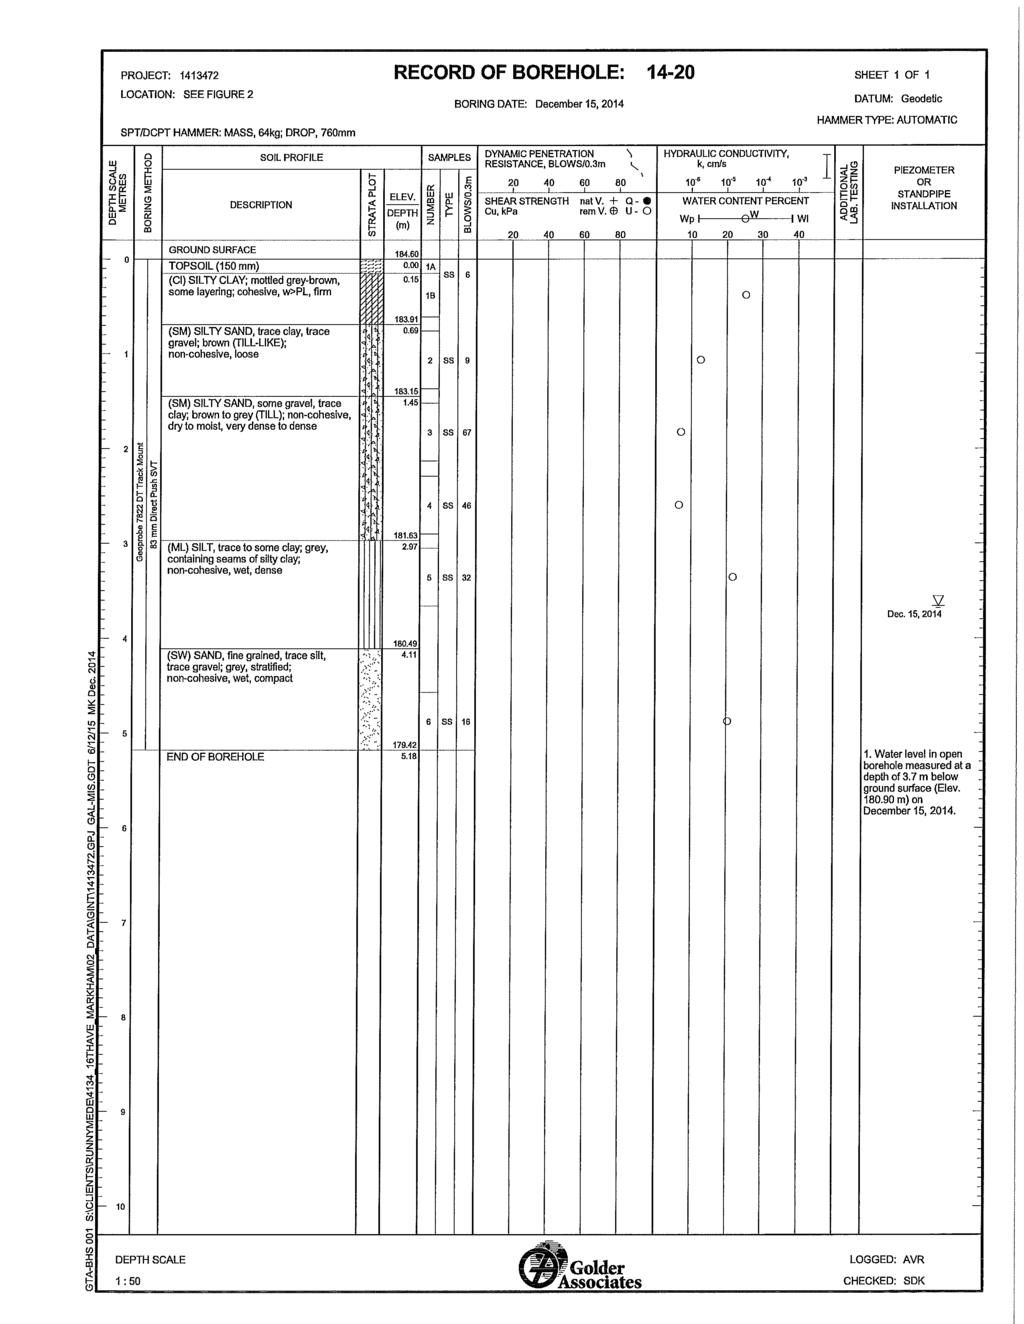
89
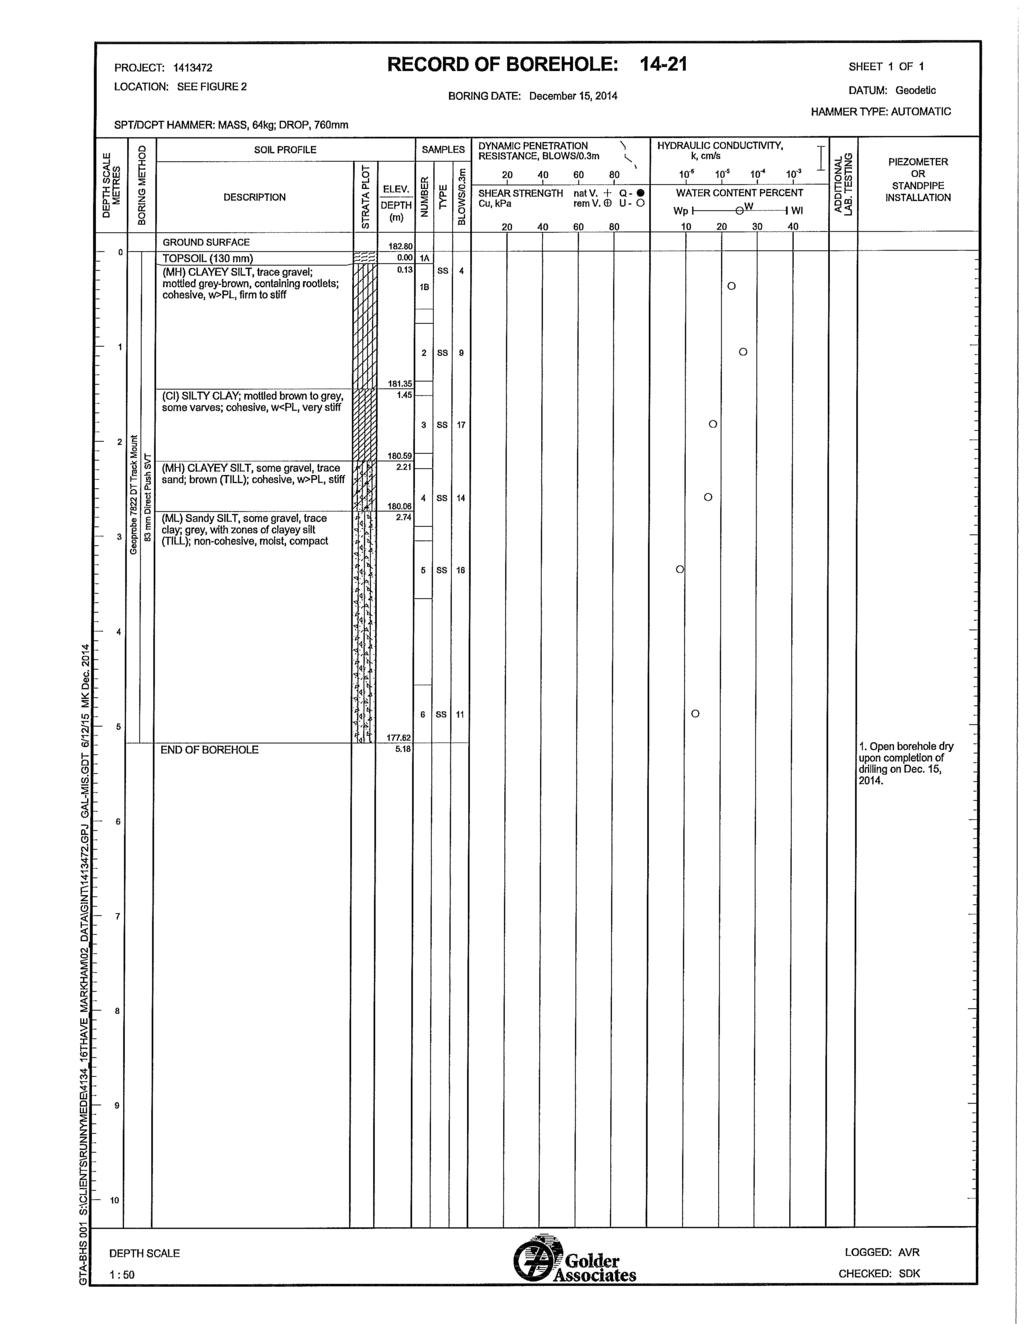
90
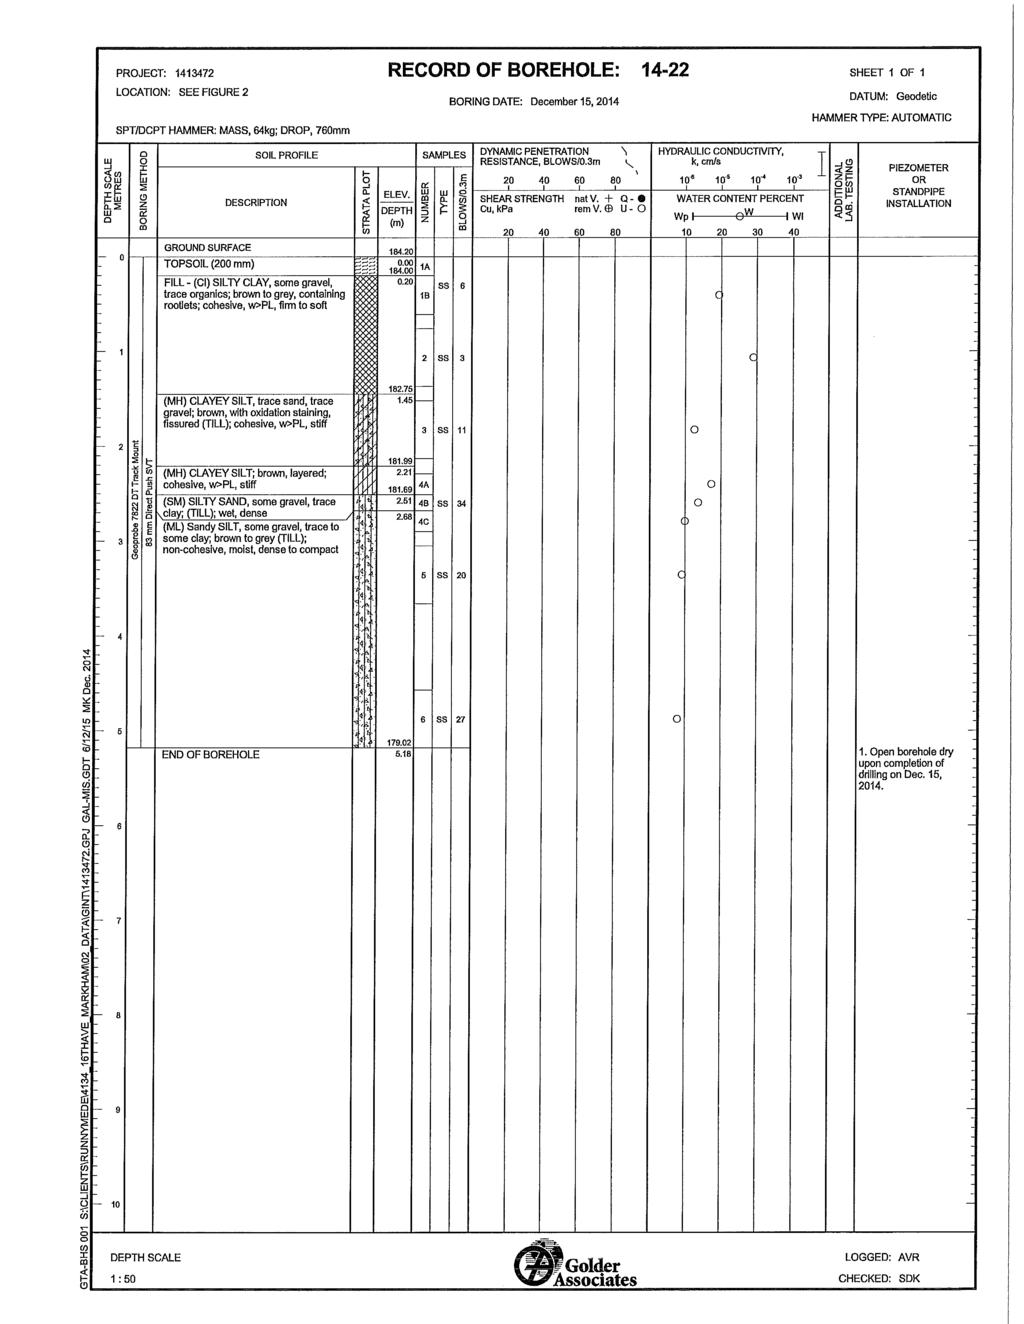
91

92

93
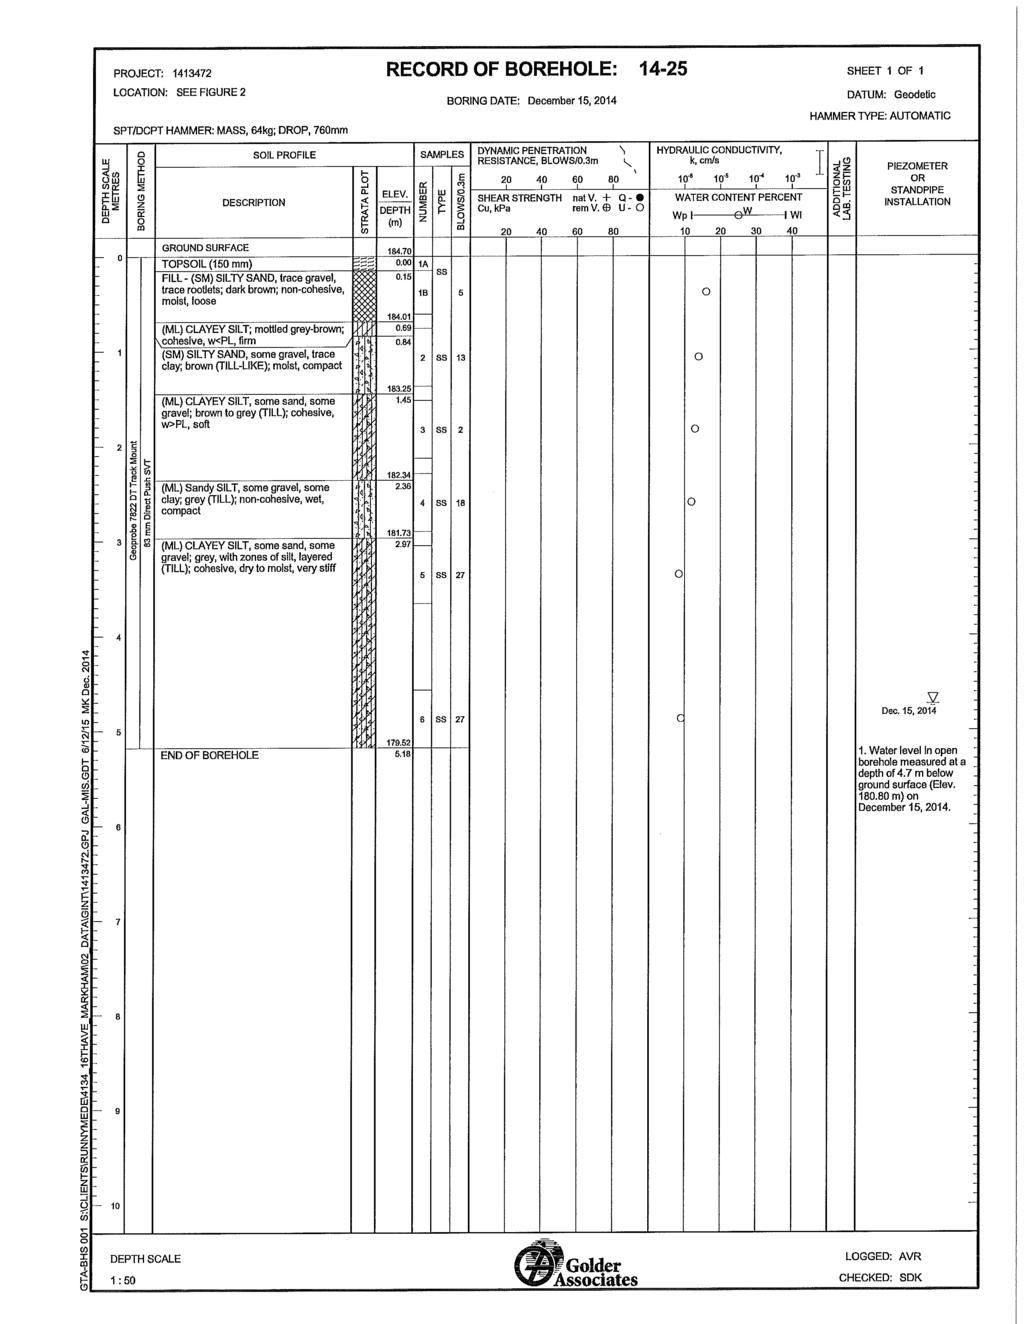
94
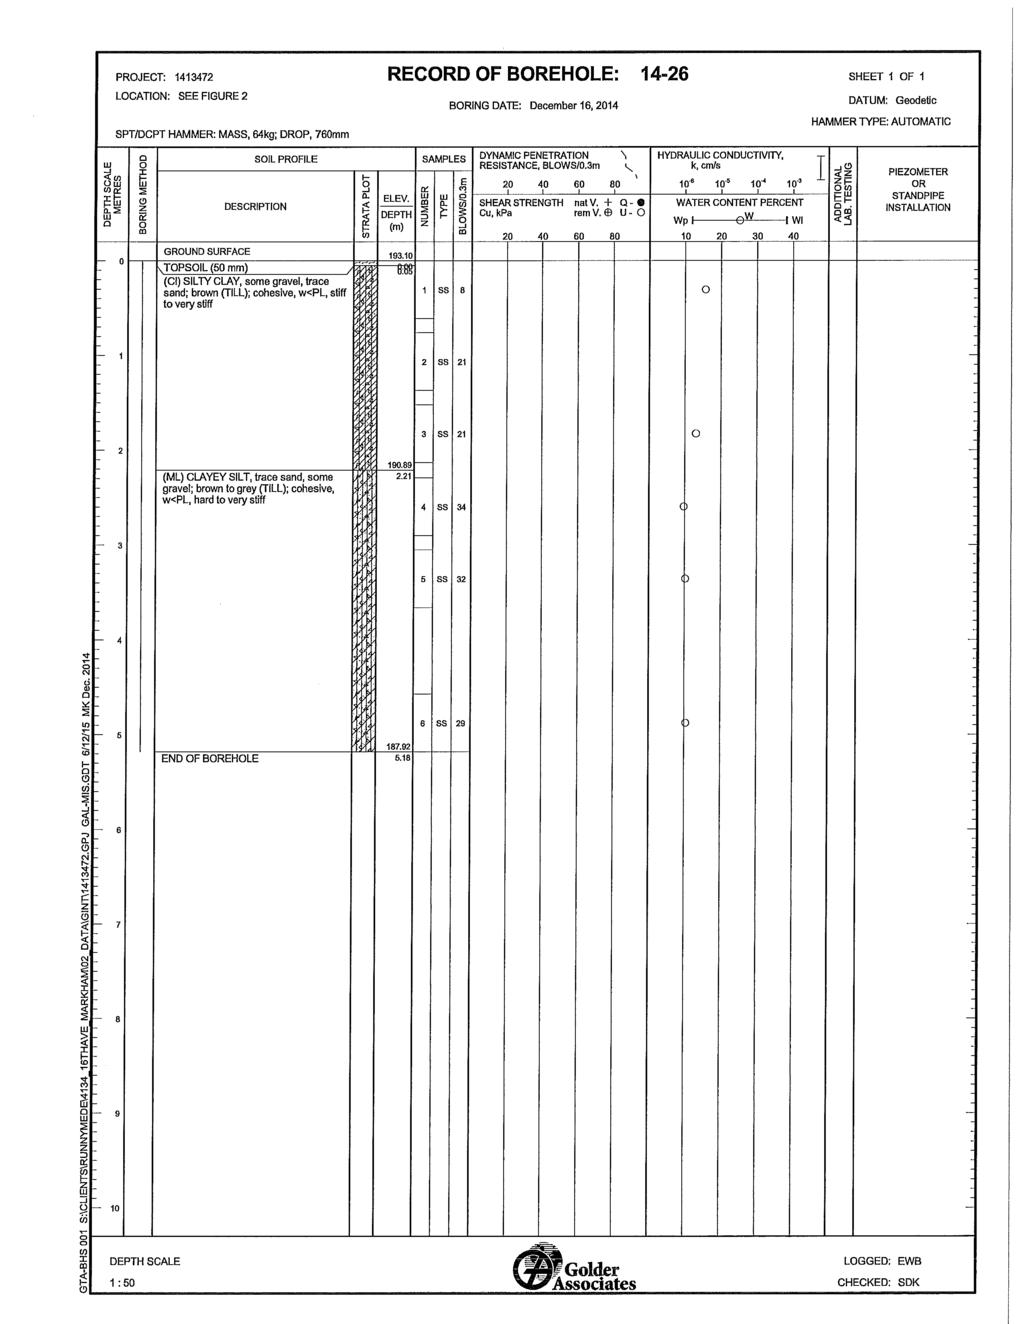
95
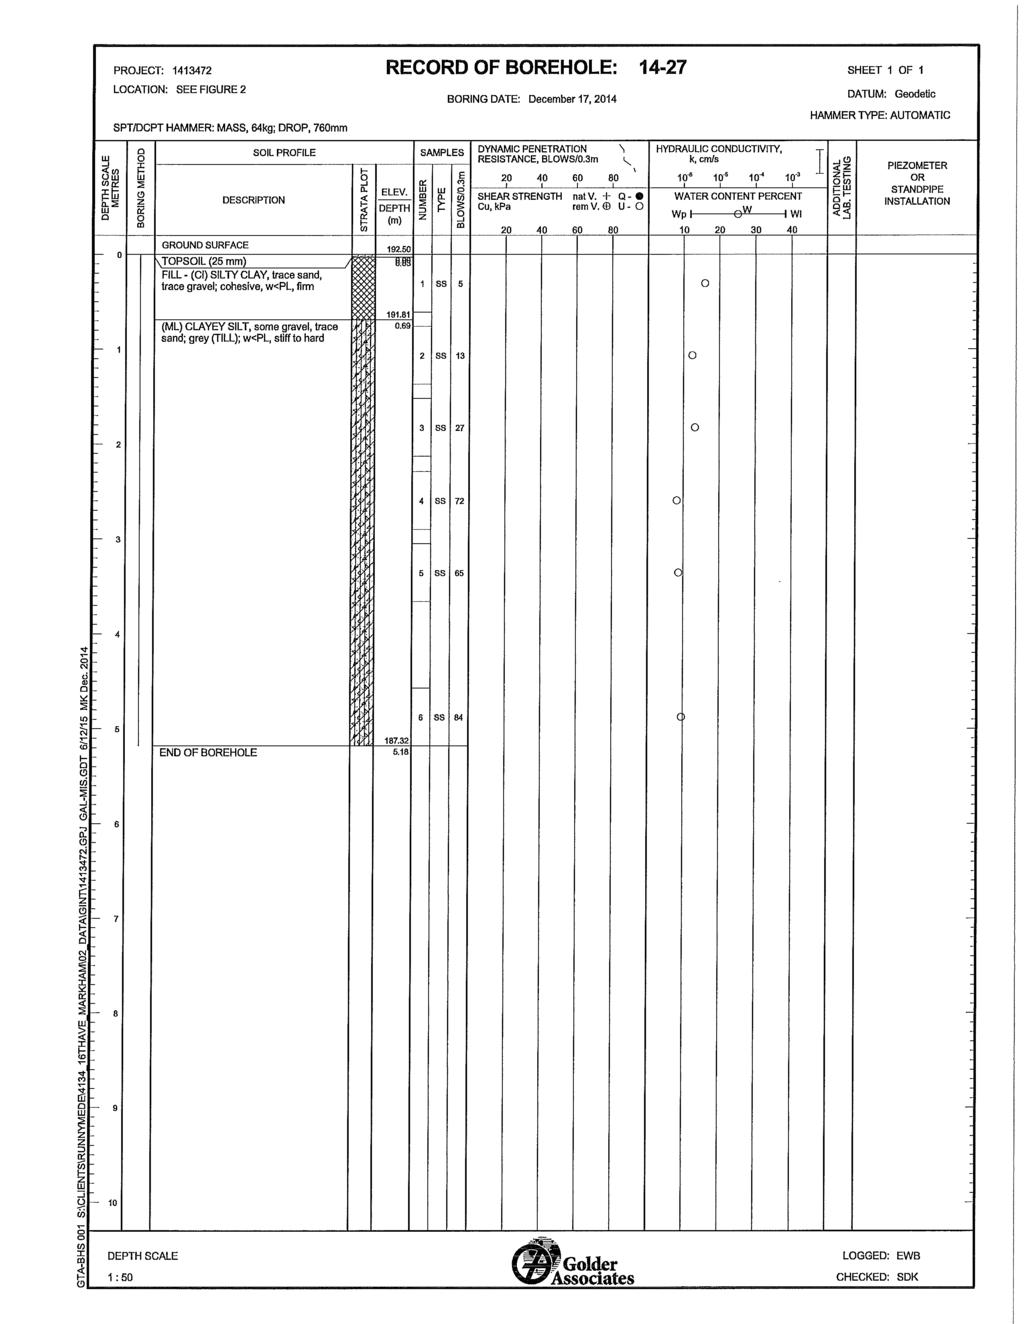
96

97
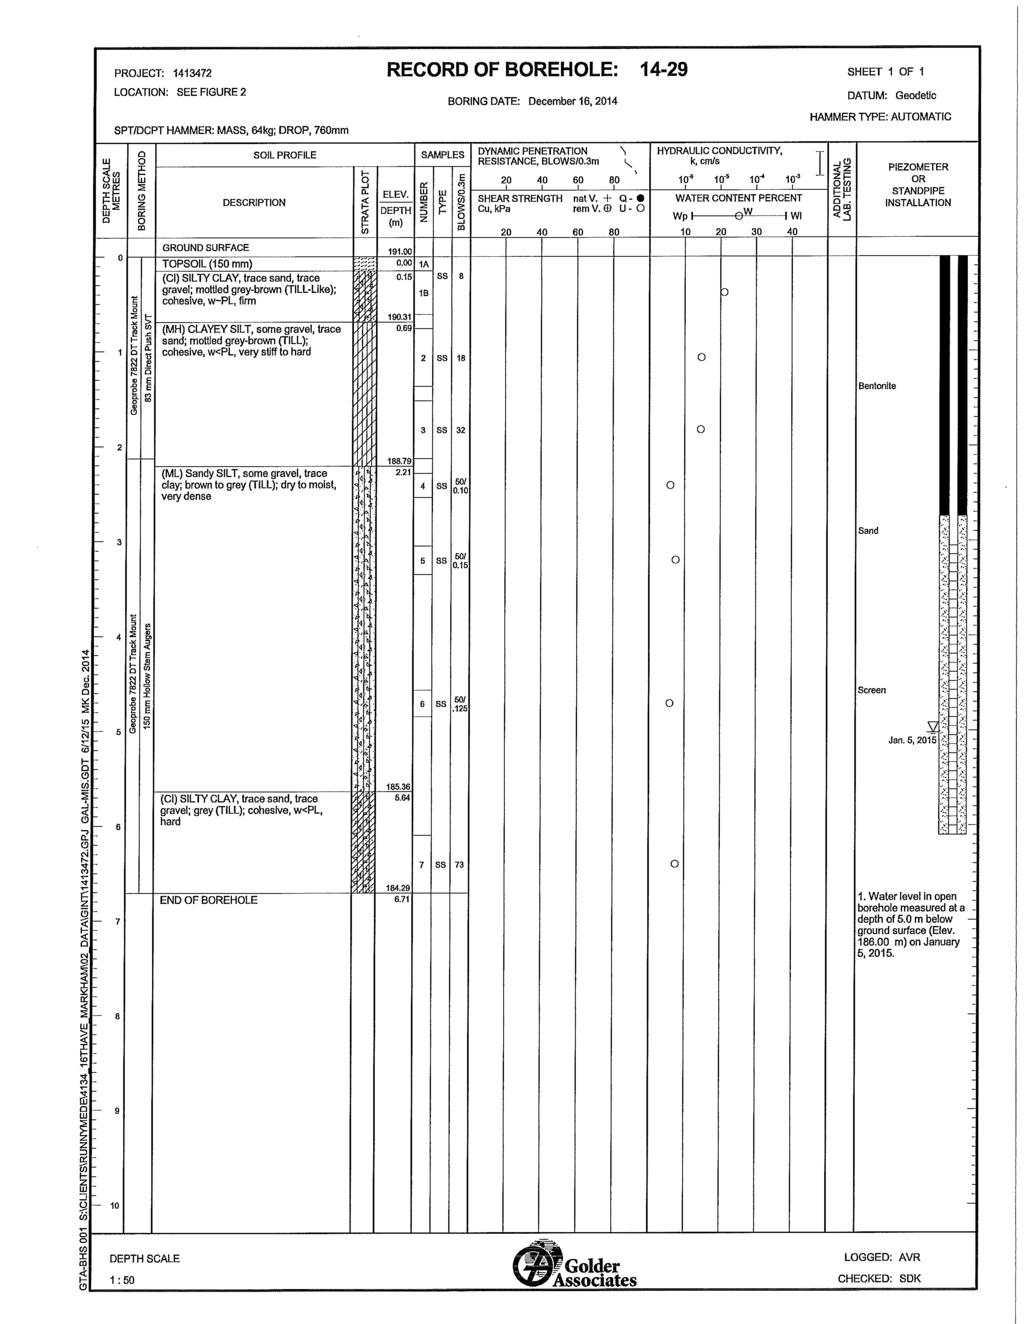
98
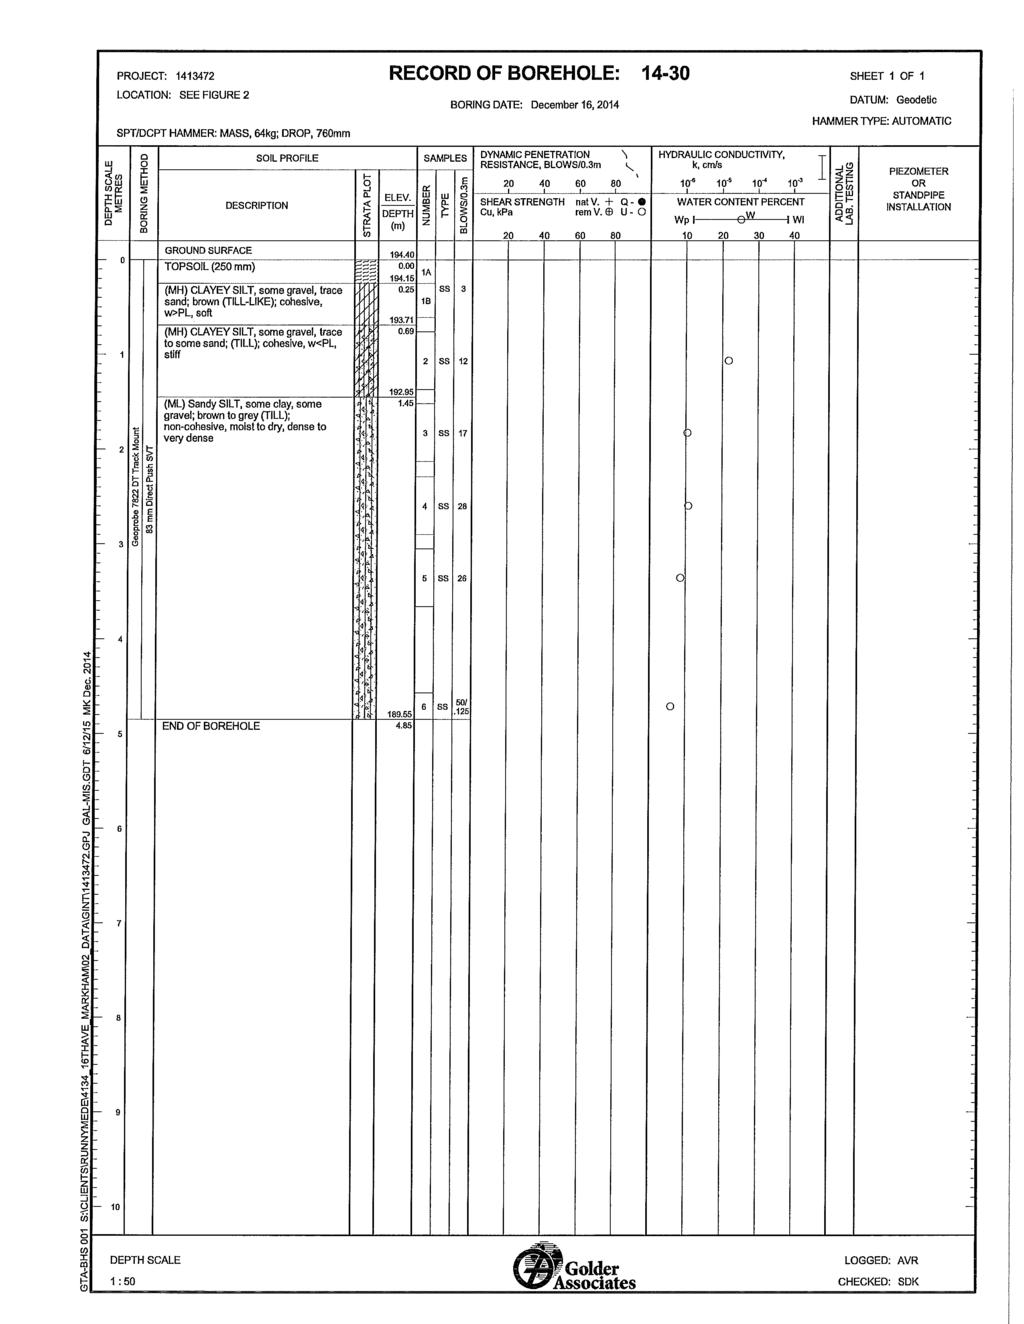
99

100
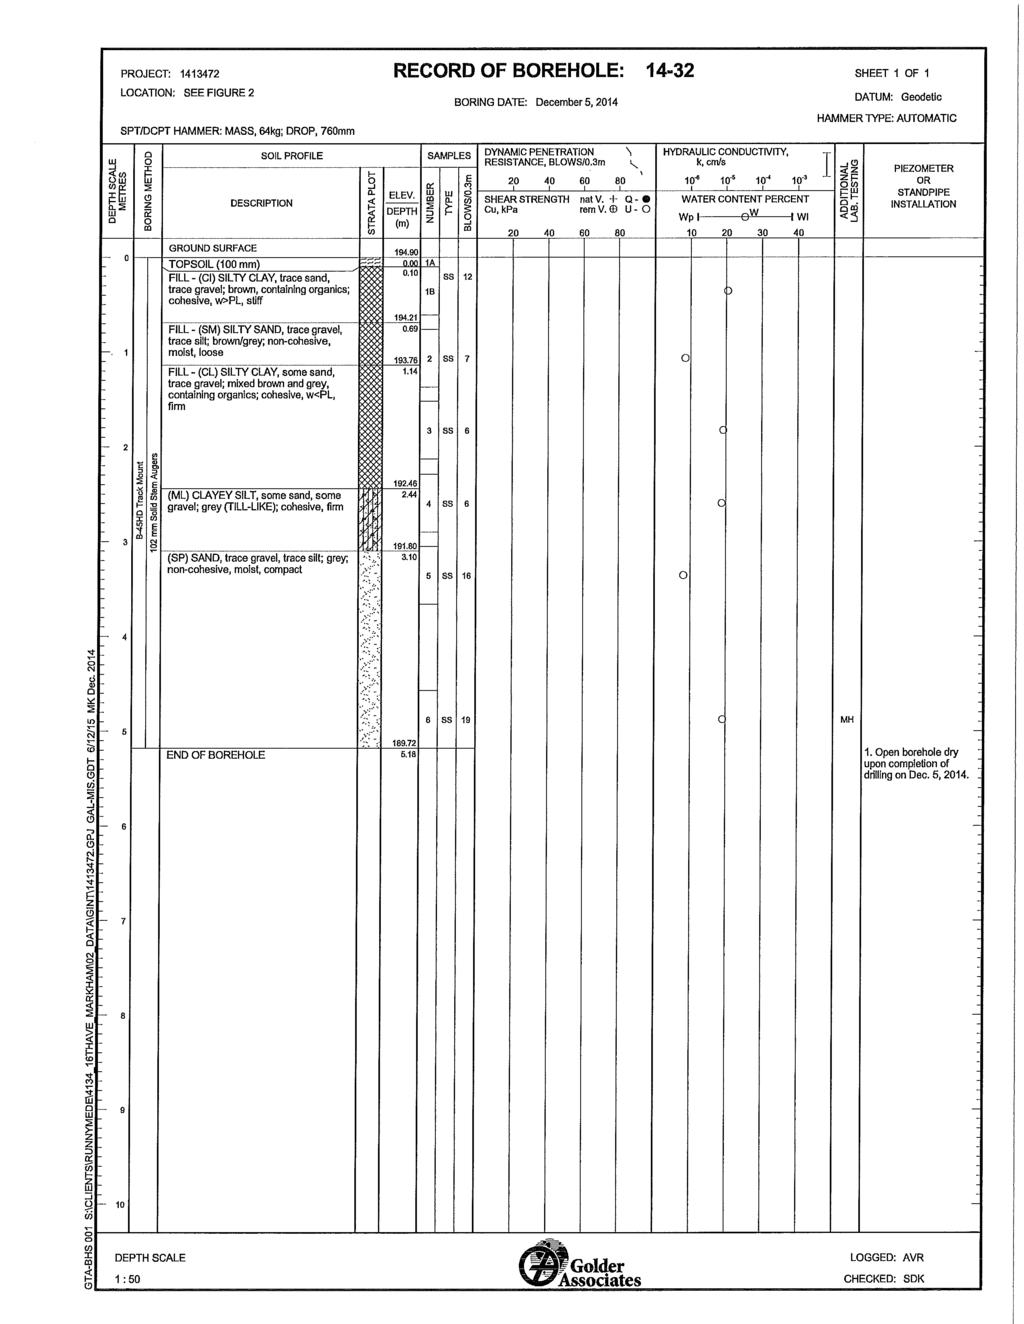
101
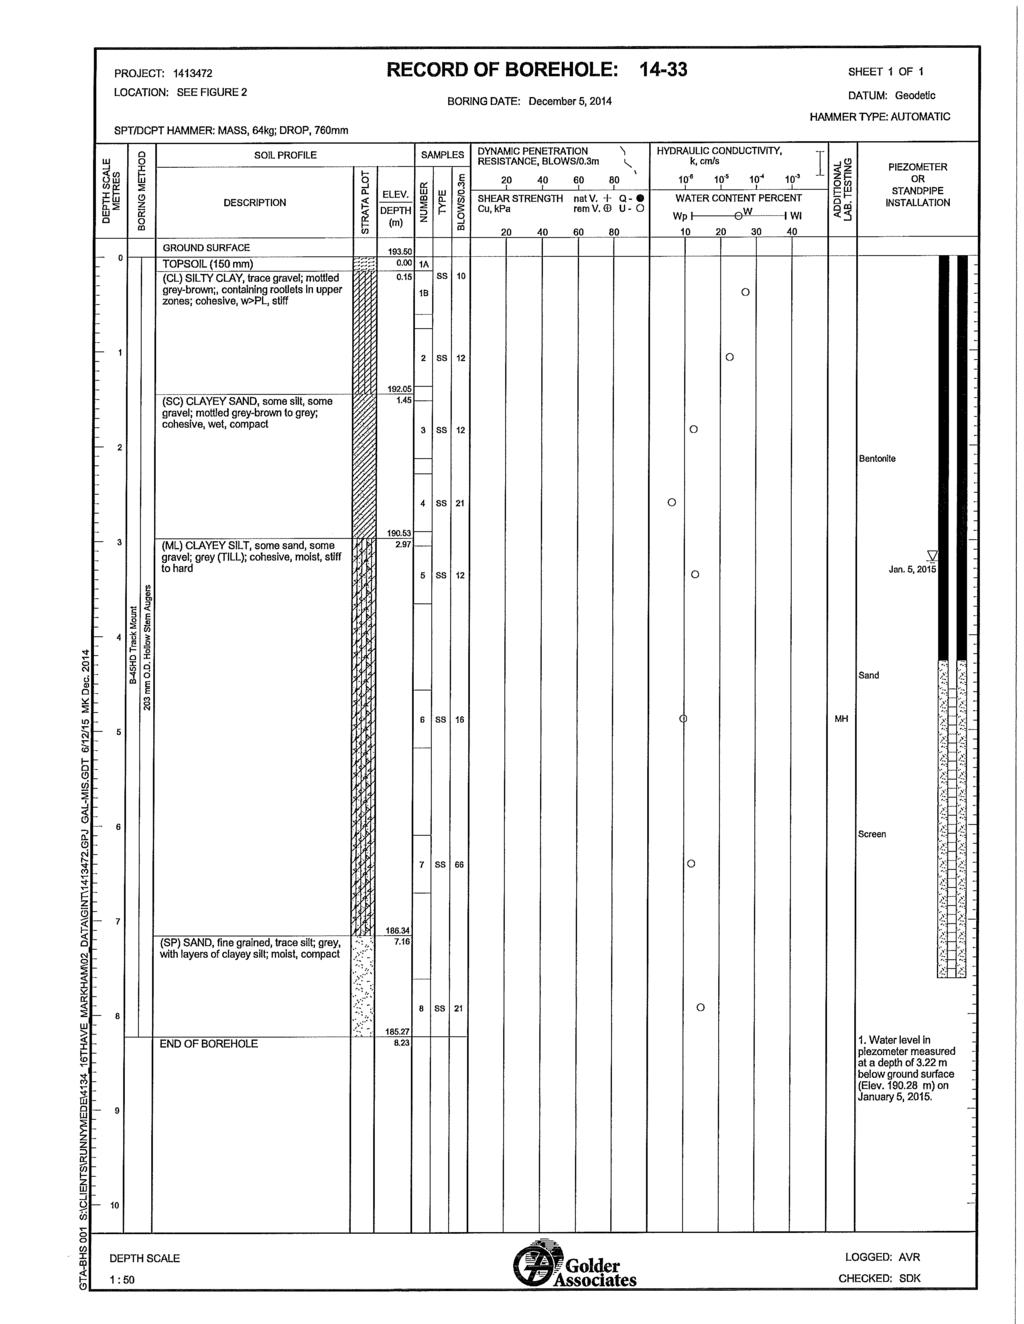
102

103
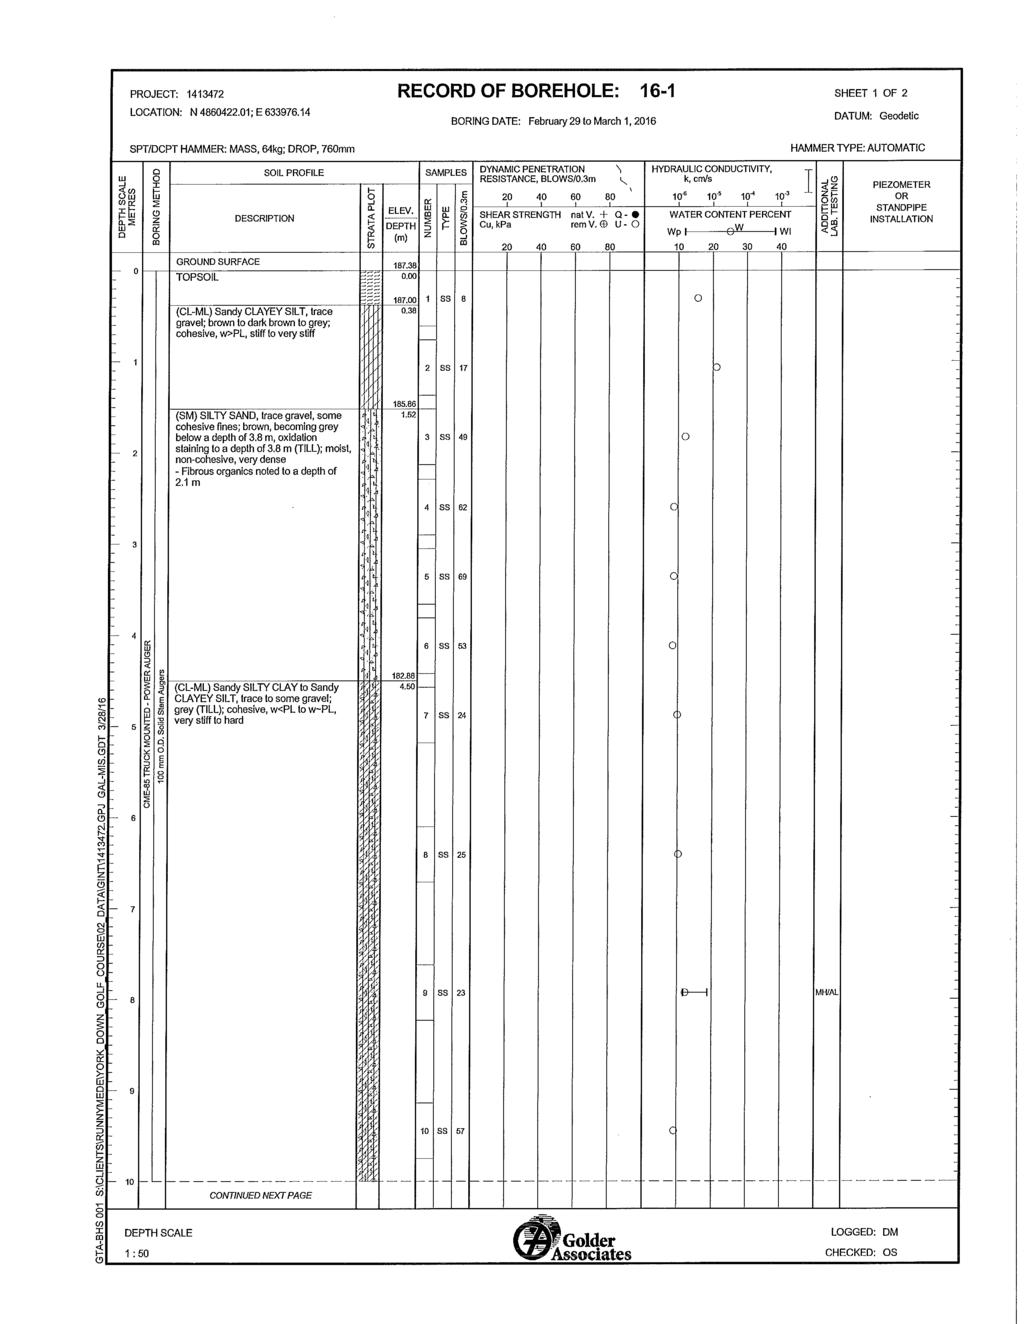
104

105
106
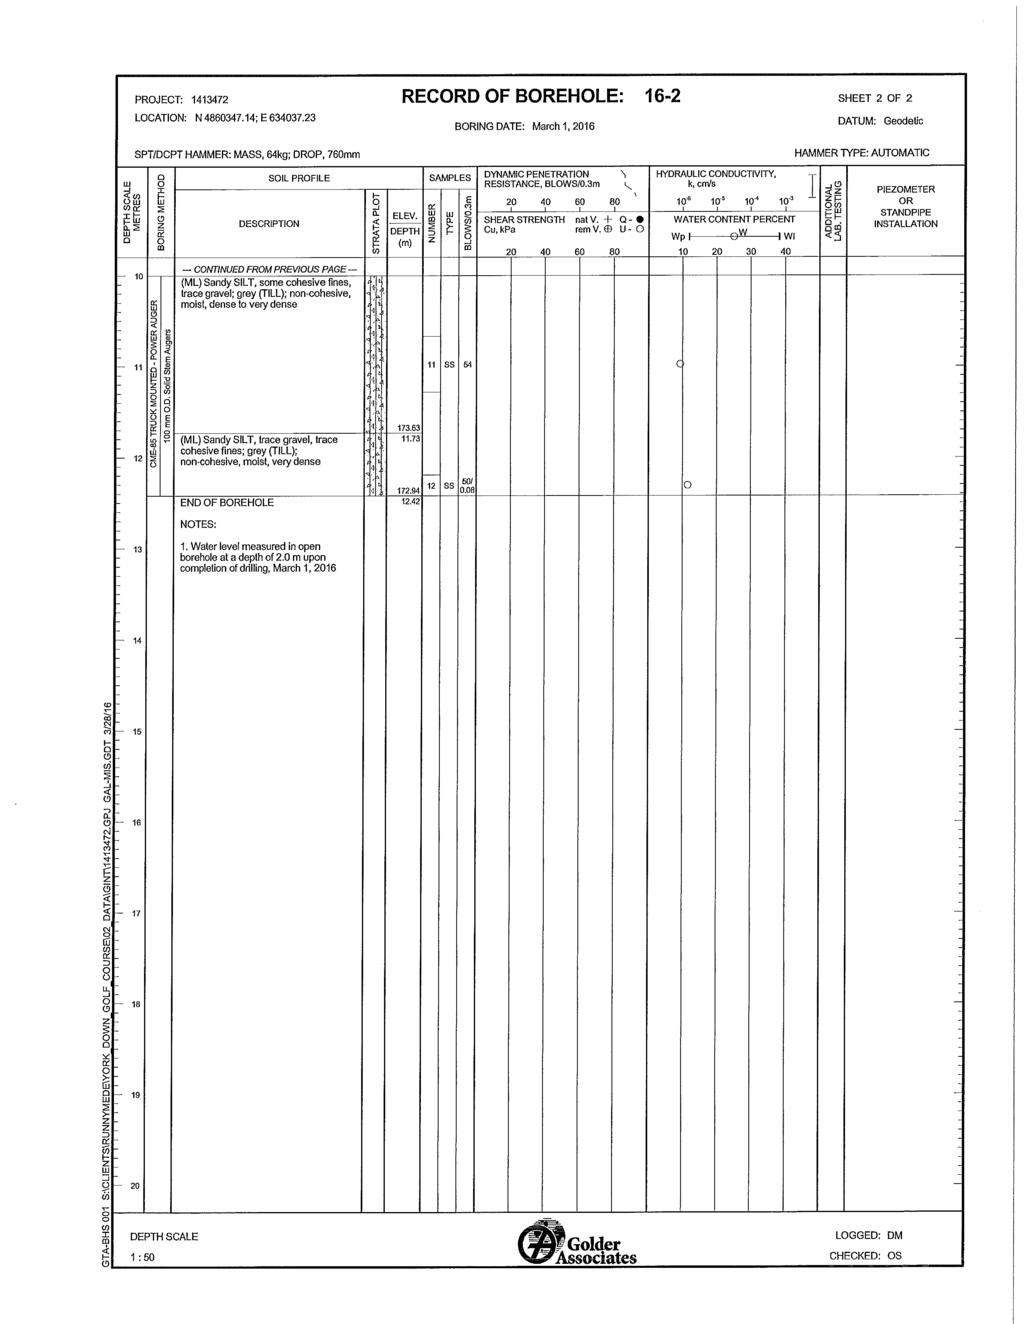
107
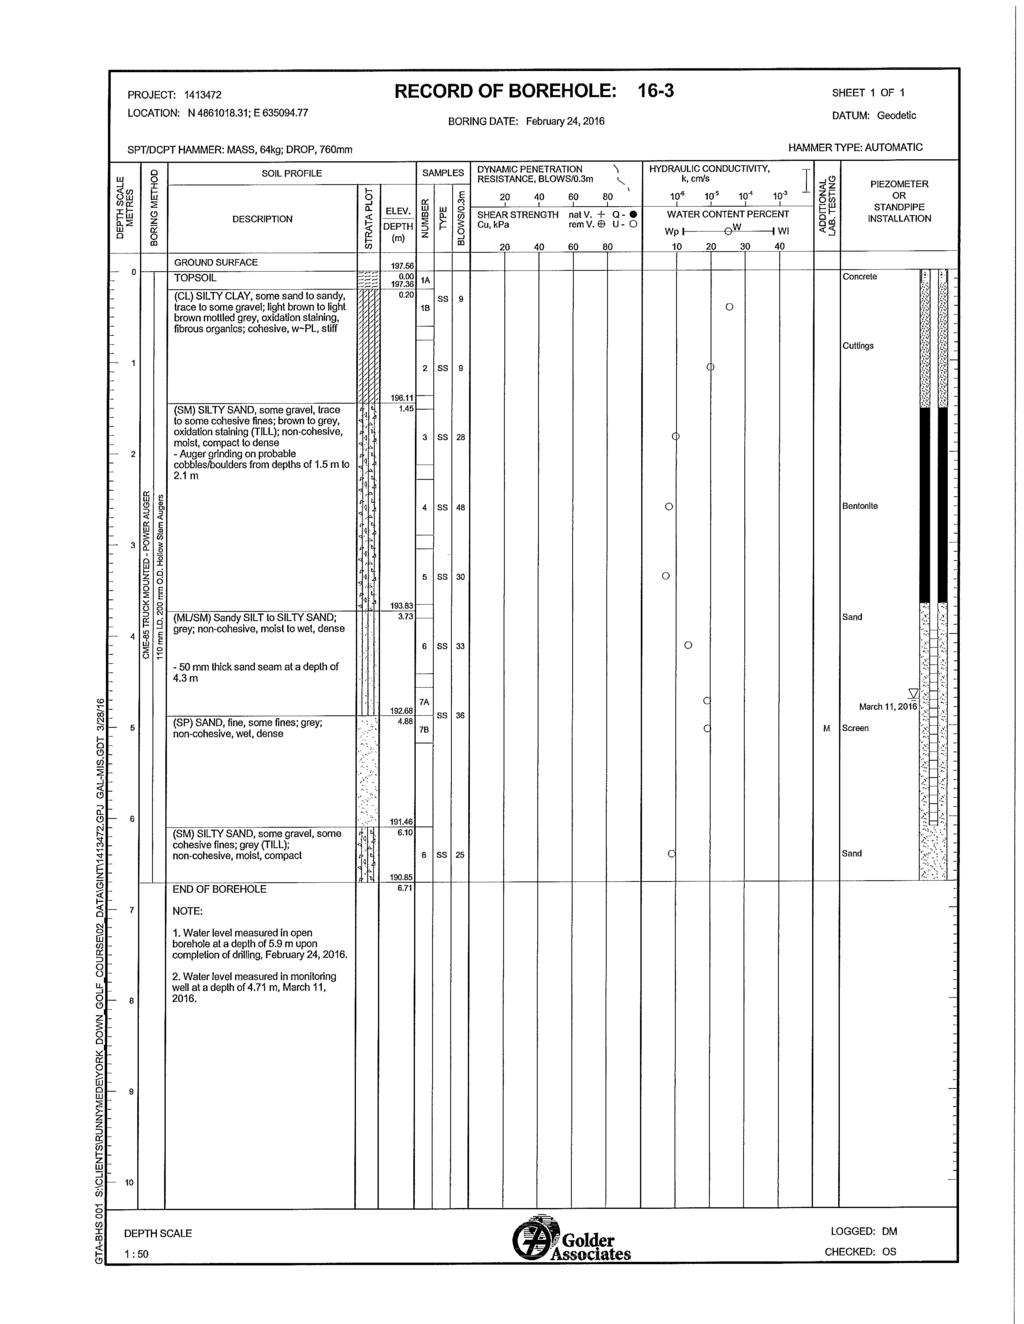
108
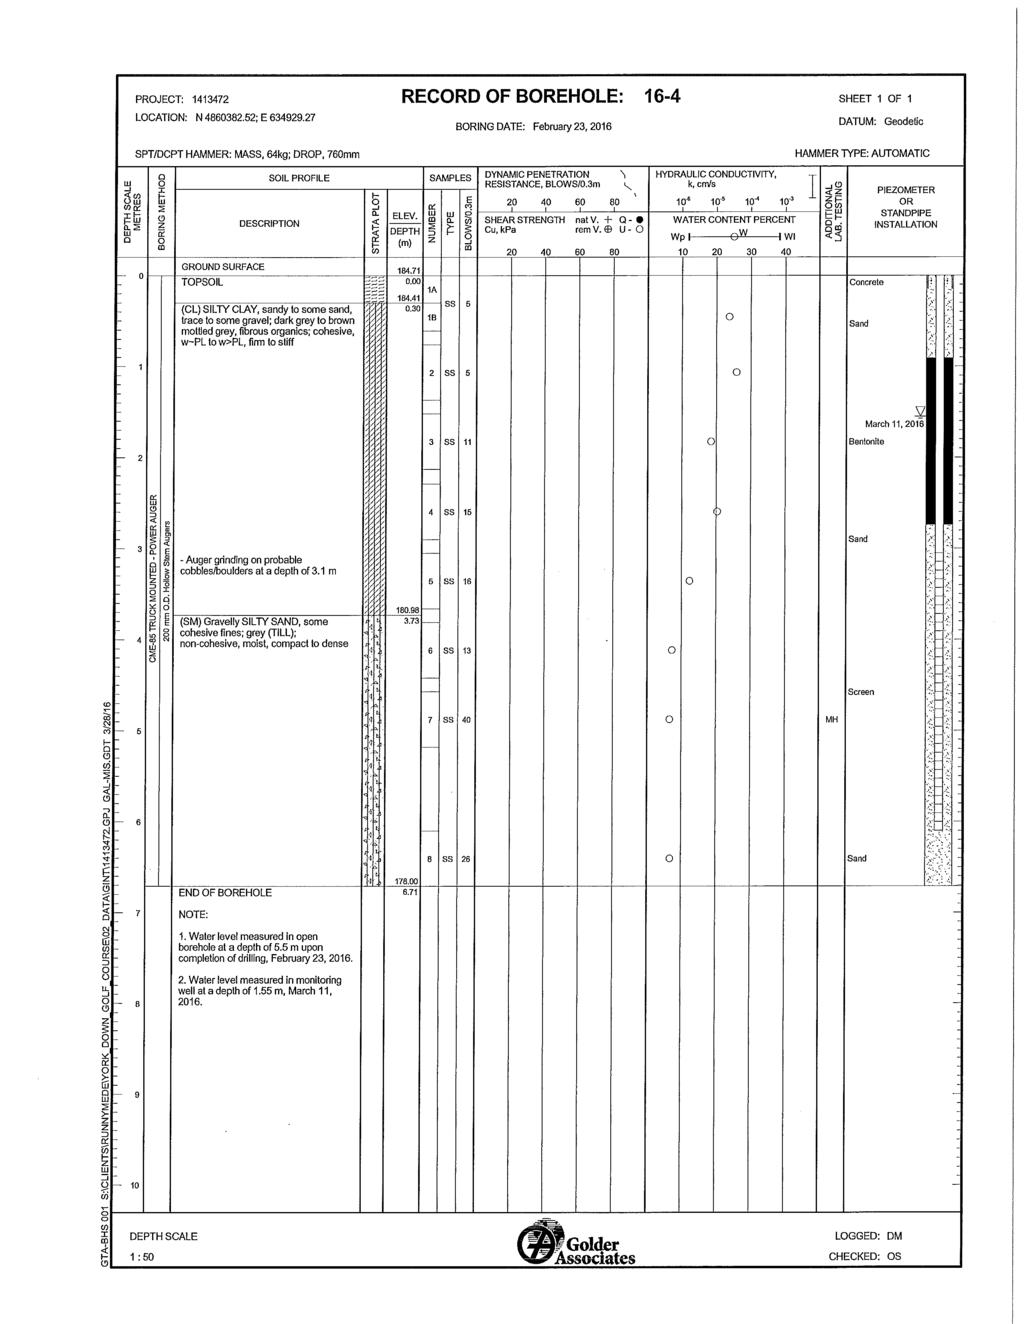
109

110
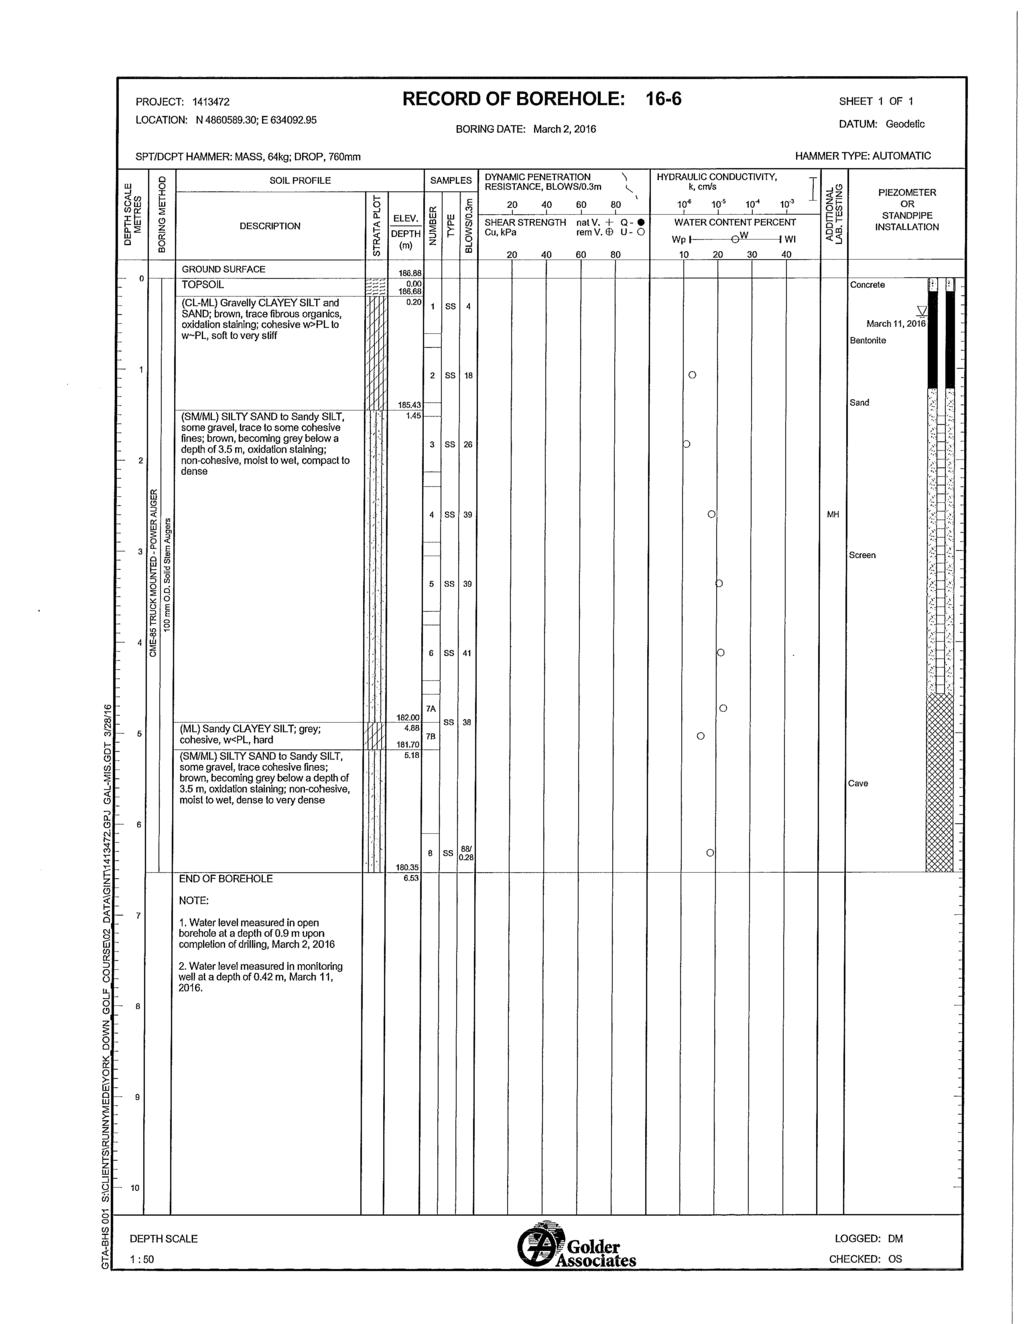
111
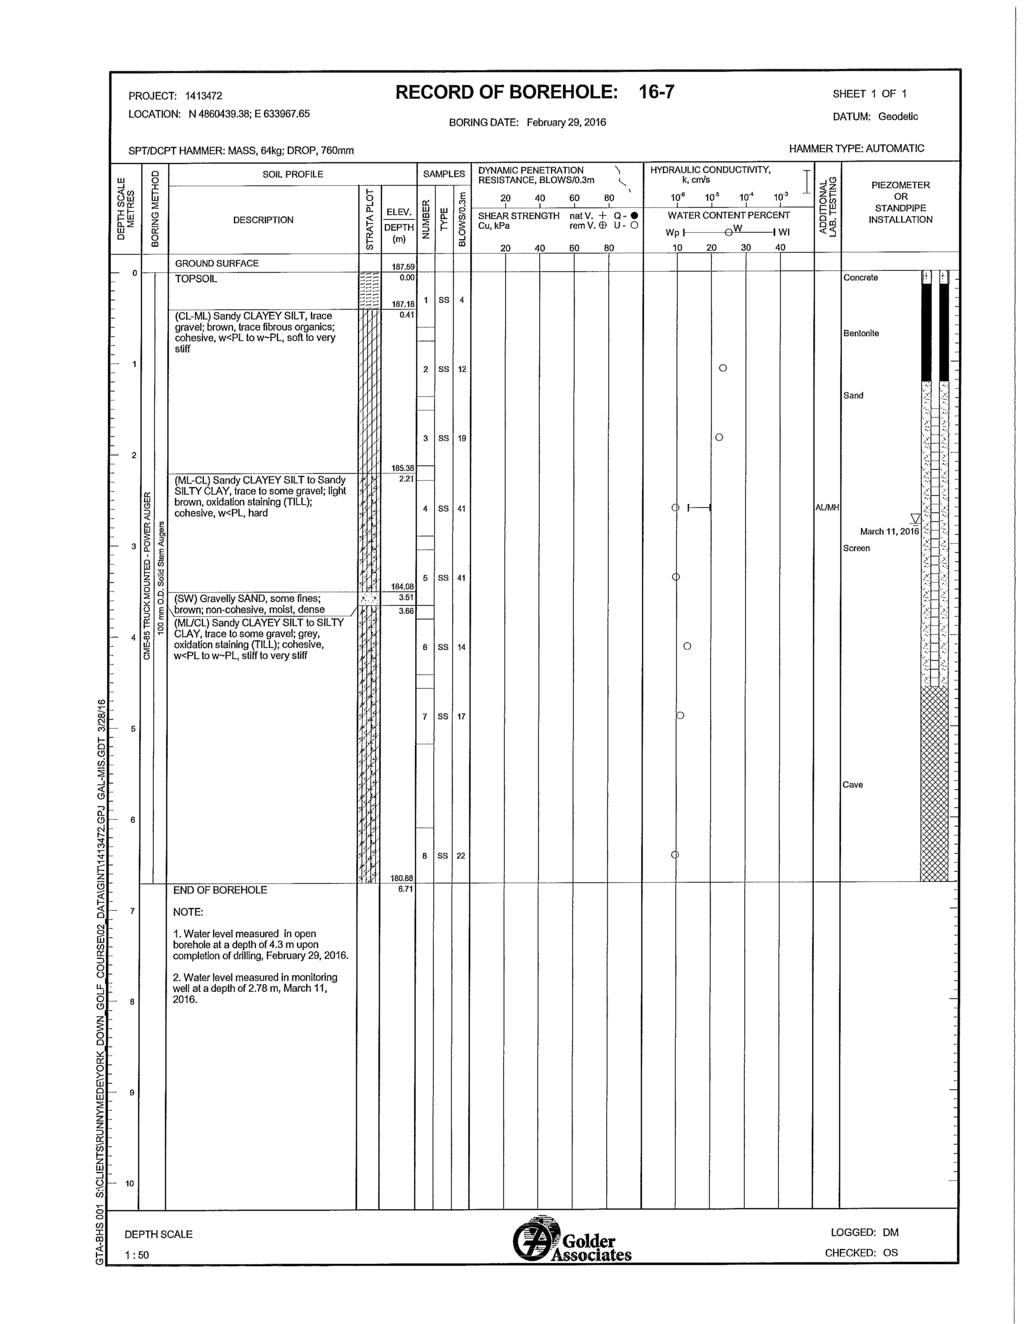
112
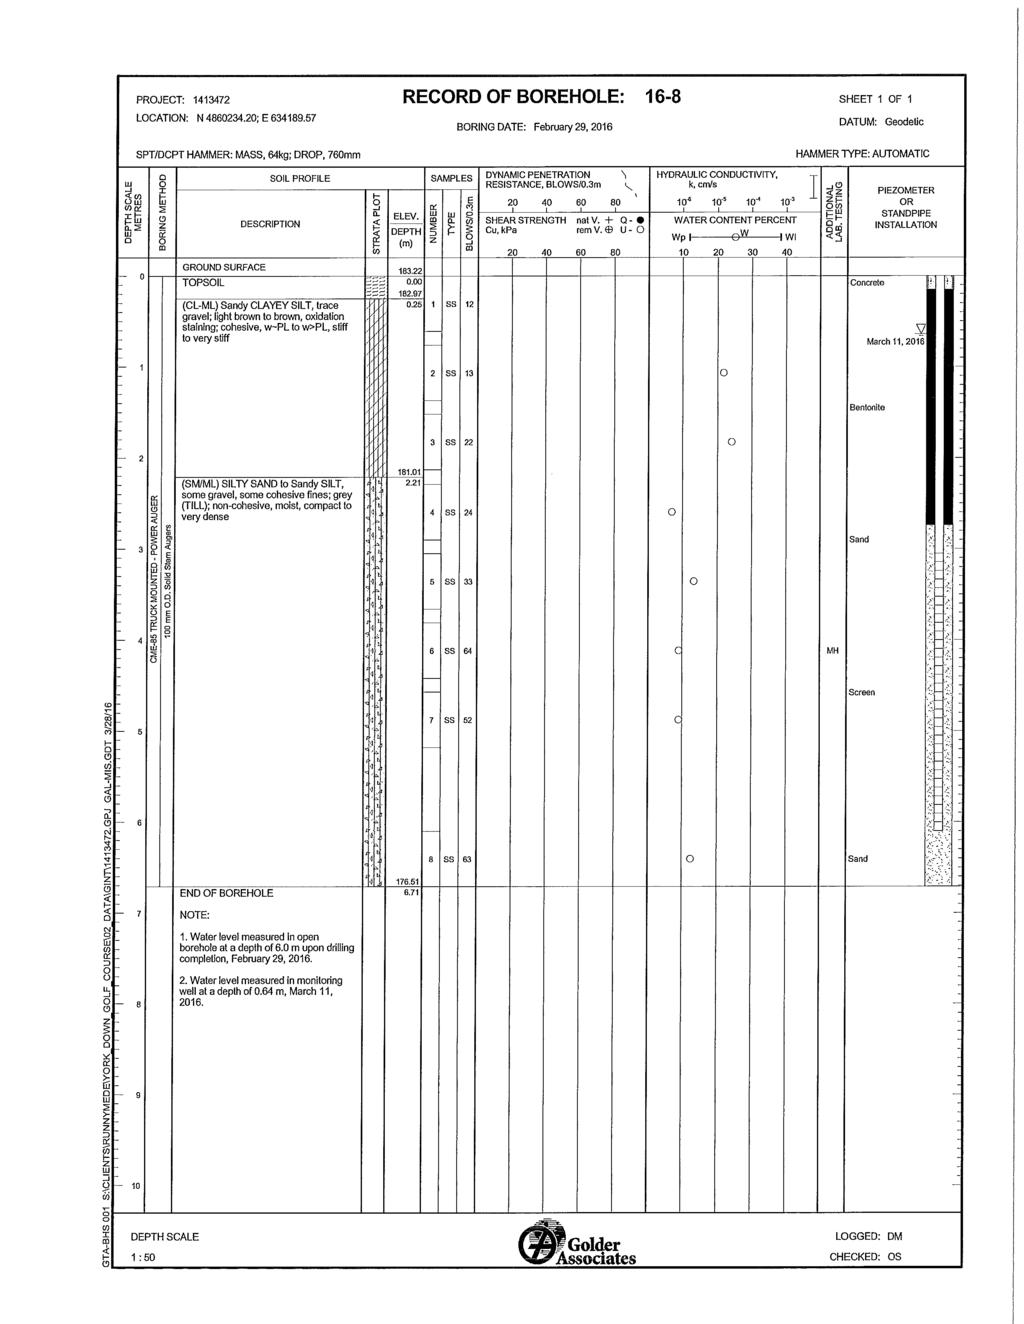
113
114
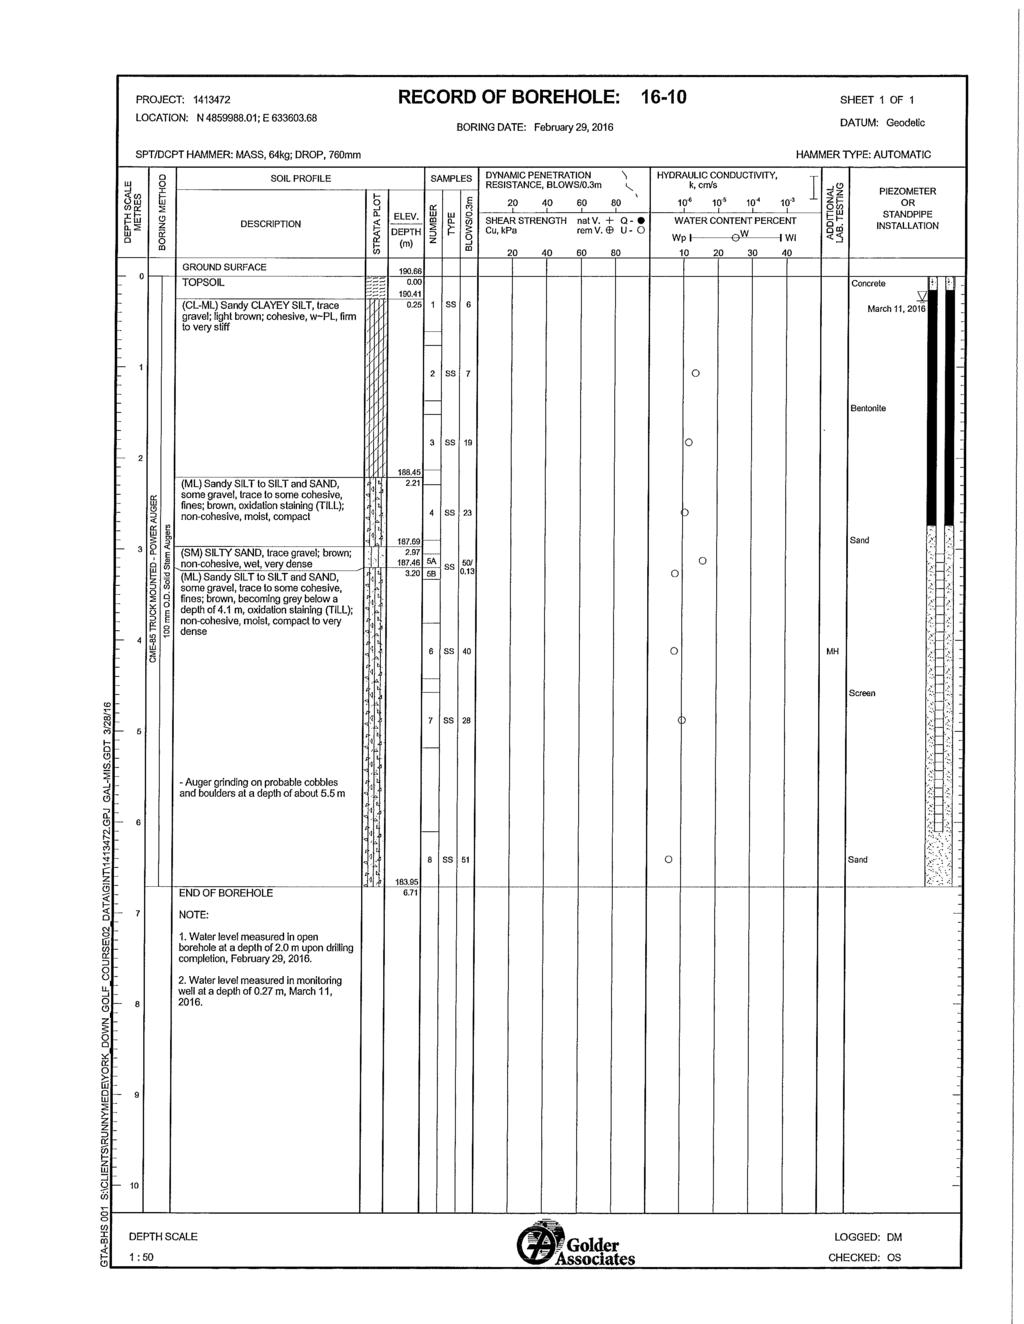
115

116

117
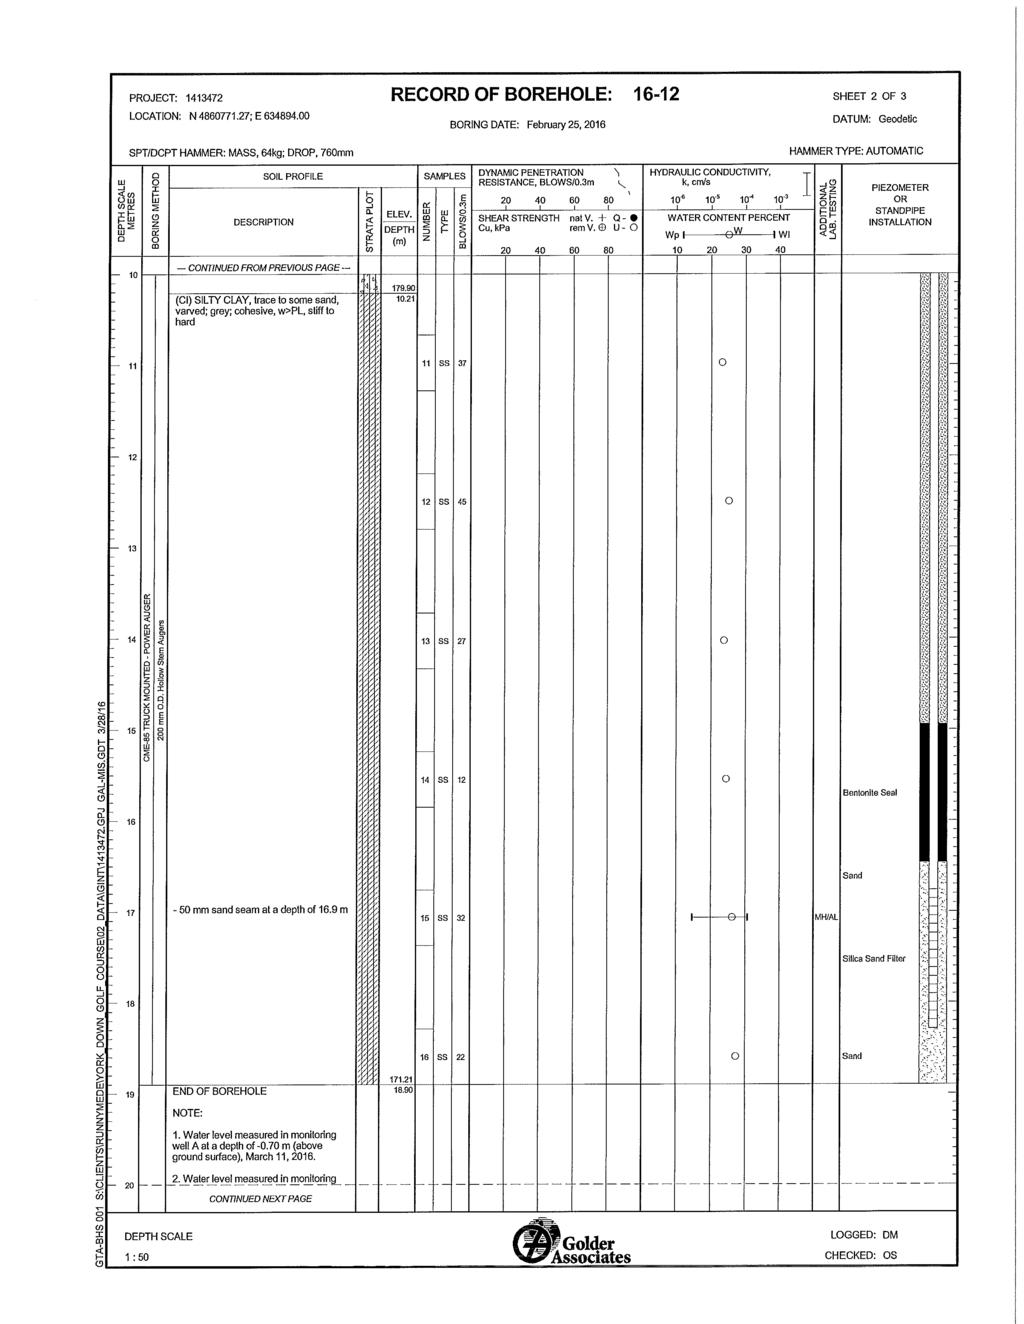
118
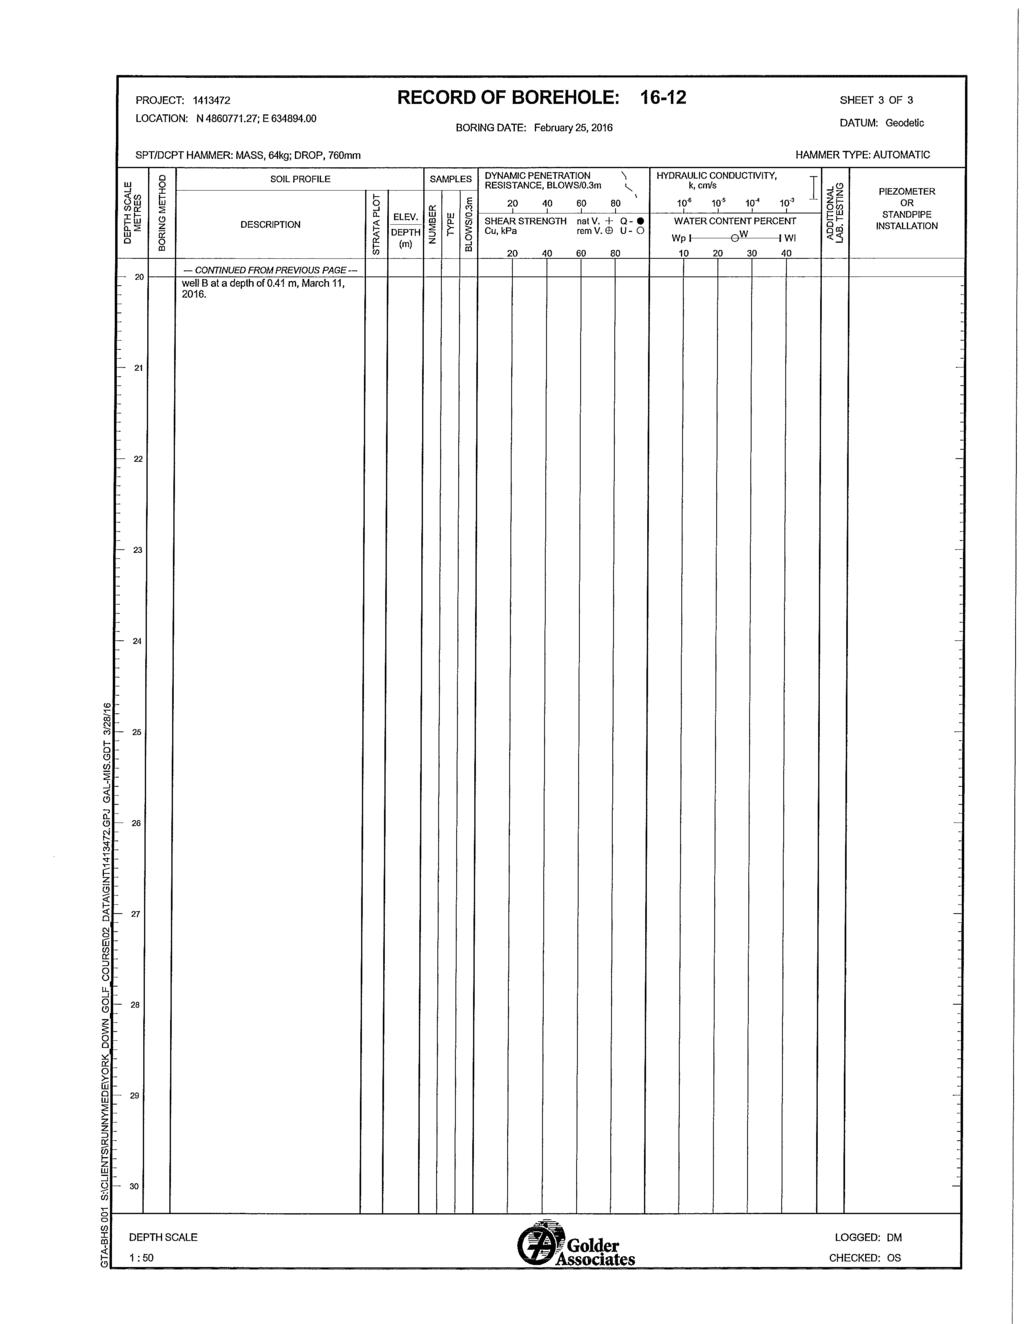
119
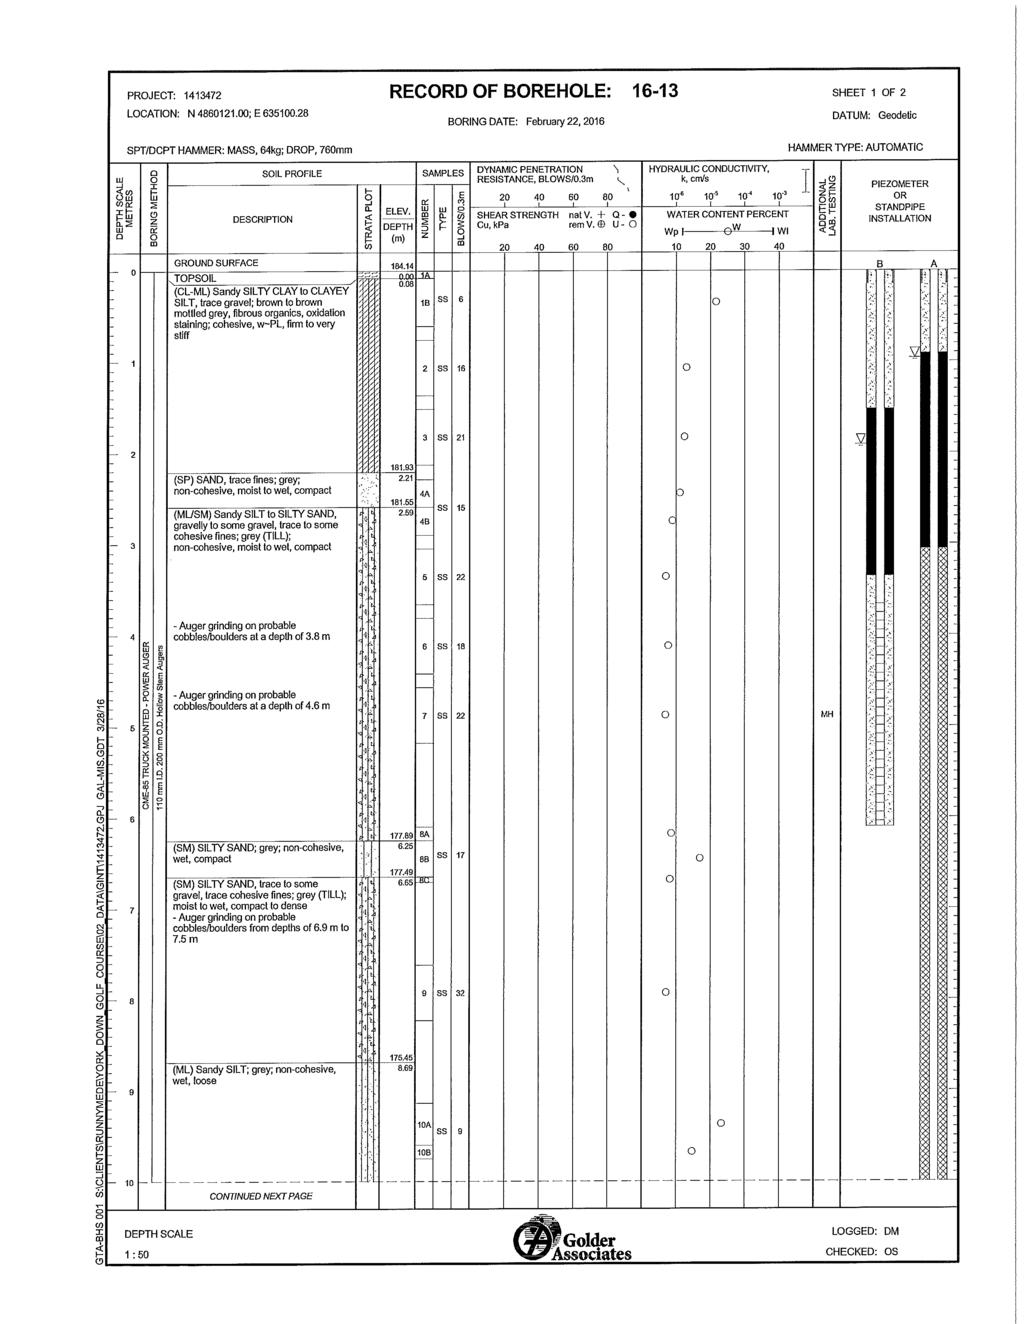
120
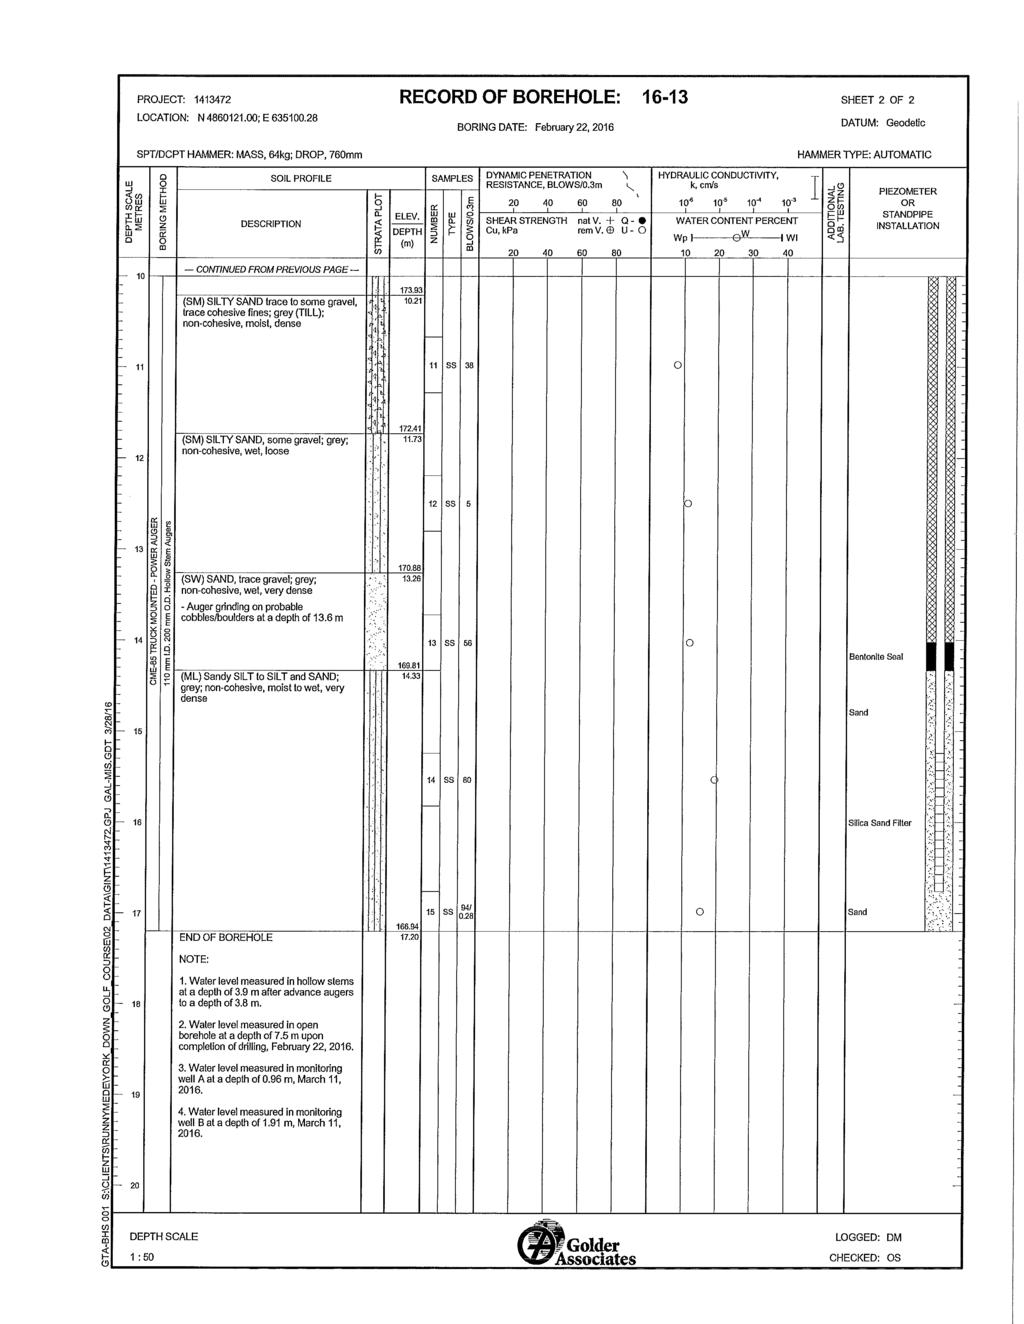
121
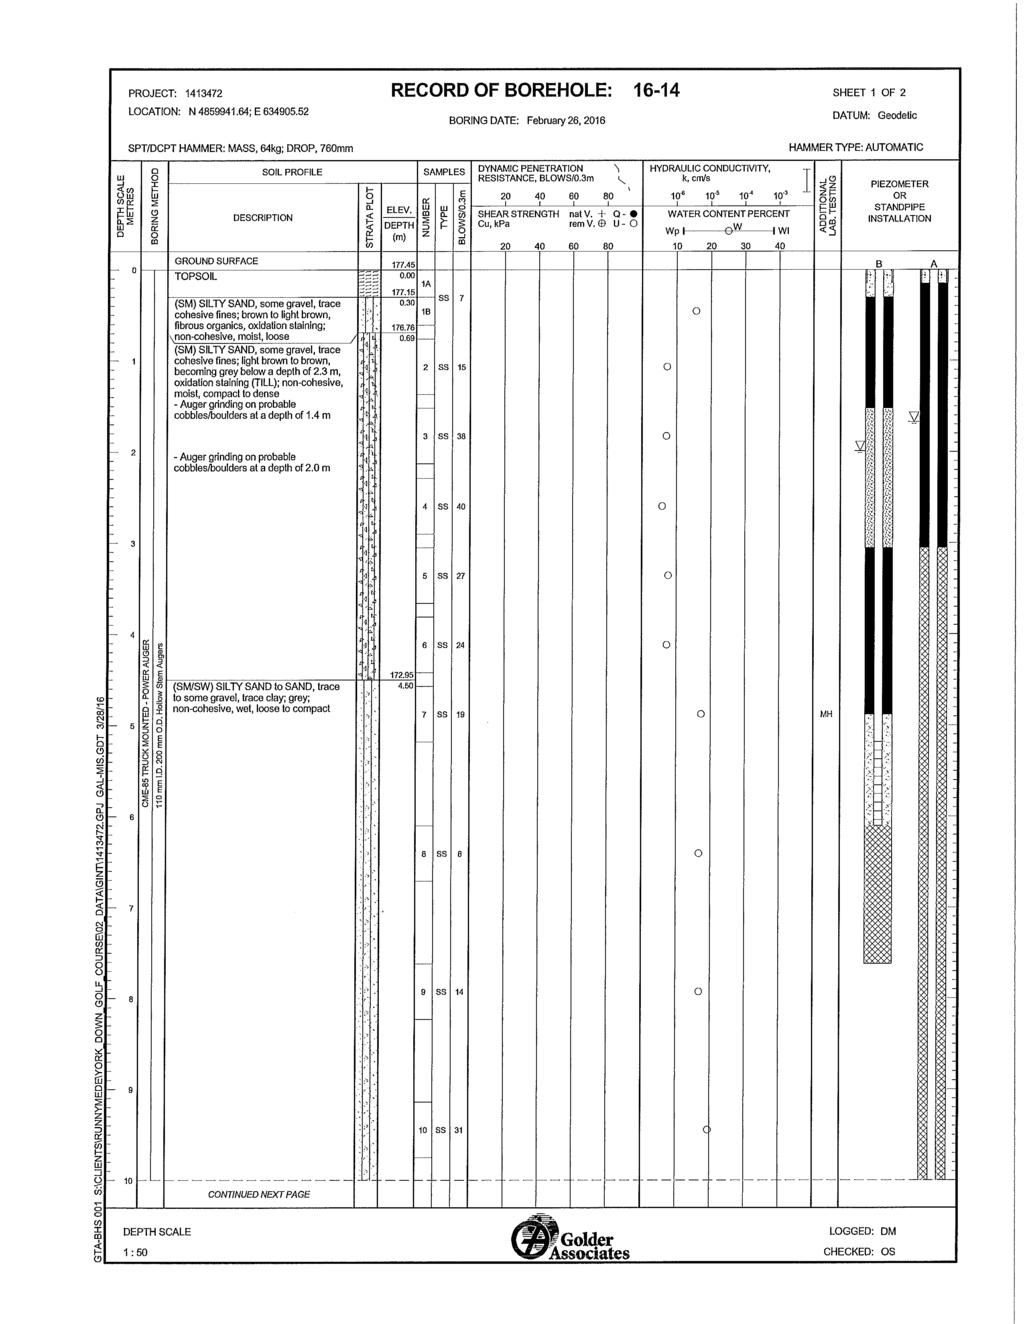
122

123
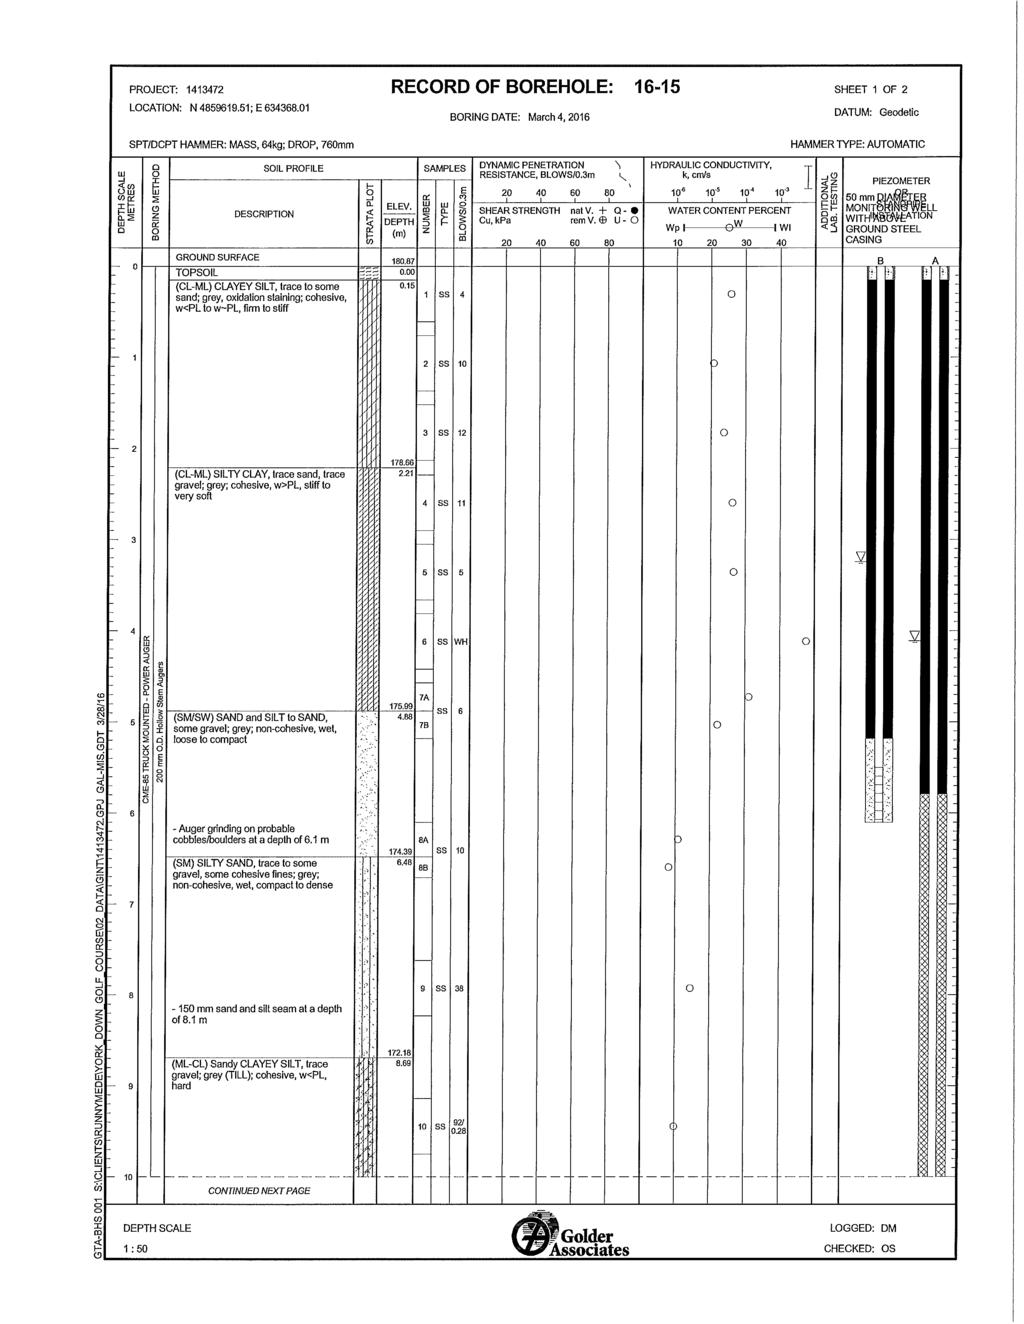
124
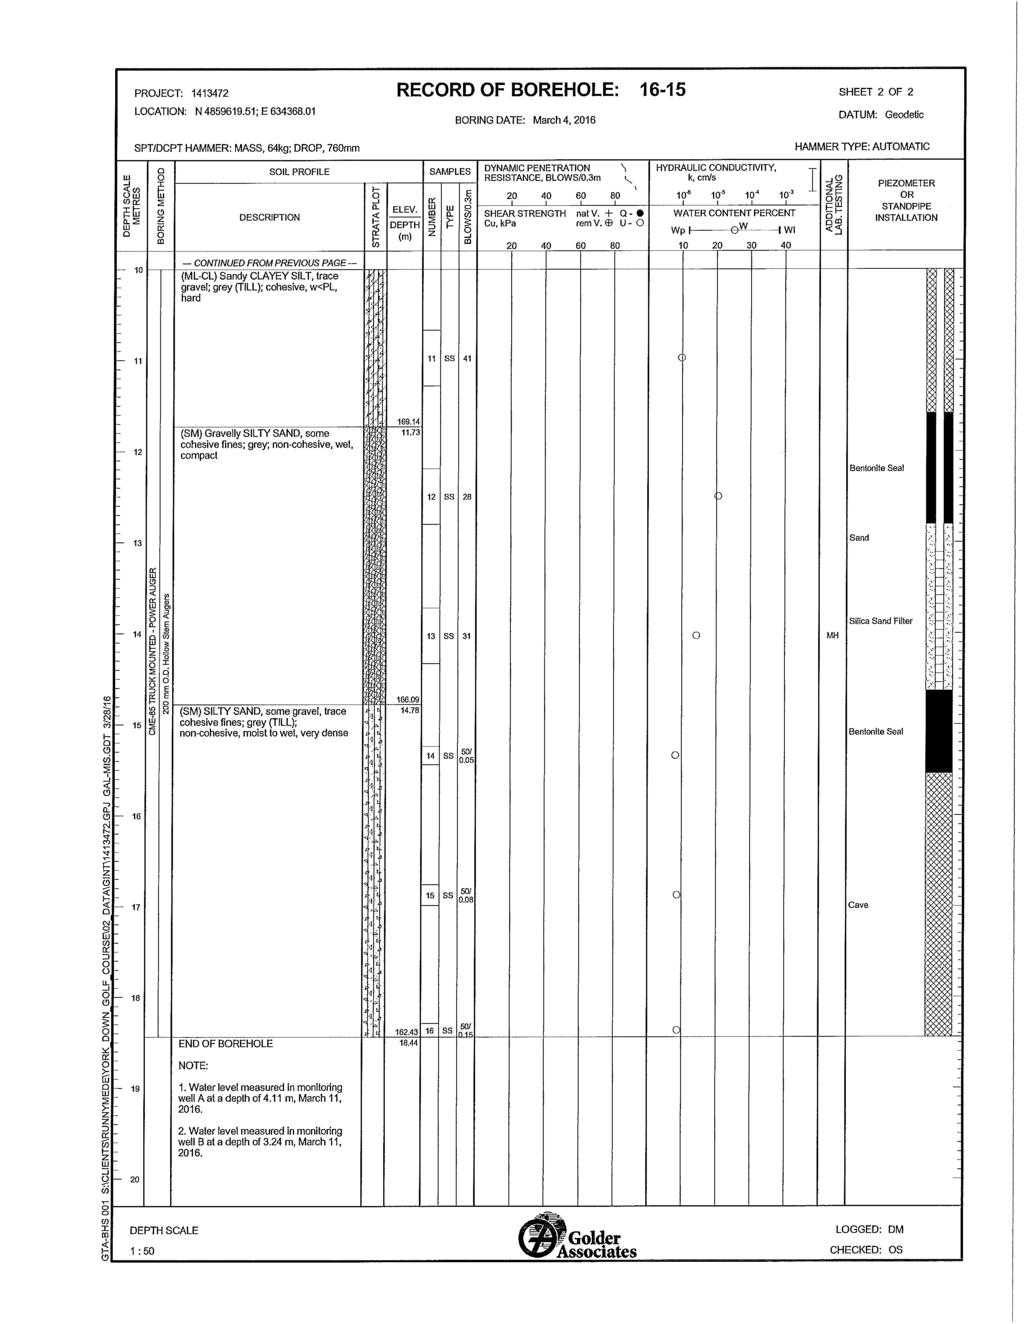
125

126
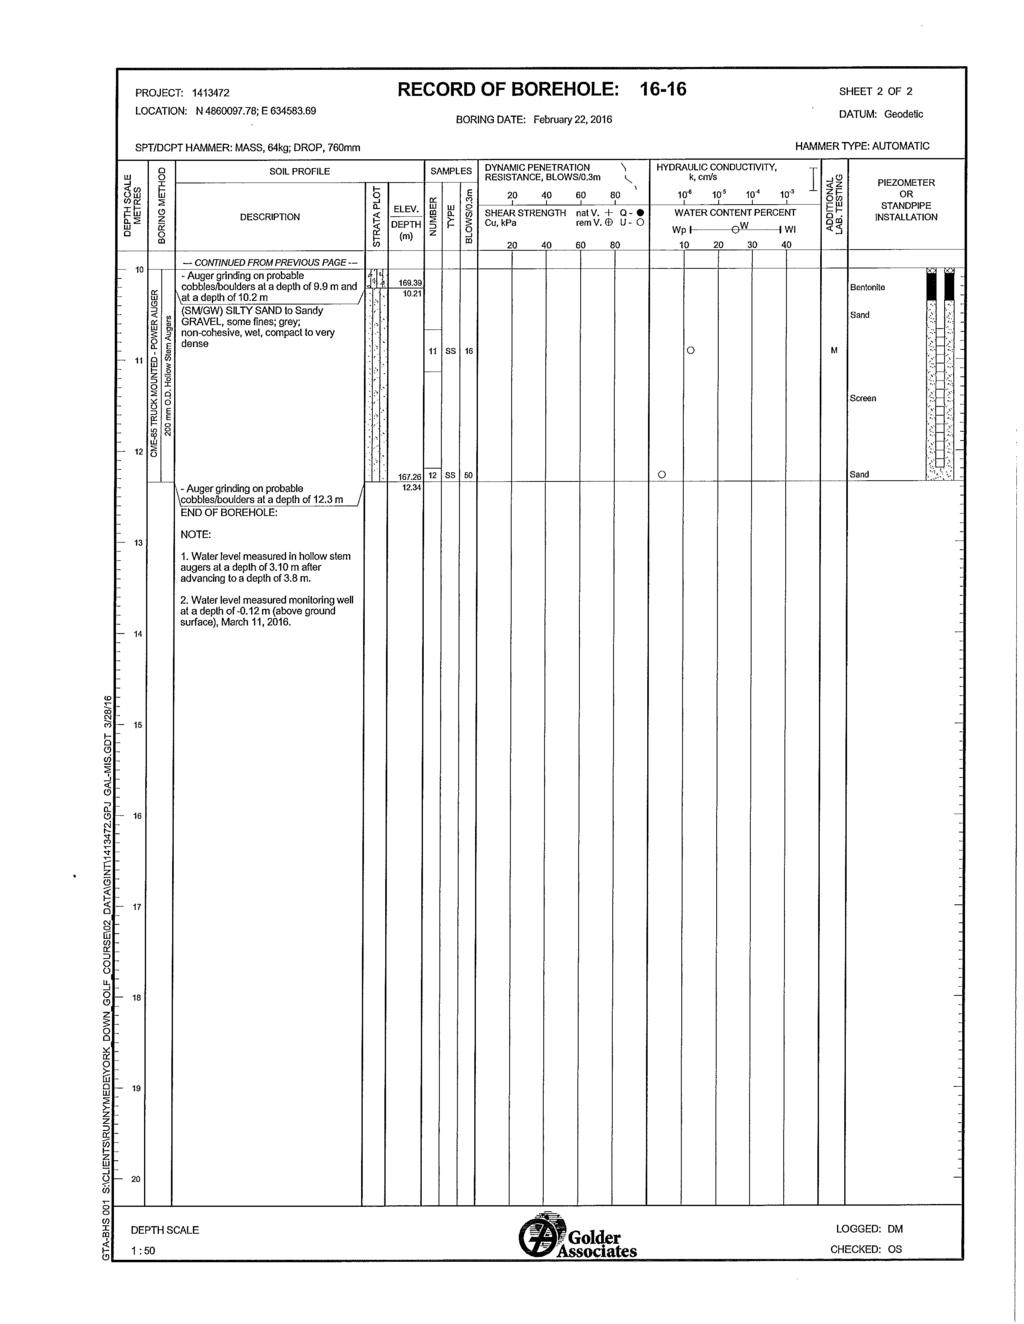
127
128 Appendix C Grain-Size Analyses Appendix C
129 TABLE C-1: th Avenue, Markham Summary of Grain-size Analyses Sediment Sample Estimated K (cm/s) Borehole Depth Elevation Sample Description Geometric No. d 10 (mm) Sample (m) (masl) Mean <0.001 Silty Clay < <0.001 Silty Clay <0.001 < <0.001 Silty Clay < <0.001 Sandy, Clayey Silt, trace sand (Till) < <0.001 sandy Silty Clay to sandy Clayey Silt (Till) < <0.001 sandy Silty Clay to sandy Clayey Silt (Till) < <0.001 sandy Silty Clay to sandy Clayey Silt (Till) < E Clayey Silt, some sand, trace gravel (Till-like) 2.0E Clayey Sand Till 2.3E Silt, trace clay, some sand 2.2E Silty Sand, some sand, trace clay (Till) 2.3E Silty Sand Till 6.3E Silty Sand Till 2.5E Silty Sand (Till) 2.0E Silty Sand (Till) 1.0E E Silty Sand (Till) 4.0E sandy Silt (Till) 1.0E sandy Silt (Till) 1.0E sandy Silt 2.0E Silty Sand, fine grained sand, trace clay 2.6E Silty Sand 2.0E Silty Sand 1.2E Silty Sand 1.8E Silty Sand 3.4E E Sand 8.3E B Sand 6.1E Sand 2.1E-03 Notes: m - metres masl - metres above sea level NA - Not applicable Borehole locations are shown in Figure 4. K values estimated using the Hazen correlation Grain-size distributions are based on the Unified Soil Classification. D 10 values are from Grain-size analyses or estimated by Burnside Geometric mean values do not include <0.001 values

130

131
132
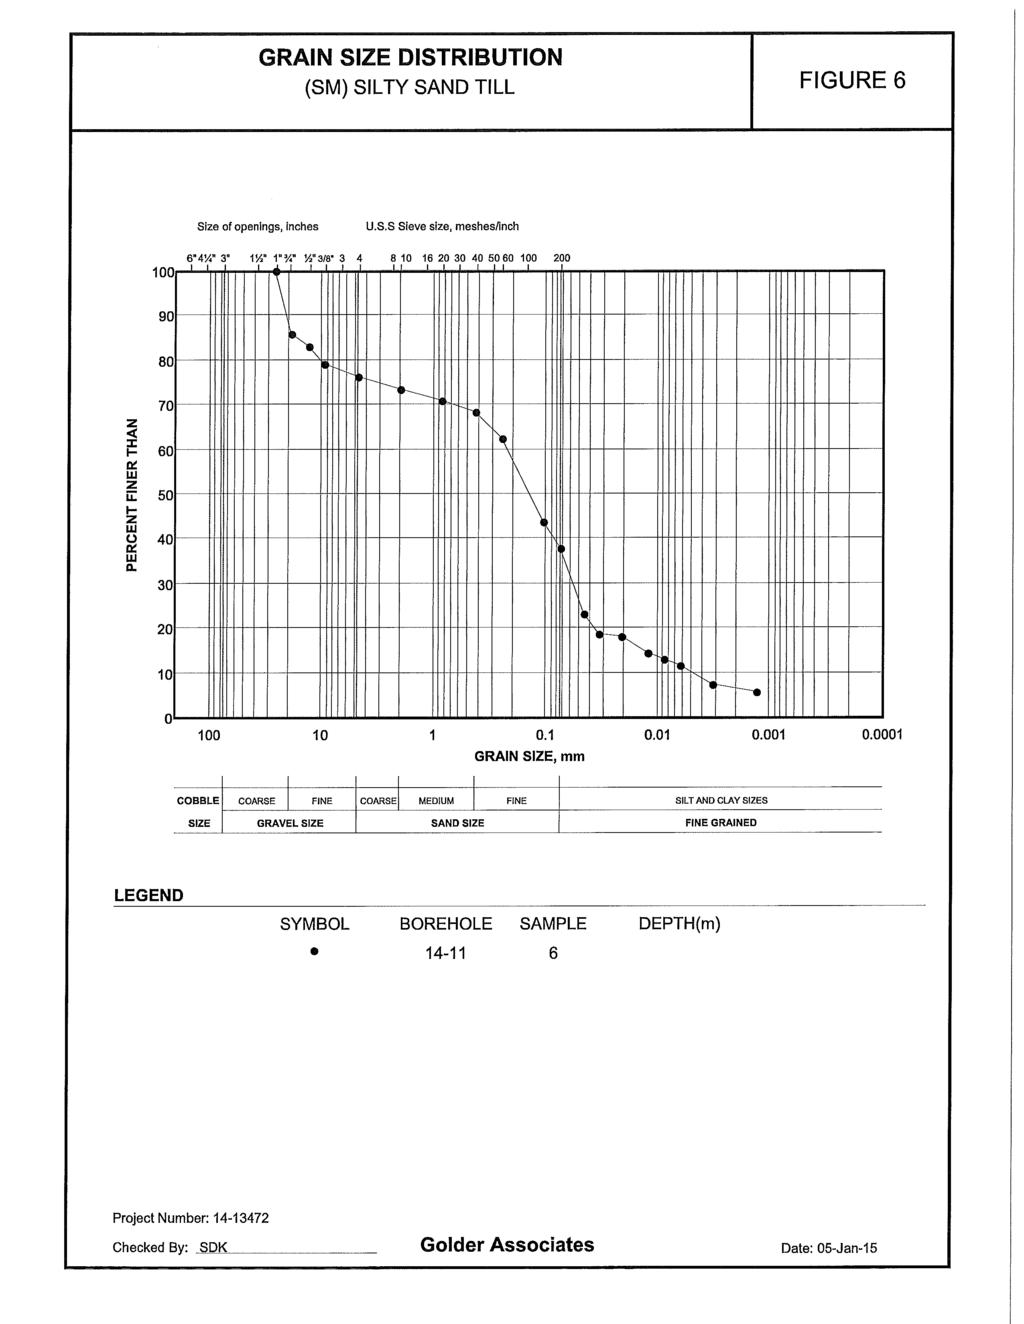
133
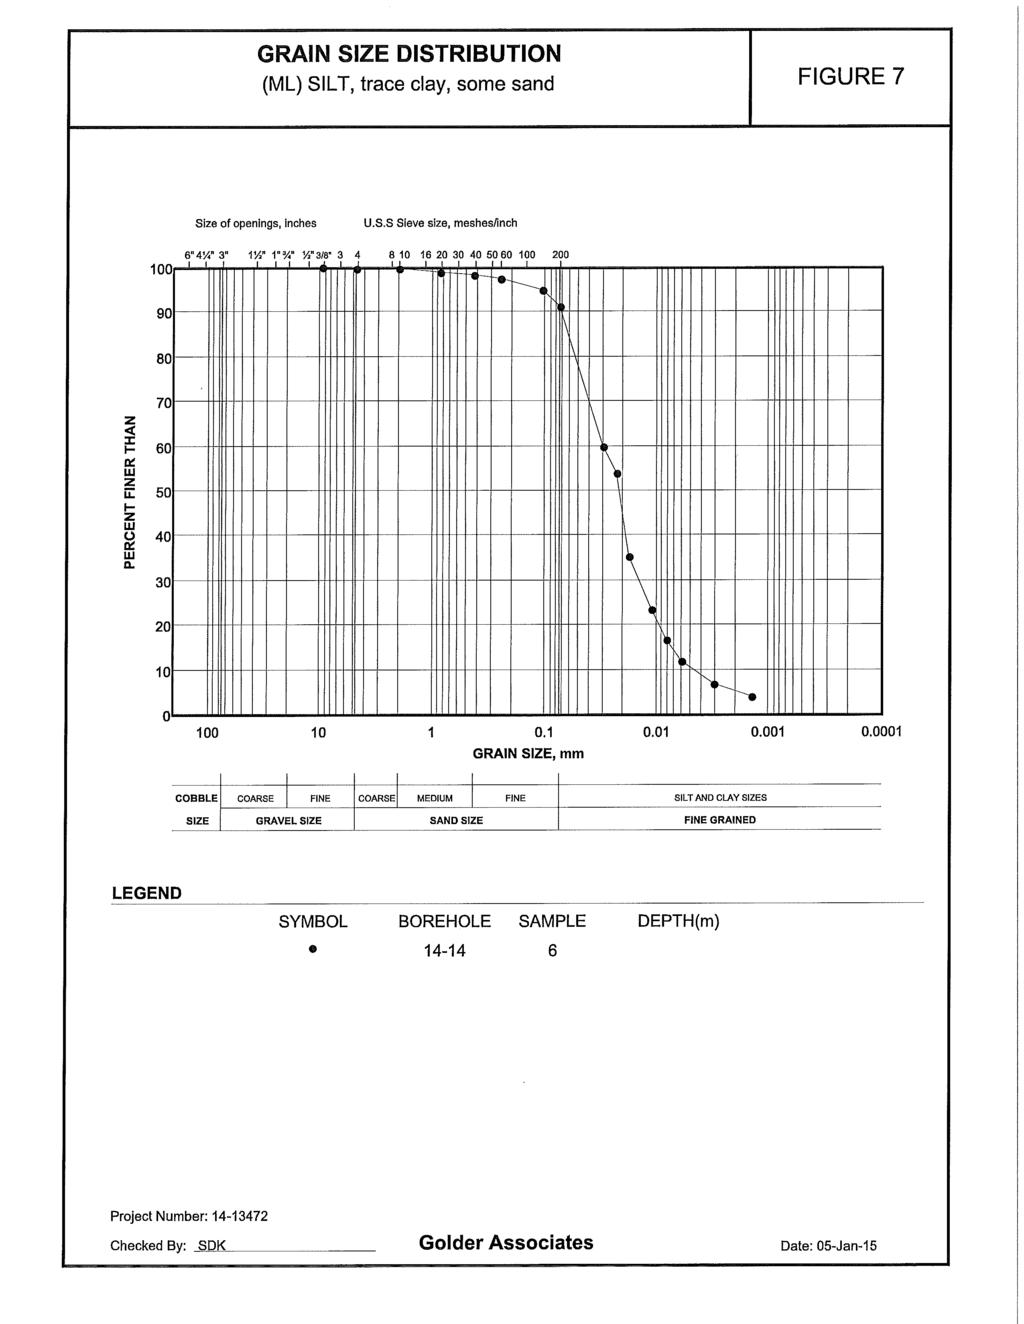
134

135
136
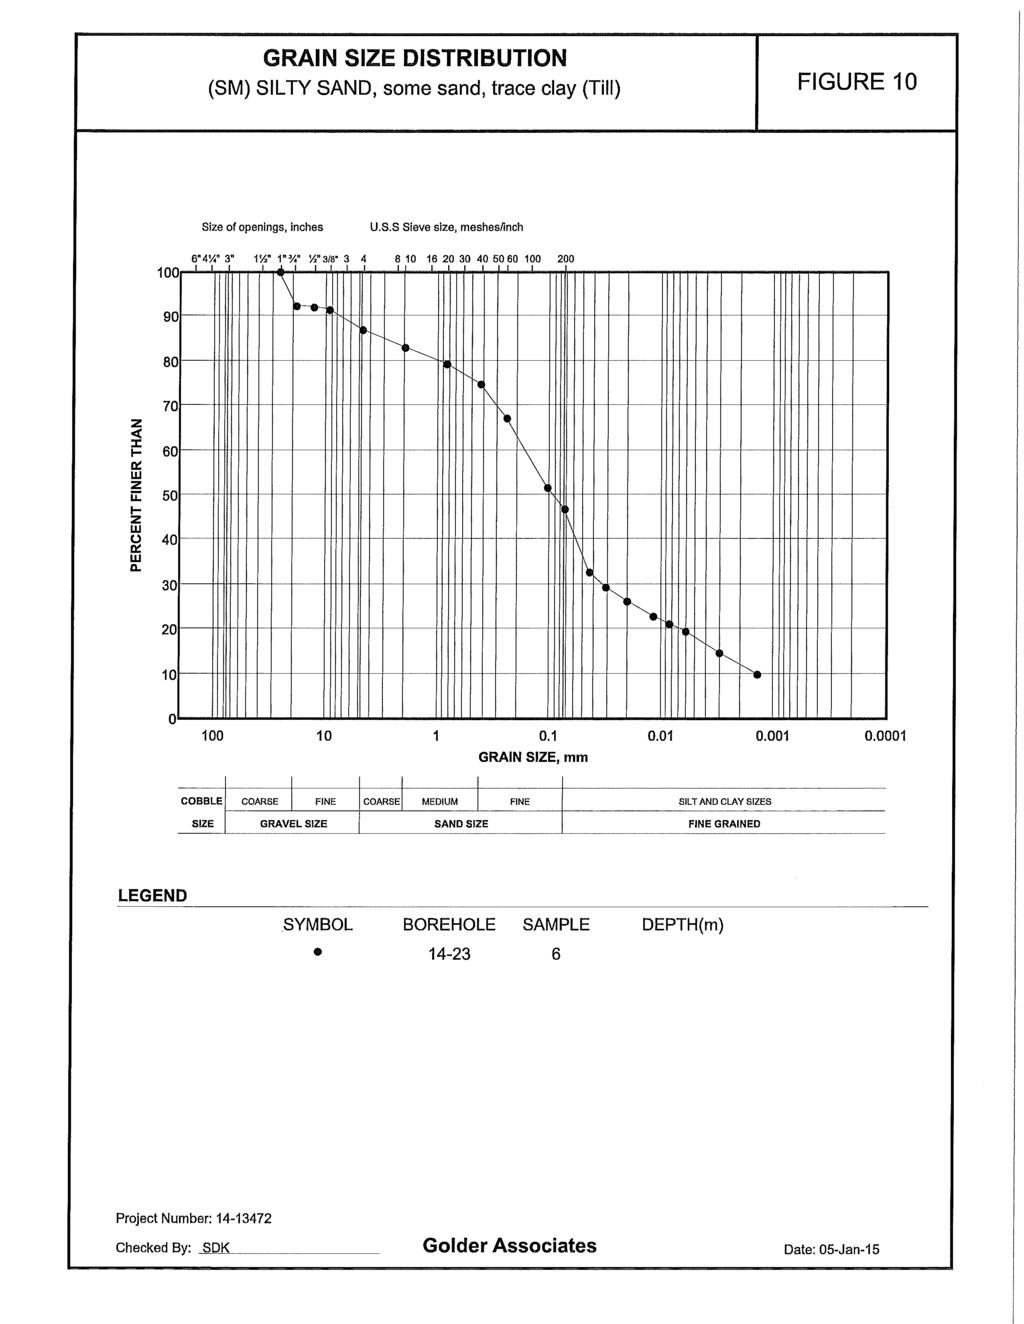
137
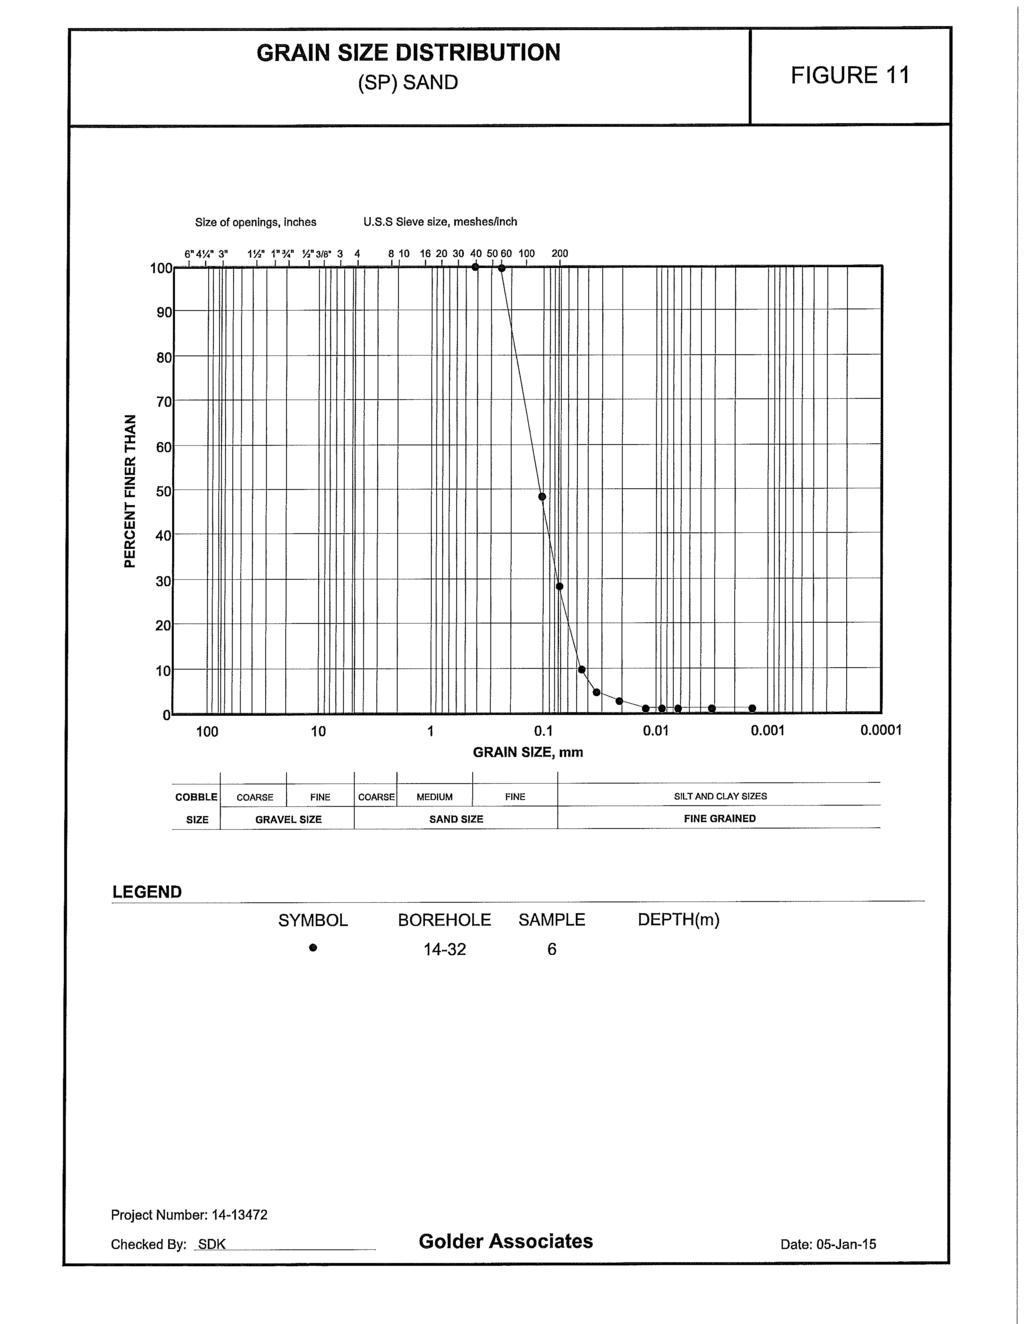
138
139
140
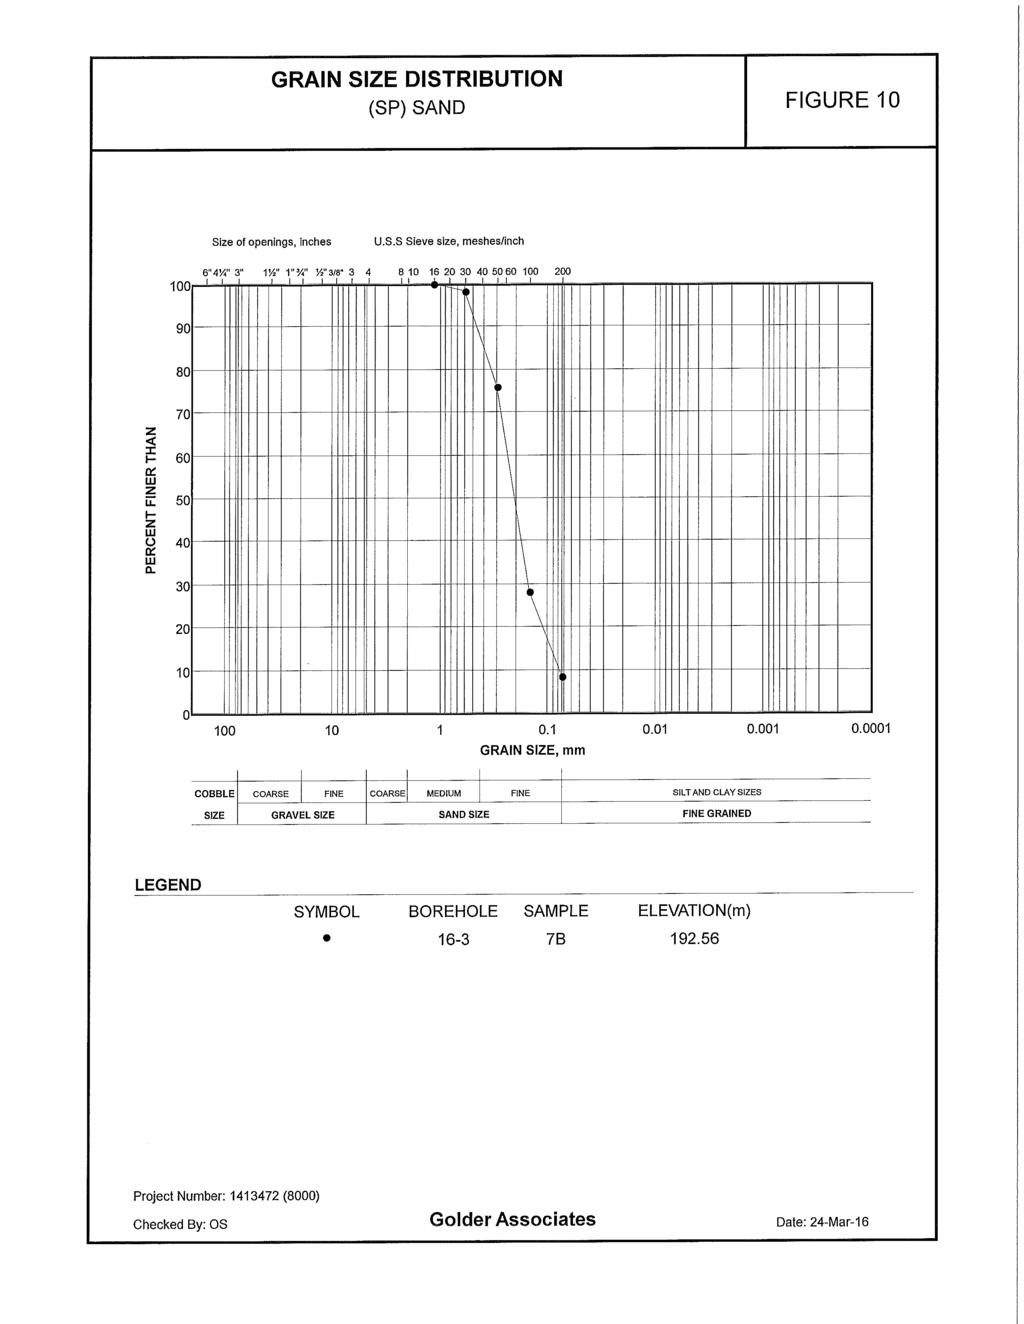
141
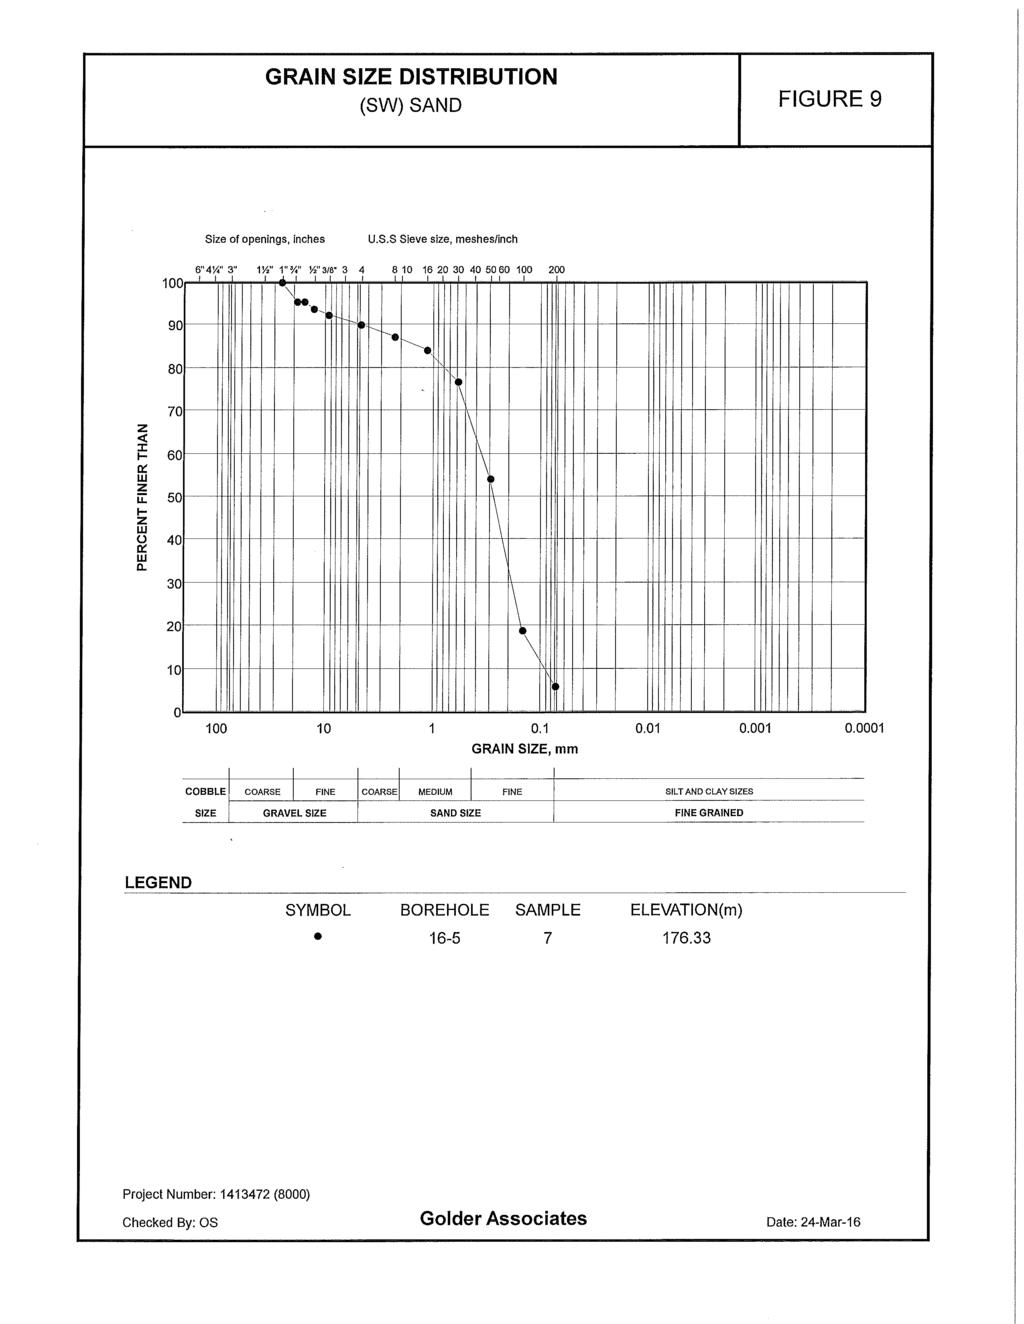
142
143
144
145
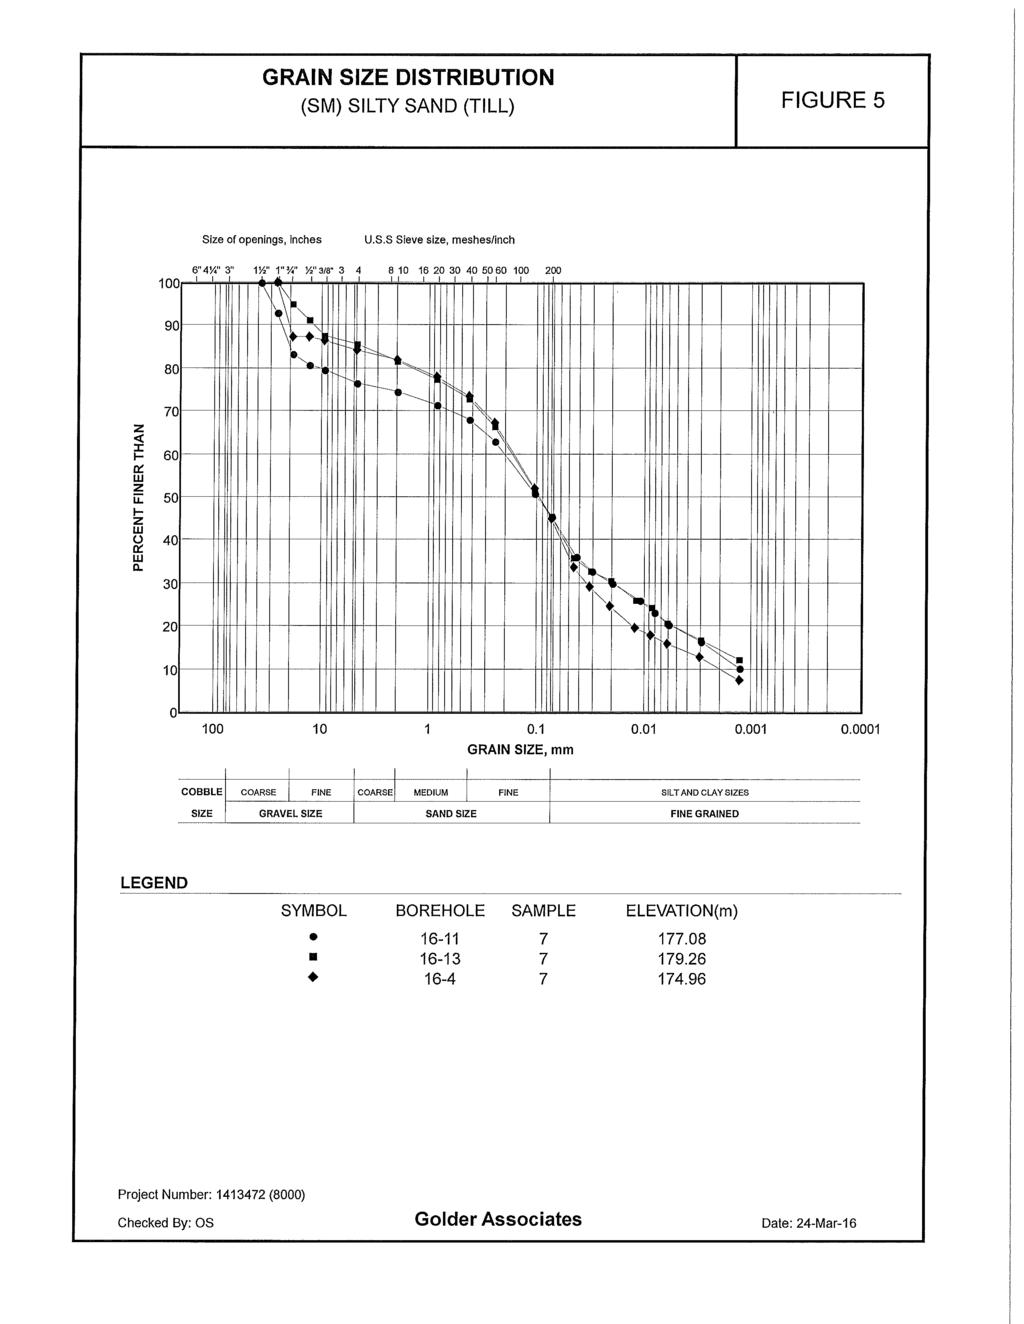
146
147
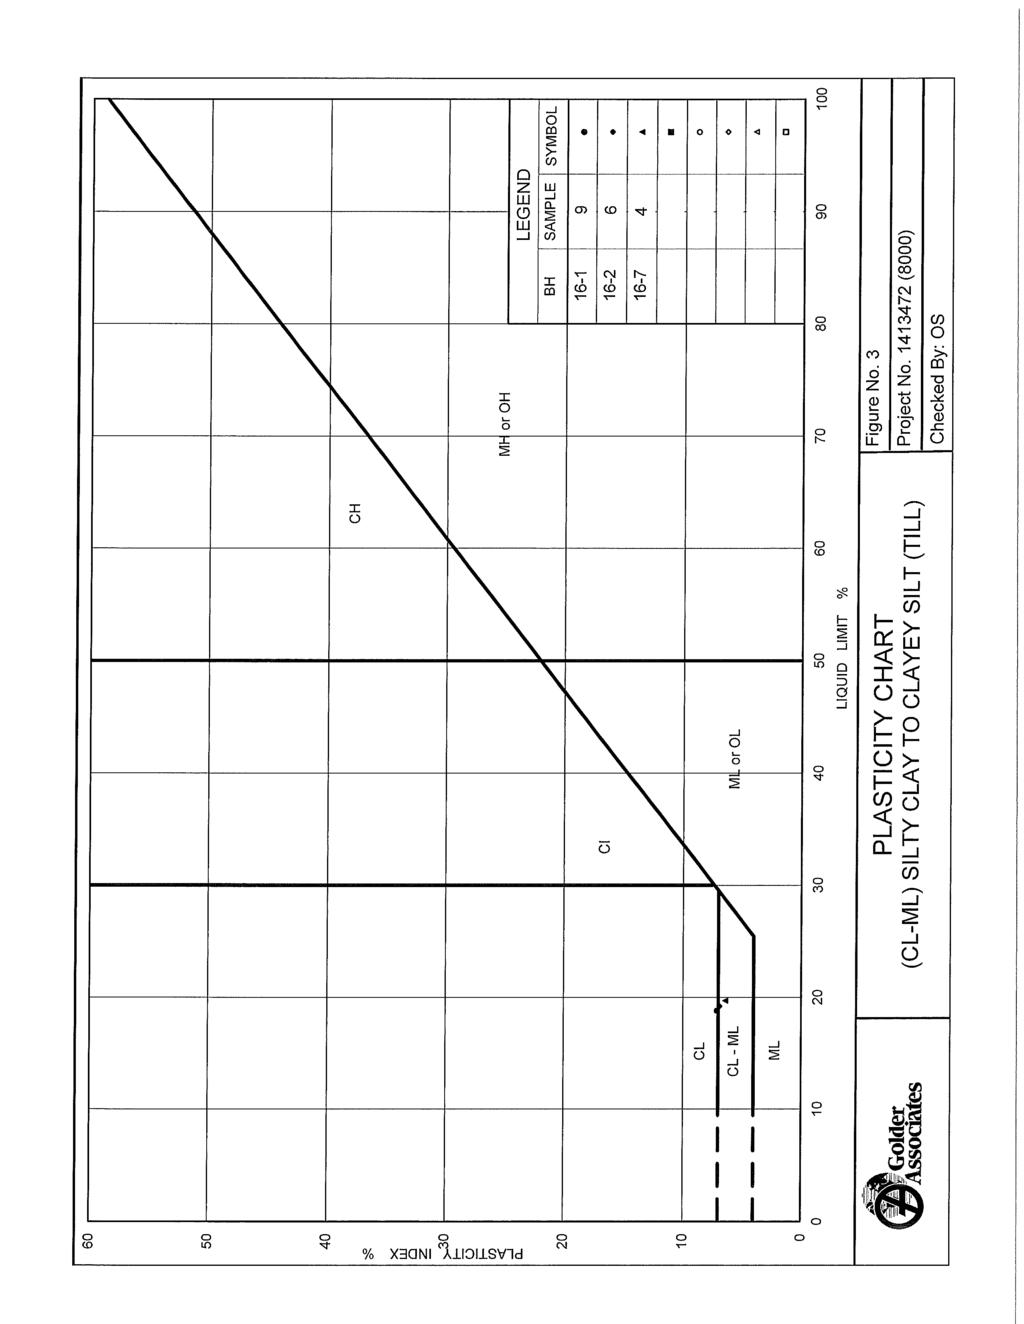
148

149
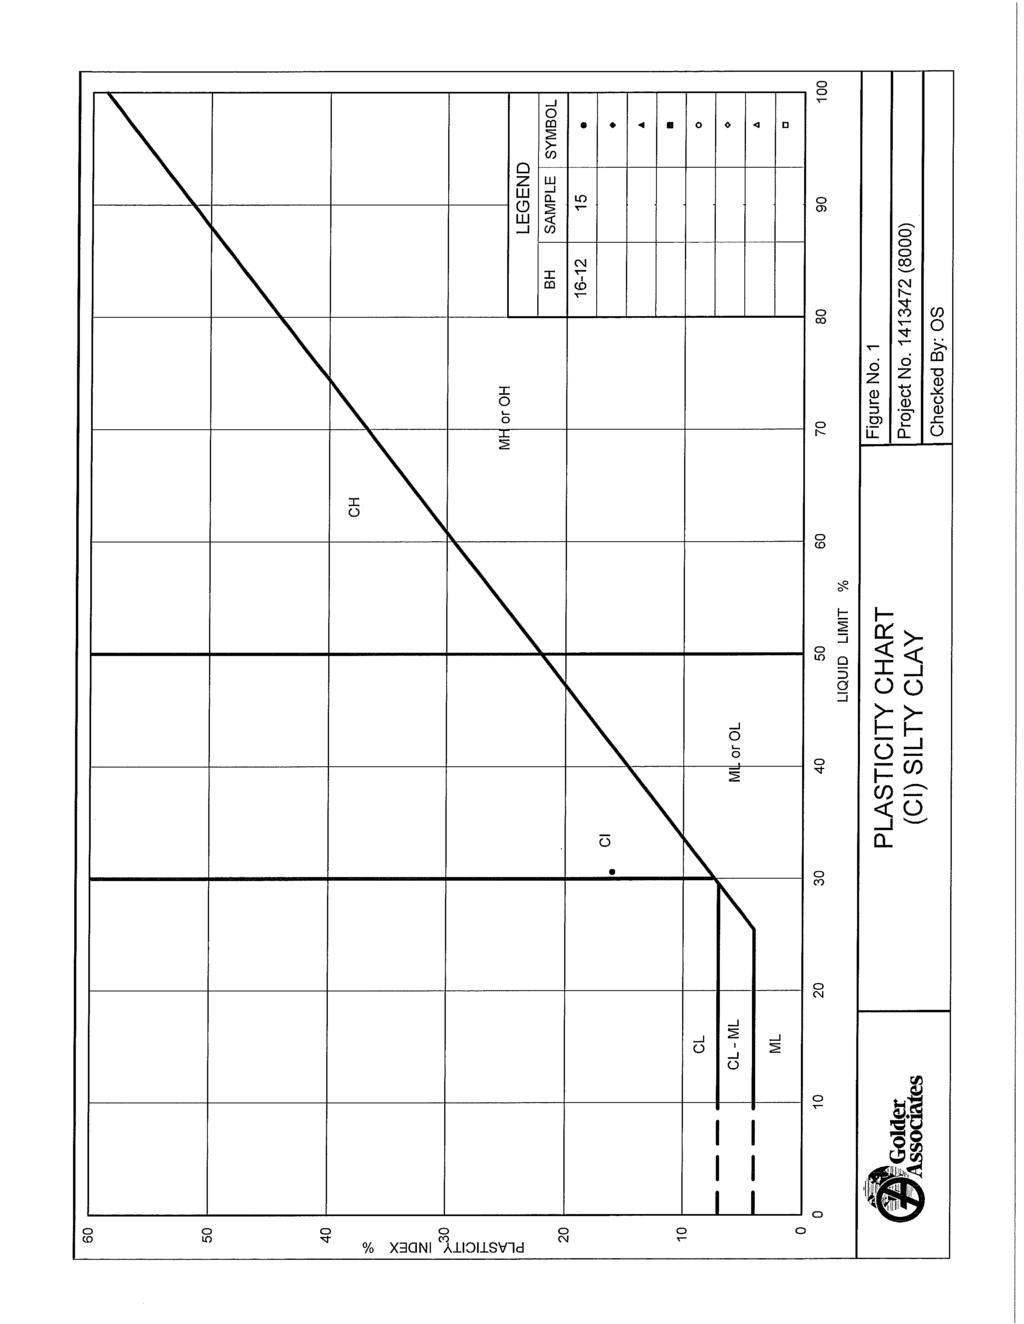
150
151 Appendix D Hydraulic Conductivity and Infiltration Tests Appendix D
 BH16-5 Constant Head 6-Apr-16 9:00 AM 0.53 0.49 0.82 0.74 0.21 1.76 2.93 1.50 0.97 2.31 3.85 1.76 1.")
152 HYDRAULIC CONDUCTIVITY ANALYSIS OF CONSTANT HEAD TEST AT BH16-5 SCREENED IN SAND Well Test Type Test Date Test Time SWL Depth (mbtoc) (L/min) Flow Rate, Q (x10-5 m 3 /s) PWL Depth (mbtoc) Drawdown (m) BH16-5 Constant Head 6-Apr-16 9:00 AM Selected Data Point for K Calculation (Constant Head Tests) Saturated Interval Length, L (m) Geological In-Situ K In-Situ K Flow Rate Drawdown Material (m/sec) (cm/sec) (m 3 SWL Elev. PWL Elev. Well Bottom /s) (m) L (m) (masl) (masl) Elev. (masl) 2.50E Sand 8.3E E-04
153 100. Displacement (cm) E+3 1.6E+3 2.0E+3 Time (sec) HYDRAULIC CONDUCTIVITY TEST AT BH SCREENED IN SILTY SAND TO SANDY SILT Company: R.J. Burnside and Associates Client: York Downs Project: Location: Markham, ON Test Well: BH16-6 Test Date: April 7, 2016 PROJECT INFORMATION AQUIFER DATA Saturated Thickness: 423. cm Anisotropy Ratio (Kz/Kr): 1. Initial Displacement: 94. cm Total Well Penetration Depth: 423. cm Casing Radius: 2.54 cm WELL DATA (BH16-6) Static Water Column Height: 423. cm Screen Length: 300. cm Well Radius: 7.62 cm Aquifer Model: Unconfined K = 5.782E-5 cm/sec SOLUTION Solution Method: Hvorslev y0 = cm
154 1000. Displacement (cm) E+3 1.6E+3 2.0E+3 Time (sec) HYDRAULIC CONDUCTIVITY TEST AT BH SCREENED IN SILTY CLAY Company: R.J. Burnside and Associates Client: York Downs Project: Location: Markham, ON Test Well: BH16-9 Test Date: April 7, 2016 PROJECT INFORMATION AQUIFER DATA Saturated Thickness: 429. cm Anisotropy Ratio (Kz/Kr): 1. Initial Displacement: 136. cm Total Well Penetration Depth: 429. cm Casing Radius: 2.54 cm WELL DATA (BH16-9) Static Water Column Height: 429. cm Screen Length: 300. cm Well Radius: 7.62 cm Aquifer Model: Unconfined K = 1.177E-5 cm/sec SOLUTION Solution Method: Hvorslev y0 = cm
155 1000. Displacement (cm) E+3 1.8E+3 2.4E+3 3.0E+3 Time (sec) HYDRAULIC CONDUCTIVITY TEST AT BH16-12S - SCREENED IN SANDY SILT Company: R.J. Burnside and Associates Client: York Downs Project: Location: Markham, ON Test Well: BH16-12s Test Date: April 6, 2016 PROJECT INFORMATION AQUIFER DATA Saturated Thickness: 560. cm Anisotropy Ratio (Kz/Kr): 1. Initial Displacement: 378. cm Total Well Penetration Depth: 560. cm Casing Radius: 2.54 cm WELL DATA (BH16-12s) Static Water Column Height: 560. cm Screen Length: 300. cm Well Radius: 7.62 cm Aquifer Model: Unconfined K = 1.587E-5 cm/sec SOLUTION Solution Method: Hvorslev y0 = cm
156 1.0E+4 Displacement (cm) E+3 3.2E+3 4.8E+3 6.4E+3 8.0E+3 Time (sec) HYDRAULIC CONDUCTIVITY TEST AT BH16-13D - SCREENED IN SANDY SILT TO SILT/SAND Company: R.J. Burnside and Associates Client: York Downs Project: Location: Markham, ON Test Well: BH16-13d Test Date: April 7, 2016 PROJECT INFORMATION AQUIFER DATA Saturated Thickness: cm Anisotropy Ratio (Kz/Kr): 1. Initial Displacement: cm Total Well Penetration Depth: cm Casing Radius: 2.54 cm WELL DATA (BH16-13d) Static Water Column Height: cm Screen Length: 150. cm Well Radius: 7.62 cm Aquifer Model: Unconfined K = 8.784E-6 cm/sec SOLUTION Solution Method: Hvorslev y0 = cm
157 1000. Displacement (cm) E+3 1.6E+3 2.0E+3 Time (sec) HYDRAULIC CONDUCTIVITY TEST AT BH16-14S - SCREENED IN SILTY SAND TO SAND Company: R.J. Burnside and Associates Client: York Downs Project: Location: Markham, ON Test Well: BH16-14s Test Date: April 7, 2016 PROJECT INFORMATION AQUIFER DATA Saturated Thickness: cm Anisotropy Ratio (Kz/Kr): 1. Initial Displacement: cm Total Well Penetration Depth: cm Casing Radius: 2.54 cm WELL DATA (BH16-14s) Static Water Column Height: cm Screen Length: 90. cm Well Radius: 7.62 cm Aquifer Model: Unconfined K = cm/sec SOLUTION Solution Method: Hvorslev y0 = 253. cm
158 1000. Displacement (cm) E+3 2.4E+3 3.6E+3 4.8E+3 6.0E+3 Time (sec) HYDRAULIC CONDUCTIVITY TEST AT BH16-15S - SCREENED IN SAND/SILT TO SAND Company: R.J. Burnside and Associates Client: York Downs Project: Location: Markham, ON Test Well: BH16-15s Test Date: April 6, 2016 PROJECT INFORMATION AQUIFER DATA Saturated Thickness: cm Anisotropy Ratio (Kz/Kr): 1. Initial Displacement: cm Total Well Penetration Depth: cm Casing Radius: 2.54 cm WELL DATA (BH16-15s) Static Water Column Height: cm Screen Length: 60. cm Well Radius: 7.62 cm Aquifer Model: Unconfined K = 4.118E-5 cm/sec SOLUTION Solution Method: Hvorslev y0 = 161. cm
159 Infiltration Rate at IT1 300 Soil Type: Sandy Silt Till, Some Gravel Test Depth: 0.35 mbgl 250 Infiltration Rate (mm/hr) Interpreted Stable Infiltration Rate: ~ 205 mm/hr Elapsed Time (min) Test Completed by RJ Burnside & Associates Ltd, May 2016 Test Location: East North Zone 17 R.J. Burnside & Associates Limited File: _Infiltration Test Analysis.xlsx Date: 8/25/2016 Prepared By: JJM Figure D-8
160 Infiltration Rate at IT Soil Type: Silty Sand Till, Gravel Test Depth: 0.40 mbgl Test Completed by RJ Burnside & Associates Ltd, May 2016 Test Location: East North Zone 17 Infiltration Rate (mm/hr) Interpreted Stable Infiltration Rate: ~ 1060 mm/hr Elapsed Time (min) R.J. Burnside & Associates Limited File: _Infiltration Test Analysis.xlsx Date: 8/29/2016 Prepared By: JJM Figure D-9
161 Infiltration Rate at IT3 300 Soil Type: Sandy Silt Till, Some Clay Test Depth: 0.40 mbgl 250 Infiltration Rate (mm/hr) Interpreted Stable Infiltration Rate: ~ 211 mm/hr Elapsed Time (min) Test Completed by RJ Burnside & Associates Ltd, May 2016 Test Location: East North Zone 17 R.J. Burnside & Associates Limited File: _Infiltration Test Analysis.xlsx Date: 8/25/2016 Prepared By: JJM Figure D-10
162 Infiltration Rate at IT4 300 Soil Type: Clayey Silt, Trace Sand Test Depth: 0.45 mbgl 250 Infiltration Rate (mm/hr) Interpreted Stable Infiltration Rate: ~ 135 mm/hr Elapsed Time (min) Test Completed by RJ Burnside & Associates Ltd, May 2016 Test Location: East North Zone 17 R.J. Burnside & Associates Limited File: _Infiltration Test Analysis.xlsx Date: 8/25/2016 Prepared By: JJM Figure D-11
163 Infiltration Rate at IT5 Infiltration Rate (mm/hr) Interpreted Stable Infiltration Rate: ~ 52 mm/hr Soil Type: Clayey Silt Till Test Depth: 0.35 mbgl Test Completed by RJ Burnside & Associates Ltd, June 2016 Test Location: East North Zone Elapsed Time (min) R.J. Burnside & Associates Limited File: _Infiltration Test Analysis.xlsx Date: 8/25/2016 Prepared By: JJM Figure D-12
164 Infiltration Rate at IT Soil Type: Sandy Silt, Trace Clay Test Depth: 0.40 mbgl 600 Infiltration Rate (mm/hr) Interpreted Stable Infiltration Rate: ~ 363 mm/hr Elapsed Time (min) Test Completed by RJ Burnside & Associates Ltd, June 2016 Test Location: East North Zone 17 R.J. Burnside & Associates Limited File: _Infiltration Test Analysis.xlsx Date: 8/25/2016 Prepared By: JJM Figure D-13
165 Infiltration Rate at IT Soil Type: Silty Sand, Gravel Test Depth: 0.25 mbgl Test Completed by RJ Burnside & Associates Ltd, June 2016 Test Location: East North Zone 17 Infiltration Rate (mm/hr) Interpreted Stable Infiltration Rate: ~ 338 mm/hr Elapsed Time (min) R.J. Burnside & Associates Limited File: _Infiltration Test Analysis.xlsx Date: 8/29/2016 Prepared By: JJM Figure D-14
166 Appendix E Appendix E Groundwater Elevation Data
167 Table E-1 Monitoring Well Groundwater Elevations Well Measured Well Depth (mbmp) Well Depth (mbgl) Casing Stick up (m) Estimated Ground Elevation (masl) Measuring Point Elevation (masl) Water Level Depth (mbgl) 29-Mar-16 Estimated Elevation (masl) Water Level Depth (mbgl) 22-Apr-16 Estimated Elevation (masl) Water Level Depth (mbgl) 20-May-16 Estimated Elevation (masl) Water Level Depth (mbgl) 29-Jun-16 Estimated Elevation (masl) Water Level Depth (mbgl) 29-Jul-16 Estimated Elevation (masl) BH BH BH BH BH BH BH BH BH BH16-12s BH16-12d BH16-13s BH16-13d BH16-14s BH16-14d BH16-15s BH16-15d BH BH BH BH BH BH BH BH BH BH BH mbgl - metres below ground level masl - metres above sea level "-" denotes unavailable data R.J. Burnside & Associates Limited File: _York Downs GW Monitoring Data.xlsx Date: 8/25/2016 Prepared By: JJM Table E-1
168 Table E-2 Piezometer Groundwater Elevations Piezometer Measured Depth (mbmp) Depth (mbgl) Casing Stick up (m) Measured Ground Elevation (masl) Measuring Point Elevation (masl) Water Level Depth (mbgl) 22-Mar-16 Estimated Elevation (masl) Water Level Depth (mbgl) 29-Mar-16 Estimated Elevation (masl) Water Level Depth (mbgl) 22-Apr-16 Estimated Elevation (masl) Water Level Depth (mbgl) 20-May-16 Estimated Elevation (masl) Water Level Depth (mbgl) 29-Jun-16 Estimated Elevation (masl) Water Level Depth (mbgl) 29-Jul-16 Estimated Elevation (masl) Water Level Depth (mbgl) 05-Aug-16 Estimated Elevation (masl) PZ PZ PZ3s PZ3d PZ4s PZ4d PZ5s PZ5d PZ PZ7s PZ7d PZ8s PZ8d PZ9s PZ9d mbgl - metres below ground level masl - metres above sea level "-" denotes not part of monitoring round or unavailble data R.J. Burnside & Associates Limited File: _York Downs PZ and SG Monitoring Data.xlsx Date: 8/25/2016 Prepared By: JJM Table E-2
169 Groundwater Elevations BH Ground Surface ( masl) Groundwater Elevation (masl) Bottom of Well ( masl) Precipitation from Buttonville Airport (mm) Jan-16 Feb-16 Mar-16 Apr-16 May-16 Jun-16 Jul-16 Aug-16 Sep-16 Oct-16 Nov-16 Dec-16 Date Precipitation R.J. Burnside & Associates Limited File: _York Downs GW Monitoring Data.xlsx Date: 8/22/2016 Prepared By: JJM Figure E-1 BH16-3 0
170 Groundwater Elevations BH Ground Surface ( masl) 90 Groundwater Elevation (masl) Bottom of Well ( masl) Precipitation from Buttonville Airport (mm) Jan-16 Feb-16 Mar-16 Apr-16 May-16 Jun-16 Jul-16 Aug-16 Sep-16 Oct-16 Nov-16 Dec-16 Date Precipitation R.J. Burnside & Associates Limited File: _York Downs GW Monitoring Data.xlsx Date: 8/22/2016 Prepared By: JJM Figure E-2 BH16-4 0
171 Groundwater Elevations BH Groundwater Elevation (masl) Logger Installed April 7, 2016 Ground Surface ( masl) Bottom of BH16-5 ( masl) Precipitation from Buttonville Airport (mm) Jan-16 Feb-16 Mar-16 Apr-16 May-16 Jun-16 Jul-16 Aug-16 Sep-16 Oct-16 Nov-16 Dec-16 0 Date Precipitation BH16-5 Datalogger BH16-5 Manuals R.J. Burnside & Associates Limited File: _BH16-5 Hydrograph.xlsx Date: 8/22/2016 Prepared By: JJM Figure E-3
172 Groundwater Elevations BH Ground Surface ( masl) 90 Groundwater Elevation (masl) Bottom of Well ( masl) Precipitation from Buttonville Airport (mm) Jan-16 Feb-16 Mar-16 Apr-16 May-16 Jun-16 Jul-16 Aug-16 Sep-16 Oct-16 Nov-16 Dec-16 Date Precipitation R.J. Burnside & Associates Limited File: _York Downs GW Monitoring Data.xlsx Date: 8/22/2016 Prepared By: JJM Figure E-4 BH16-6 0
173 Groundwater Elevations BH Ground Surface ( masl) 90 Groundwater Elevation (masl) Logger Installed April 7, 2016 Bottom of BH16-7 ( masl) Precipitation from Buttonville Airport (mm) Jan-16 Feb-16 Mar-16 Apr-16 May-16 Jun-16 Jul-16 Aug-16 Sep-16 Oct-16 Nov-16 Dec-16 0 Date Precipitation BH16-7 Datalogger BH16-7 Manuals R.J. Burnside & Associates Limited File: _BH16-7 Hydrograph.xlsx Date: 8/22/2016 Prepared By: JJM Figure E-5
174 Groundwater Elevations BH Groundwater Elevation (masl) Ground Surface ( masl) Bottom of Well ( masl) Precipitation from Buttonville Airport (mm) Jan-16 Feb-16 Mar-16 Apr-16 May-16 Jun-16 Jul-16 Aug-16 Sep-16 Oct-16 Nov-16 Dec-16 Date Precipitation R.J. Burnside & Associates Limited File: _York Downs GW Monitoring Data.xlsx Date: 8/22/2016 Prepared By: JJM Figure E-6 BH16-8 0
175 Groundwater Elevations BH Groundwater Elevation (masl) Ground Surface ( masl) Bottom of Well ( masl) Precipitation from Buttonville Airport (mm) Jan-16 Feb-16 Mar-16 Apr-16 May-16 Jun-16 Jul-16 Aug-16 Sep-16 Oct-16 Nov-16 Dec-16 Date Precipitation R.J. Burnside & Associates Limited File: _York Downs GW Monitoring Data.xlsx Date: 8/22/2016 Prepared By: JJM Figure E-7 BH16-9 0
176 Groundwater Elevations BH Ground Surface ( masl) 90 Groundwater Elevation (masl) Bottom of Well ( masl) Precipitation from Buttonville Airport (mm) Jan-16 Feb-16 Mar-16 Apr-16 May-16 Jun-16 Jul-16 Aug-16 Sep-16 Oct-16 Nov-16 Dec-16 Date Precipitation BH16-10 R.J. Burnside & Associates Limited File: _York Downs GW Monitoring Data.xlsx Date: 8/22/2016 Prepared By: JJM Figure E-8 0
177 Groundwater Elevations BH Ground Surface ( masl) Groundwater Elevation (masl) Bottom of Well ( masl) Precipitation from Buttonville Airport (mm) Jan-16 Feb-16 Mar-16 Apr-16 May-16 Jun-16 Jul-16 Aug-16 Sep-16 Oct-16 Nov-16 Dec-16 Date Precipitation BH16-11 R.J. Burnside & Associates Limited File: _York Downs GW Monitoring Data.xlsx Date: 8/22/2016 Prepared By: JJM Figure E-9 0
178 Groundwater Elevations BH16-12s/d Groundwater Elevation (masl) Logger Installed April 7, 2016 BH16-12s/d Ground Surface ( masl / masl) Bottom of BH16-12s ( masl) Precipitation from Buttonville Airport (mm) Bottom of BH16-12d at masl 183 Jan-16 Feb-16 Mar-16 Apr-16 May-16 Jun-16 Jul-16 Aug-16 Sep-16 Oct-16 Nov-16 Dec-16 0 Date Precipitation BH16-12d Datalogger BH16-12d Manuals BH16-12s Manuals R.J. Burnside & Associates Limited File: _BH16-12sd Hydrograph.xlsx Date: 8/22/2016 Prepared By: JJM Figure E-10
179 Groundwater Elevations BH16-13s/d BH16-13s/d Ground Surface ( masl / masl) 90 Groundwater Elevation (masl) Water Level Recovery Following Completion of April 7 Hydraulic Conductivity Test Logger Installed April 7, 2016 Bottom of BH16-13s ( masl) Precipitation from Buttonville Airport (mm) Bottom of BH16-13d at masl 175 Jan-16 Feb-16 Mar-16 Apr-16 May-16 Jun-16 Jul-16 Aug-16 Sep-16 Oct-16 Nov-16 Dec-16 0 Date Precipitation BH16-13d Datalogger BH16-13d Manuals BH16-13s Manuals R.J. Burnside & Associates Limited File: _BH16-13sd Hydrograph.xlsx Date: 8/22/2016 Prepared By: JJM Figure E-11
180 Groundwater Elevations BH16-14s/d BH16-14s/d Ground Surface ( masl) Groundwater Elevation (masl) BH16-14s Bottom of Well ( masl) Precipitation from Buttonville Airport (mm) BH16-14d Bottom of Well ( masl) 168 Jan-16 Feb-16 Mar-16 Apr-16 May-16 Jun-16 Jul-16 Aug-16 Sep-16 Oct-16 Nov-16 Dec-16 Date Precipitation BH16-14s BH16-14d R.J. Burnside & Associates Limited File: _York Downs GW Monitoring Data.xlsx Date: 8/25/2016 Prepared By: JJM Figure E-12 0
181 Groundwater Elevations BH16-15s/d 181 Ground Surface ( masl) Groundwater Elevation (masl) Logger Installed April 7, 2016 Bottom of BH16-15s ( masl) Precipitation from Buttonville Airport (mm) Bottom of BH16-15d at masl 171 Jan-16 Feb-16 Mar-16 Apr-16 May-16 Jun-16 Jul-16 Aug-16 Sep-16 Oct-16 Nov-16 Dec-16 0 Date Precipitation BH16-15d Datalogger BH16-15d Manuals BH16-15s Manuals R.J. Burnside & Associates Limited File: _BH16-15sd Hydrograph.xlsx Date: 8/22/2016 Prepared By: JJM Figure E-13
182 Groundwater Elevations BH Groundwater Elevation (masl) Logger Installed April 7, 2016 Ground Surface ( masl) Precipitation from Buttonville Airport (mm) Bottom of BH16-16 at masl 173 Jan-16 Feb-16 Mar-16 Apr-16 May-16 Jun-16 Jul-16 Aug-16 Sep-16 Oct-16 Nov-16 Dec-16 0 Date Precipitation BH16-16 Datalogger BH16-16 Manuals R.J. Burnside & Associates Limited File: _BH16-16 Hydrograph.xlsx Date: 8/22/2016 Prepared By: JJM Figure E-14
183 Groundwater Elevations BH Ground Surface ( masl) 90 Groundwater Elevation (masl) Bottom of Well ( masl) Precipitation from Buttonville Airport (mm) Jan-16 Feb-16 Mar-16 Apr-16 May-16 Jun-16 Jul-16 Aug-16 Sep-16 Oct-16 Nov-16 Dec-16 Date Precipitation R.J. Burnside & Associates Limited File: _York Downs GW Monitoring Data.xlsx Date: 8/22/2016 Prepared By: JJM Figure E-15 BH14-1 0
184 Groundwater Elevations BH Ground Surface ( masl) 90 Groundwater Elevation (masl) Bottom of Well ( masl) Precipitation from Buttonville Airport (mm) Jan-16 Feb-16 Mar-16 Apr-16 May-16 Jun-16 Jul-16 Aug-16 Sep-16 Oct-16 Nov-16 Dec-16 Date Precipitation R.J. Burnside & Associates Limited File: _York Downs GW Monitoring Data.xlsx Date: 8/22/2016 Prepared By: JJM Figure E-16 BH14-2 0
185 Groundwater Elevations BH Ground Surface ( masl) 90 Groundwater Elevation (masl) Bottom of Well ( masl) Precipitation from Buttonville Airport (mm) Jan-16 Feb-16 Mar-16 Apr-16 May-16 Jun-16 Jul-16 Aug-16 Sep-16 Oct-16 Nov-16 Dec-16 Date Precipitation R.J. Burnside & Associates Limited File: _York Downs GW Monitoring Data.xlsx Date: 8/22/2016 Prepared By: JJM Figure E-17 BH14-3 0
186 Groundwater Elevations BH Ground Surface ( masl) Groundwater Elevation (masl) Bottom of Well ( masl) Precipitation from Buttonville Airport (mm) Jan-16 Feb-16 Mar-16 Apr-16 May-16 Jun-16 Jul-16 Aug-16 Sep-16 Oct-16 Nov-16 Dec-16 Date Precipitation R.J. Burnside & Associates Limited File: _York Downs GW Monitoring Data.xlsx Date: 8/22/2016 Prepared By: JJM Figure E-18 BH14-8 0
187 Groundwater Elevations BH Ground Surface ( masl) Groundwater Elevation (masl) Bottom of Well ( masl) Precipitation from Buttonville Airport (mm) Jan-16 Feb-16 Mar-16 Apr-16 May-16 Jun-16 Jul-16 Aug-16 Sep-16 Oct-16 Nov-16 Dec-16 Date Precipitation BH14-12 R.J. Burnside & Associates Limited File: _York Downs GW Monitoring Data.xlsx Date: 8/22/2016 Prepared By: JJM Figure E-19 0
188 Groundwater Elevations BH Ground Surface ( masl) 90 Groundwater Elevation (masl) Bottom of Well ( masl) Precipitation from Buttonville Airport (mm) Jan-16 Feb-16 Mar-16 Apr-16 May-16 Jun-16 Jul-16 Aug-16 Sep-16 Oct-16 Nov-16 Dec-16 Date Precipitation BH14-15 R.J. Burnside & Associates Limited File: _York Downs GW Monitoring Data.xlsx Date: 8/22/2016 Prepared By: JJM Figure E-20 0
189 Groundwater Elevations BH Ground Surface ( masl) Groundwater Elevation (masl) Bottom of Well ( masl) Precipitation from Buttonville Airport (mm) Jan-16 Feb-16 Mar-16 Apr-16 May-16 Jun-16 Jul-16 Aug-16 Sep-16 Oct-16 Nov-16 Dec-16 Date Precipitation BH14-17 R.J. Burnside & Associates Limited File: _York Downs GW Monitoring Data.xlsx Date: 8/22/2016 Prepared By: JJM Figure E-21 0
190 Groundwater Elevations BH Ground Surface ( masl) Groundwater Elevation (masl) Bottom of Well ( masl) Precipitation from Buttonville Airport (mm) Jan-16 Feb-16 Mar-16 Apr-16 May-16 Jun-16 Jul-16 Aug-16 Sep-16 Oct-16 Nov-16 Dec-16 Date Precipitation BH14-29 R.J. Burnside & Associates Limited File: _York Downs GW Monitoring Data.xlsx Date: 8/22/2016 Prepared By: JJM Figure E-22 0
191 Groundwater Elevations BH Ground Surface ( masl) Groundwater Elevation (masl) Bottom of Well ( masl) Precipitation from Buttonville Airport (mm) Jan-16 Feb-16 Mar-16 Apr-16 May-16 Jun-16 Jul-16 Aug-16 Sep-16 Oct-16 Nov-16 Dec-16 Date Precipitation BH14-33 R.J. Burnside & Associates Limited File: _York Downs GW Monitoring Data.xlsx Date: 8/22/2016 Prepared By: JJM Figure E-23 0
192 Groundwater Elevations PZ1 + SG Ground Surface ( masl) Groundwater Elevation (masl) Bottom of PZ1 ( masl) Precipitation from Buttonville Airport (mm) Jan-16 Feb-16 Mar-16 Apr-16 May-16 Jun-16 Jul-16 Aug-16 Sep-16 Oct-16 Nov-16 Dec-16 0 R.J. Burnside & Associates Limited File: _York Downs PZ and SG Monitoring Data.xlsx Date: 8/29/2016 Prepared By: JJM Figure E-24 Date Precipitation PZ1 SG1
193 Groundwater Elevations PZ2 + SG Groundwater Elevation (masl) Ground Surface ( masl) Bottom of PZ2 ( masl) Precipitation from Buttonville Airport (mm) Jan-16 Feb-16 Mar-16 Apr-16 May-16 Jun-16 Jul-16 Aug-16 Sep-16 Oct-16 Nov-16 Dec-16 0 R.J. Burnside & Associates Limited File: _York Downs PZ and SG Monitoring Data.xlsx Date: 8/29/2016 Prepared By: JJM Figure E-25 Date Precipitation PZ2 SG2
194 Groundwater Elevations PZ3s/d + SG Groundwater Elevation (masl) Ground Surface at PZ3s ( masl) Ground Surface at PZ3d ( masl) Bottom of PZ3s ( masl) Bottom of PZ3d ( masl) Precipitation from Buttonville Airport (mm) Jan-16 Feb-16 Mar-16 Apr-16 May-16 Jun-16 Jul-16 Aug-16 Sep-16 Oct-16 Nov-16 Dec-16 0 R.J. Burnside & Associates Limited File: _York Downs PZ and SG Monitoring Data.xlsx Date: 8/29/2016 Prepared By: JJM Figure E-26 Date Precipitation PZ3s SG3 PZ3d
195 Groundwater Elevations PZ4s/d + SG PZ4s/d Ground Surface ( and masl) Groundwater Elevation (masl) Logger Installed April 22, 2016 SG4 Ground Surface ( masl) Bottom of PZ4s ( masl) Bottom of PZ4d ( masl) Loggers installed in PZ4s and SG4 on August 5, Precipitation from Buttonville Airport (mm) Jan-16 Feb-16 Mar-16 Apr-16 May-16 Jun-16 Jul-16 Aug-16 Sep-16 Oct-16 Nov-16 Dec-16 0 Date Precipitation PZ4d Datalogger PZ4d Manuals PZ4s Manuals SG4 Manuals R.J. Burnside & Associates Limited File: _PZ4sd Hydrograph.xlsx Date: 8/29/2016 Prepared By: JJM Figure E-27
196 Groundwater Elevations PZ5s/d + SG PZ5s/d Ground Surface ( masl) 90 Groundwater Elevation (masl) Logger Installed April 7, 2016 SG5 Ground Surface ( masl) Bottom of PZ5s ( masl) Bottom of PZ5d ( masl) Loggers installed in PZ5s and SG5 on August 5, Precipitation from Buttonville Airport (mm) Jan-16 Feb-16 Mar-16 Apr-16 May-16 Jun-16 Jul-16 Aug-16 Sep-16 Oct-16 Nov-16 Dec-16 0 Date Precipitation PZ5d Datalogger PZ5d Manuals PZ5s Manuals SG5 Manuals R.J. Burnside & Associates Limited File: _PZ5sd Hydrograph.xlsx Date: 8/29/2016 Prepared By: JJM Figure E-28
197 Groundwater Elevations PZ6 + SG Ground Surface at PZ6 ( masl) 90 Groundwater Elevation (masl) Bottom of PZ6s ( masl) Precipitation from Buttonville Airport (mm) Jan-16 Feb-16 Mar-16 Apr-16 May-16 Jun-16 Jul-16 Aug-16 Sep-16 Oct-16 Nov-16 Dec-16 0 R.J. Burnside & Associates Limited File: _York Downs PZ and SG Monitoring Data.xlsx Date: 8/29/2016 Prepared By: JJM Figure E-29 Date Precipitation PZ6 SG6
198 Groundwater Elevations PZ7s/d + SG Ground Surface at PZ7d ( masl) 90 Groundwater Elevation (masl) Ground Surface at PZ7s ( masl) Bottom of PZ7s ( masl) Bottom of PZ7d ( masl) Precipitation from Buttonville Airport (mm) Jan-16 Feb-16 Mar-16 Apr-16 May-16 Jun-16 Jul-16 Aug-16 Sep-16 Oct-16 Nov-16 Dec-16 0 R.J. Burnside & Associates Limited File: _York Downs PZ and SG Monitoring Data.xlsx Date: 8/29/2016 Prepared By: JJM Figure E-30 Date Precipitation PZ7s SG7 PZ7d
199 Groundwater Elevations PZ8s/d + SG PZ8s/d, SG8 Ground Surfaces (~ masl) Groundwater Elevation (masl) Bottom of PZ8s ( masl) Bottom of PZ8d ( masl) Loggers installed in PZ8s,d and SG8 on August 5, Precipitation from Buttonville Airport (mm) Jan-16 Feb-16 Mar-16 Apr-16 May-16 Jun-16 Jul-16 Aug-16 Sep-16 Oct-16 Nov-16 Dec-16 0 Date Precipitation PZ8d Datalogger PZ8d Manuals PZ8s Manuals SG8 Manuals R.J. Burnside & Associates Limited File: _PZ8sd Hydrograph.xlsx Date: 8/29/2016 Prepared By: JJM Figure E-31
200 Groundwater Elevations PZ9s/d + SG Groundwater Elevation (masl) PZ9s/d, SG9 Ground Surfaces (~ masl) Bottom of PZ9s ( masl) Bottom of PZ9d ( masl) Loggers installed in PZ9s,d and SG9 on August 5, Precipitation from Buttonville Airport (mm) Jan-16 Feb-16 Mar-16 Apr-16 May-16 Jun-16 Jul-16 Aug-16 Sep-16 Oct-16 Nov-16 Dec-16 0 Date Precipitation PZ9d Datalogger PZ9d Manuals PZ9s Manuals SG9 Manuals R.J. Burnside & Associates Limited File: _PZ9sd Hydrograph.xlsx Date: 8/29/2016 Prepared By: JJM Figure E-32
201 Appendix F Surface Water Data Appendix F
202 Table F-1: Surface Water Elevations Staff Gauge Number: Ground Elev. (masl): Date 23-Mar Mar Apr May Jun Jul-16 5-Aug-16 Cont Staff Gauge Number: Ground Elev. (masl): Date 23-Mar Mar Apr May Jun Jul-16 5-Aug-16 SG1 SG2 SG3 SG4 SG5 SG Water Level Elev. (masl) Water Level Elev. (masl) Water Level Elev. (masl) Water Level Elev. (masl) Water Level Elev. (masl) Water Level Elev. (masl) Installed Aug 5, dry dry dry dry - - SG7 SG8 SG9 SG C-1 SG C Water Level Elev. (masl) Water Level Elev. (masl) Water Level Elev. (masl) Water Level Elev. (masl) Water Level Elev. (masl) Installed Aug 5, 2016 Installed Aug 5, 2016 Installed Aug 5, 2016 Installed Aug 5, dry dry R.J. Burnside & Associates Limited File: _York Downs PZ and SG Monitoring Data.xlsx Date: 8/29/2016 Prepared By: JJM Table F-1
203 Table F-2 Surface Water Flows Date Days Since Precipitiation: Surface Water Station: SS1 SS2 SS3 SS4 SS5 22-Apr May C.N.A 29-Jun Jul Flow measurements are in L/s "C.N.A." denotes Could Not Access R.J. Burnside & Associates Limited File: _York Downs SW Monitoring Data.xlsx Date: 8/26/2016 Prepared By: JJM Table F-2
204 Table F-3: Surface Water Quality Surface Water Station Time Salinity (ppm) Dissolved Oxygen (mg/l) Temperature ( o C) ph Conductivity (µs/cm) TDS (g/l) TSS (mg/l) Bruce Creek: SS1 22-Apr-16 10:15 AM 426 N/A May-16 8:45 AM 401 N/A Jun-16 9:00 AM 339 N/A Jul-16 10:30 AM 330 N/A SS2 SS3 22-Apr-16 1:15 PM 397 N/A May-16 8:30 AM 397 N/A Jun-16 8:45 AM 338 N/A Jul-16 8:45 AM 329 N/A Apr-16 2:30 PM 420 N/A May-16 10:45 AM 424 N/A Jun-16 11:30 AM 340 N/A Jul-16 11:45 AM 327 N/A Berczy Creek: SS4 22-Apr-16 3:00 PM 668 N/A May-16 9:30 AM 684 N/A Jun-16 10:30 AM 602 N/A Jul-16 11:00 AM 389 N/A SS5 22-Apr-16 3:30 PM 595 N/A May Jun-16 1:00 PM 577 N/A Jul-16 1:00 PM 398 N/A R.J. Burnside & Associates Limited File: _York Downs SW Monitoring Data.xlsx Date: 8/26/2016 Prepared By: JJM Table F-3
205 Appendix G Water Quality Data Appendix G
206 Sample Description Table G-1 Groundwater Quality th Avenue MW16-5 MW16-15s Date Sampled 06-Apr Apr-16 Parameter Unit ODWS A/O RDL Electrical Conductivity us/cm ph ph Units Total Suspended Solids mg/l Total Hardness (as CaCO3) mg/l Total Dissolved Solids mg/l Colour TCU Alkalinity (as CaCO3) mg/l Chloride mg/l Total Kjeldahl Nitrogen as N mg/l 0.5 < 0.5 < 0.5 Total Organic Carbon mg/l Dissolved Organic Carbon mg/l Nitrate as N mg/l < 0.06 Nitrite as N mg/l < 0.03 < 0.03 Ammonia+Ammonium (N) mg/l 0.1 < Sulphate mg/l Calcium (dissolved) mg/l Magnesium (dissolved) mg/l Sodium (dissolved) mg/l Potassium (dissolved) mg/l Aluminum (dissolved) µg/l < 1 < 1 Antimony (dissolved) µg/l < 0.2 < 0.2 Arsenic (dissolved) µg/l Barium (dissolved) µg/l Beryllium (dissolved) µg/l < < Bismuth (dissolved) µg/l < < Boron (dissolved) µg/l Cadmium (dissolved) µg/l Chromium (dissolved) µg/l Cobalt (dissolved) µg/l Copper (dissolved) µg/l Iron (dissolved) µg/l Lead (dissolved) µg/l < Lithium (dissolved) µg/l Manganese (dissolved) µg/l Mercury (dissolved) µg/l < 0.01 < 0.01 Molybdenum (dissolved) µg/l Nickel (dissolved) µg/l Phosphorus (dissolved) µg/l 3 < 3 10 Selenium (dissolved) µg/l < 0.04 Silicon (dissolved) µg/l Silver (dissolved) µg/l < < Strontium (dissolved) µg/l Thallium (dissolved) µg/l < Tin (dissolved) µg/l Titanium (dissolved) µg/l 0.05 < 0.05 < 0.05 Uranium (dissolved) µg/l Vanadium (dissolved) µg/l Zinc (dissolved) µg/l Anion Sum meq/l NA Cation Sum meq/l NA % Difference/ Ion Balance % NA RDL - Reported Detection Limit ODWS - Ontario Drinking Water Standard Maximum Acceptable Concentration Chemical/Physical Objectives [A/O] - Not Health Related NA - Not Applicable Bold results indicate exceedances in ODWS criteria Shaded results indicate exceedances in aesthetic objectives (A/O) R.J. Burnside & Associates Limited th Avenue Table G-1
207 Table G-2 Surface Water Quality th Avenue Sample Description Berczy Bruce (SG7) (SS1) Date Sampled 06-Apr Apr-16 Parameter Unit PWQO RDL Electrical Conductivity us/cm ph ph Units Total Hardness (as CaCO3) mg/l as CaCO Total Suspended Solids mg/l Total Dissolved Solids mg/l Alkalinity (as CaCO3) mg/l Chloride mg/l Nitrate as N as N mg/l Nitrite as N as N mg/l 0.03 < 0.03 < 0.03 Ammonia+Ammonium (N) as N mg/l 0.1 < 0.1 < 0.1 Sulphate mg/l Total Phosphorus µg/l Calcium mg/l Magnesium mg/l Sodium mg/l Potassium mg/l Aluminum (total) µg/l Aluminum-dissolved µg/l Antimony µg/l < Arsenic µg/l Barium µg/l Beryllium µg/l < Boron µg/l Cadmium µg/l Chromium µg/l Cobalt µg/l Copper µg/l Iron µg/l Lead µg/l Manganese µg/l Dissolved Mercury µg/l < Molybdenum µg/l Nickel µg/l Selenium µg/l Silicon µg/l Silver µg/l < Strontium µg/l Thallium µg/l < Tin µg/l Titanium µg/l Uranium µg/l Vanadium µg/l Zinc µg/l 20 2 < 2 4 Cation Sum meq/l Anion Sum meq/l % Difference Cation/Anion % difference RDL - Reported Detection Limit PWQO - Provincial Water Quality Objective NA - Not Applicable NR - Non Reportable Bold results indicate exceedances in criteria R.J. Burnside & Associates Limited th Avenue Table G-2
208 Table G-3 Surface Water Field Chemistry Surface Water Station Time Salinity (ppm) SS1 Temperature ( o C) ph Conductivity (µs/cm) TDS (g/l) TSS (mg/l) 22-Apr-16 10:15 AM May-16 8:45 AM Jun-16 9:00 AM Jul-16 10:30 AM SS2 22-Apr-16 1:30 PM May-16 8:30 AM Jun-16 8:45 AM Jul-16 8:45 AM SS3 22-Apr-16 2:30 PM May-16 10:45 AM Jun-16 11:30 AM Jul-16 SS4 22-Apr-16 3:30 PM May-16 9:30 AM Jun-16 10:30 AM Jul-16 11:15 AM R.J. Burnside & Associates Limited th Avenue Page 1 of 1 Table G-3
209 Appendix H Water Balance Calculations Appendix H
210 WATER BALANCE CALCULATIONS th Avenue, Markham PROJECT No TABLE H-1 Pre- and Post-Development Monthly Water Balance Components Based on Thornthwaite's Soil Moisture Balance Approach with a Soil Moisture Retention of 125 mm (urban lawns in silt soils) Precipitation data from Toronto Buttonville Climate Station ( ) Potential Evapotranspiration Calculation JAN FEB MAR APR MAY JUN JUL AUG SEP OCT NOV DEC YEAR Average Temperature (Degree C) <--From Environment Canada Heat index: i = (t/5) Unadjusted Daily Potential Evapotranspiration U (mm) Adjusting Factor for U (Latitude 43 o 52' N) <--From J. M. Lorente (1961). pp. 206 Adjusted Potential Evapotranspiration PET (mm) COMPONENTS JAN FEB MAR APR MAY JUN JUL AUG SEP OCT NOV DEC YEAR Precipitation (P) <--From Environment Canada Potential Evapotranspiration (PET) P - PET Change in Soil Moisture Storage Soil Moisture Storage max 125 mm Actual Evapotranspiration (AET) Soil Moisture Deficit max 125 mm Water Surplus - available for infiltration or runoff Potential Infiltration (based on MOECC metholodogy*; independent of temperature) Potential Direct Surface Water Runoff (independent of temperature) IMPERVIOUS AREA WATER SURPLUS Precipitation (P) 853 mm/year 15%) 128 mm/year P-PE (surplus available for runoff from impervious areas) 725 mm/year Assume January storage is 100% of Soil Moisture Storage Soil Moisture Storage 125 mm <-- See "Water Holding Capacity" values in Table 3.1, MOE SWMPDM, 2003 *MOECC SWM infiltration calculations topography - hilly land 0.15 <-- Infiltration Factors from the bottom section of Table 3.1, MOE SWMPDM, 2003 soils - silt soils 0.2 <-- Infiltration Factors from the bottom section of Table 3.1, MOE SWMPDM, 2003 cover - lawns 0.1 <-- Infiltration Factors from the bottom section of Table 3.1, MOE SWMPDM, 2003 Infiltration factor 0.45 Latitude of site (or climate station) 43 O N. Table H-1
211 WATER BALANCE CALCULATIONS th Avenue, Markham PROJECT No TABLE H-2 Pre- and Post-Development Monthly Water Balance Components Based on Thornthwaite's Soil Moisture Balance Approach with a Soil Moisture Retention of 400 mm (mature forest in silt soils) Precipitation data from Toronto Buttonville Climate Station ( ) Potential Evapotranspiration Calculation JAN FEB MAR APR MAY JUN JUL AUG SEP OCT NOV DEC YEAR Average Temperature (Degree C) <--From Environment Canada Heat index: i = (t/5) Unadjusted Daily Potential Evapotranspiration U (mm) Adjusting Factor for U (Latitude 43 o 52' N) <--From J. M. Lorente (1961). pp. 206 Adjusted Potential Evapotranspiration PET (mm) COMPONENTS JAN FEB MAR APR MAY JUN JUL AUG SEP OCT NOV DEC YEAR Precipitation (P) <--From Environment Canada Potential Evapotranspiration (PET) P - PET Change in Soil Moisture Storage Soil Moisture Storage max 400 mm Actual Evapotranspiration (AET) Soil Moisture Deficit max 400 mm Water Surplus - available for infiltration or runoff Potential Infiltration (based on MOECC metholodogy*; independent of temperature) Potential Direct Surface Water Runoff (independent of temperature) IMPERVIOUS AREA WATER SURPLUS Precipitation (P) 853 mm/year 15%) 128 mm/year P-PE (surplus available for runoff from impervious areas) 725 mm/year Assume January storage is 100% of Soil Moisture Storage Soil Moisture Storage 400 mm <-- See "Water Holding Capacity" values in Table 3.1, MOE SWMPDM, 2003 *MOECC SWM infiltration calculations topography - hilly land 0.15 <-- Infiltration Factors from the bottom section of Table 3.1, MOE SWMPDM, 2003 soils - silt soils 0.2 <-- Infiltration Factors from the bottom section of Table 3.1, MOE SWMPDM, 2003 cover - wooded lands 0.2 <-- Infiltration Factors from the bottom section of Table 3.1, MOE SWMPDM, 2003 Infiltration factor 0.55 Latitude of site (or climate station) 43 O N. Table H-2
212 WATER BALANCE CALCULATIONS th Avenue, Markham PROJECT No TABLE H-3 Pre- and Post-Development Monthly Water Balance Components Based on Thornthwaite's Soil Moisture Balance Approach with a Soil Moisture Retention of 125 mm (urban lawns in silt soils) with Grading Precipitation data from Toronto Buttonville Climate Station ( ) Potential Evapotranspiration Calculation JAN FEB MAR APR MAY JUN JUL AUG SEP OCT NOV DEC YEAR Average Temperature (Degree C) <--From Environment Canada Heat index: i = (t/5) Unadjusted Daily Potential Evapotranspiration U (mm) Adjusting Factor for U (Latitude 43 o 52' N) <--From J. M. Lorente (1961). pp. 206 Adjusted Potential Evapotranspiration PET (mm) COMPONENTS JAN FEB MAR APR MAY JUN JUL AUG SEP OCT NOV DEC YEAR Precipitation (P) <--From Environment Canada Potential Evapotranspiration (PET) P - PET Change in Soil Moisture Storage Soil Moisture Storage max 125 mm Actual Evapotranspiration (AET) Soil Moisture Deficit max 125 mm Water Surplus - available for infiltration or runoff Potential Infiltration (based on MOECC metholodogy*; independent of temperature) Potential Direct Surface Water Runoff (independent of temperature) IMPERVIOUS AREA WATER SURPLUS Precipitation (P) 853 mm/year 15%) 128 mm/year P-PE (surplus available for runoff from impervious areas) 725 mm/year Assume January storage is 100% of Soil Moisture Storage Soil Moisture Storage 125 mm <-- See "Water Holding Capacity" values in Table 3.1, MOE SWMPDM, 2003 *MOECC SWM infiltration calculations topography - graded land 0.2 <-- Infiltration Factors from the bottom section of Table 3.1, MOE SWMPDM, 2003 soils - silt soils 0.2 <-- Infiltration Factors from the bottom section of Table 3.1, MOE SWMPDM, 2003 cover - urban lawns 0.1 <-- Infiltration Factors from the bottom section of Table 3.1, MOE SWMPDM, 2003 Infiltration factor 0.5 Latitude of site (or climate station) 43 O N. Table H-3
213 WATER BALANCE CALCULATIONS th Avenue, Markham PROJECT No TABLE H-4 Water Balance - EAST DRAFT PLAN AREA- Existing Conditions and Post-Development (no mitigation) th Avenue, Markham Catchment Area Approx. Land Area* (m 2 ) Estimated Impervious Fraction for Land Use** Estimated Impervious Area (m 2 ) Runoff from Impervious Area*** (m/a) Runoff Volume from Impervious Area (m 3 /a) Estimated Pervious Area (m 2 ) Runoff from Pervious Area*** (m/a) Runoff Volume from Pervious Area (m 3 /a) Infiltration from Pervious Area*** (m/a) Infiltration Volume from Pervious Area (m 3 /a) Total Runoff Volume (m 3 /a) Total Infiltration Volume (m 3 /a) East Draft Plan - Existing Land Use Grass Area Solid Path Building Gravel Area Ponds Woodlot Wetland Feature 661, , , ,583 92,380 75,583 27, , , , , , , , , , ,559 2, , , , , ,879 0 Wetland 11, , , ,268 1,550 1,268 Woodlot 32, , , ,342 3,553 4,342 TOTAL PRE-DEVELOPMENT 761,700 54,750 39, ,950 97,783 81, ,479 81,440 East Draft Plan - Post-Development Land Use Residential - Single Detached/Laneway Homes Residential - Town Homes Residential - Stacked Towns Block School Stormwater Management Pond Blocks ROW Parks Open Space Reserved Block 303, , , , , , ,122 14,644 66, , ,903 15, , ,930 38,833 1,930 14, , ,405 1, , , , ,013 5, , , , ,765 6, , , , ,871 75, , ,615 99,487 9,615 39, , , ,976 4,976 4,976 1, , Woodlot Wetland Feature TOTAL POST- DEVELOPMENT Wetland 11, , , ,268 1,550 1,268 Woodlot 32, , , ,342 3,553 4, , , , ,780 38,180 38, ,195 38,688 % Change from Pre to Post Effect of development (with no mitigation) 2.7 times increase in runoff 52% reduction in infiltration * data provided by the mbtw group To balance pre- to post-, ** data provided by Stantec the infiltration target (m 3 /a)= 42,752 *** figures from Tables H-1 and H-2 Table H-4
214 WATER BALANCE CALCULATIONS th Avenue, Markham PROJECT No TABLE H-5a Water Balance - WEST DRAFT PLAN BERCZY CATCHMENT AREA - Existing Conditions and Post-Development (no mitigation) th Avenue, Markham Catchment Area Approx. Land Area* (m 2 ) Estimated Impervious Fraction for Land Use** Estimated Impervious Area (m 2 ) Runoff from Impervious Area*** (m/a) Runoff Volume from Impervious Area (m 3 /a) Estimated Pervious Area (m 2 ) Runoff from Pervious Area*** (m/a) Runoff Volume from Pervious Area (m 3 /a) Infiltration from Pervious Area*** (m/a) Infiltration Volume from Pervious Area (m 3 /a) Total Runoff Volume (m 3 /a) Total Infiltration Volume (m 3 /a) West Draft Plan Berczy Catchment Area - Existing Land Use Grass Area 371, , , ,419 51,845 42,419 Solid Path 7, , , ,438 0 Gravel Area Ponds 1, , TOTAL PRE- DEVELOPMENT 380,700 9,000 6, ,700 51,901 42,464 58,426 42,464 West Draft Plan Berczy Catchment Area - Post-Development Land Use Residential - Single Detached/Laneway Homes 146, , ,946 55, , ,076 73,022 7,076 Residential - Town Homes or Laneway Homes Residential - Mid-rise or Town Homes Stormwater Management Pond Blocks 24, , ,846 5, , , , ,539 1, , , , ,310 1, , ROW 86, , ,603 32, , ,072 43,675 4,072 Parks 27, , , ,478 3,478 3,478 Open Space 65, , , ,251 8,251 8,251 TOTAL POST- DEVELOPMENT 380, , , ,653 23,947 23, ,191 23,947 % Change from Pre to Post Effect of development (with no mitigation) 2.8 times increase in runoff 44% reduction in infiltration * data provided by the mbtw group To balance pre- to post-, ** data provided by Stantec the infiltration target (m 3 /a)= 18,517 *** figures from Tables H-1 and H-2 Table H-5a
215 WATER BALANCE CALCULATIONS th Avenue, Markham PROJECT No TABLE H-5b Water Balance - WEST DRAFT PLAN BRUCE CATCHMENT AREA - Existing Conditions and Post-Development (no mitigation) th Avenue, Markham Catchment Area Approx. Land Area* (m 2 ) Estimated Impervious Fraction for Land Use** Estimated Impervious Area (m 2 ) Runoff from Impervious Area*** (m/a) Runoff Volume from Impervious Area (m 3 /a) Estimated Pervious Area (m 2 ) Runoff from Pervious Area*** (m/a) Runoff Volume from Pervious Area (m 3 /a) Infiltration from Pervious Area*** (m/a) Infiltration Volume from Pervious Area (m 3 /a) Total Runoff Volume (m 3 /a) Total Infiltration Volume (m 3 /a) West Draft Plan Bruce Catchment Area - Existing Land Use Grass Area 462, , , ,869 64,618 52,869 Solid Path 10, , , ,613 0 Buildings Gravel Area Ponds 23, , , ,111 0 Woodlot 48, , , ,493 5,313 6,493 TOTAL PRE- DEVELOPMENT Residential - Single Detached/Laneway Homes 545,800 34,620 25, ,180 69,987 59,409 95,088 59,409 West Draft Plan Bruce Catchment Area - Post-Development Land Use 92, , ,582 35, , ,462 46,043 4,462 Residential - Town Homes 19, , ,719 4, , or Laneway Homes Residential - Mid-rise or 34, , ,280 2, , Town Homes Stormwater Management 17, , ,681 1, , Pond Blocks ROW 60, , ,693 22, , ,869 30,563 2,869 Parks 3, , Open Space 264, , , ,626 33,626 33,626 Ponds 4, , , ,335 0 Woodlot 48, , , ,493 5,313 6,493 TOTAL POST- DEVELOPMENT 545, , , ,653 47,793 48, ,082 48,973 * data provided by the mbtw group To balance pre- to post-, times increase in runoff 18% reduction in infiltration ** data provided by Stantec the infiltration target (m 3 /a)= 10,435 *** figures from Tables H-1 and H-2 % Change from Pre to Post Effect of development (with no mitigation) Table H-5b
216 WATER BALANCE CALCULATIONS th Avenue, Markham PROJECT No TABLE H-6 Pre- and Post-Development Monthly Water Balance Components Based on Thornthwaite's Soil Moisture Balance Approach with a Soil Moisture Retention of 125 mm (urban lawns in silt soils) with Amended Soils Precipitation data from Toronto Buttonville Climate Station ( ) Potential Evapotranspiration Calculation JAN FEB MAR APR MAY JUN JUL AUG SEP OCT NOV DEC YEAR Average Temperature (Degree C) <--From Environment Canada Heat index: i = (t/5) Unadjusted Daily Potential Evapotranspiration U (mm) Adjusting Factor for U (Latitude 43 o 52' N) <--From J. M. Lorente (1961). pp. 206 Adjusted Potential Evapotranspiration PET (mm) COMPONENTS JAN FEB MAR APR MAY JUN JUL AUG SEP OCT NOV DEC YEAR Precipitation (P) <--From Environment Canada Potential Evapotranspiration (PET) P - PET Change in Soil Moisture Storage Soil Moisture Storage max 125 mm Actual Evapotranspiration (AET) Soil Moisture Deficit max 125 mm Water Surplus - available for infiltration or runoff Potential Infiltration (based on MOECC metholodogy*; independent of temperature) Potential Direct Surface Water Runoff (independent of temperature) IMPERVIOUS AREA WATER SURPLUS Precipitation (P) 853 mm/year 15%) 128 mm/year P-PE (surplus available for runoff from impervious areas) 725 mm/year Assume January storage is 100% of Soil Moisture Storage Soil Moisture Storage 125 mm <-- See "Water Holding Capacity" values in Table 3.1, MOE SWMPDM, 2003 *MOECC SWM infiltration calculations topography - graded land 0.2 <-- Infiltration Factors from the bottom section of Table 3.1, MOE SWMPDM, 2003 soils - silt soils + additional topsoil depth 0.25 <-- Infiltration Factors from the bottom section of Table 3.1, MOE SWMPDM, 2003 cover - urban lawns 0.1 <-- Infiltration Factors from the bottom section of Table 3.1, MOE SWMPDM, 2003 Infiltration factor 0.55 Latitude of site (or climate station) 43 O N. Table H-6
217 WATER BALANCE CALCULATIONS th Avenue, Markham PROJECT No TABLE H-7 Water Balance - EAST DRAFT PLAN AREA - Existing Conditions and Post-Development with Mitigation (LIDs) th Avenue, Markham Catchment Area Approx. Land Area* (m 2 ) Estimated Impervious Fraction for Land Use** Estimated Impervious Area (m 2 ) Runoff from Impervious Area*** (m/a) Runoff Volume from Impervious Area (m 3 /a) Estimated Pervious Area (m 2 ) Runoff from Pervious Area*** (m/a) Runoff Volume from Pervious Area (m 3 /a) Infiltration from Pervious Area*** (m/a) Infiltration Volume from Pervious Area (m 3 /a) Total Runoff Volume (m 3 /a) Total Infiltration Volume (m 3 /a) East Draft Plan - Existing Land Use Grass Area Solid Path Building Gravel Area Ponds Woodlot Wetland Feature 661, , , ,583 92,380 75,583 27, , , , , , , , , , ,559 2, , , , , ,879 0 Wetland 11, , , ,268 1,550 1,268 Woodlot 32, , , ,342 3,553 4,342 TOTAL PRE-DEVELOPMENT 761,700 54,750 39, ,950 97,783 81, ,479 81,440 East Draft Plan - Post-Development Land Use Residential - Single Detached or Laneway Homes Residential - Town Homes Residential - Stacked Towns Block Less Rear Yards and Roof Areas (described below) Rear Yard Amended Soils Roof to Grass - 25% infiltration Roof to Infiltration - designed for 25 mm storm (~ 93% of total rainfall) Roof to Enclave - designed for 25 mm storm (~ 93% of total rainfall) Roof to Area E in West Draft Plan Less Rear Yards and Roof Areas (described below) Rear Yard Amended Soils Roof to Grass - 25% infiltration Roof to Infiltration - designed for 25 mm storm (~ 93% of total Less Roof Areas (described below) Roof to Infiltration - designed for 25 mm storm (~ 93% of total rainfall) Roof to Area E in West Draft Plan Less Roof Areas (described below) Roof to School Infiltration - designed for 25 mm storm (~ 93% of total Stormwater Management Pond Blocks ROW Parks Open Space Reserved Block 223, , ,005 80, , , ,193 10,187 35, , , ,901 4,010 4,901 33, , ,999 NA NA NA NA NA 17,999 6,000 7, , ,510 NA NA NA NA NA 386 5, NA NA NA NA NA , , ,320 NA NA NA NA NA , , ,264 14, , ,830 30,094 1, , , NA NA NA NA NA , , ,686 NA NA NA NA NA 538 7,148 3, , ,978 1, , , , ,090 NA NA NA NA NA 426 5,664 1, , ,341 NA NA NA NA NA , , ,950 5, , , , ,063 NA NA NA NA NA 634 8,429 68, , ,765 6, , , , ,871 75, , ,615 99,487 9,615 39, , , ,976 4,976 4,976 1, , Woodlot Wetland Feature Wetland 11, , , ,268 1,550 1,268 Woodlot 32, , , ,342 3,553 4,342 TOTAL POST-DEVELOPMENT 761, , , ,775 37,724 39, ,874 72,350 % Change from Pre to Post Effect of development (with mitigation) 2.4 times increase in runoff 11% reduction in infiltration * data provided by the mbtw group To balance pre- to post-, ** data provided by Stantec the infiltration target (m 3 /a)= 9,089 *** figures from Tables H-1 and H-2 Table H-7
218 WATER BALANCE CALCULATIONS th Avenue, Markham PROJECT No TABLE H-8a Water Balance - WEST DRAFT PLAN BERCZY CATCHMENT AREA - Existing Conditions and Post-Development with Mitigation (LIDs) th Avenue, Markham Catchment Area Approx. Land Area* (m 2 ) Estimated Impervious Fraction for Land Use** Estimated Impervious Area (m 2 ) Runoff Runoff from Volume from Impervious Impervious Area*** (m/a) Area (m 3 /a) Estimated Pervious Area (m 2 ) Runoff from Pervious Area*** (m/a) Runoff Volume from Pervious Area (m 3 /a) Infiltration from Pervious Area*** (m/a) Infiltration Volume from Pervious Area (m 3 /a) Total Runoff Volume (m 3 /a) Total Infiltration Volume (m 3 /a) West Draft Plan Berczy Catchment Area - Exising Land Use Grass Area Solid Path Gravel Area Ponds TOTAL PRE-DEVELOPMENT 371, , , ,419 51,845 42,419 7, , , , , , ,700 9,000 6, ,700 51,901 42,464 58,426 42,464 West Draft Plan Berczy Catchment Area - Post-Development Land Use Residential - Single Detached or Laneway Homes Residential - Town Homes or Laneway Homes Residential - Stacked Towns Block Less Rear Yards and Roof Areas (described below) Rear Yard Amended Soils Roof to Grass - 25% infiltration Roof to Infiltration - designed for 25 mm storm (~ 93% of total rainfall) Roof to Enclave - designed for 25 mm storm (~ 93% of total rainfall) Less Rear Yards and Roof Areas (described below) Rear Yard Amended Soils Roof to Grass - 25% infiltration Stormwater Management Pond Blocks ROW Parks Open Space Roof to Infiltration - designed for 25 mm storm (~ 93% of total rainfall) Less Roof Areas (described below) Roof to Infiltration - designed for 25 mm storm (~ 93% of total rainfall) 94, , ,721 39, , ,054 44,775 5,054 15, , , ,220 1,816 2,220 17, , ,616 NA NA NA NA NA 9,462 3,154 11, , ,084 NA NA NA NA NA 566 7,518 7, , ,510 NA NA NA NA NA 386 5,125 12, , ,848 3, , , , , , ,248 NA NA NA NA NA 1, , , ,764 NA NA NA NA NA 403 5,361 6, , ,806 1, , , , ,728 NA NA NA NA NA 401 5,327 15, , ,310 1, , , , ,603 32, , ,072 43,675 4,072 27, , , ,478 3,478 3,478 65, , , ,251 8,251 8,251 TOTAL POST- DEVELOPMENT 380, , , ,661 23,723 24, ,915 51,219 % Change from Pre to Post Effect of development (with mitigation) 2.3 times increase in runoff 21% increase in infiltration * data provided by the mbtw group To balance pre- to post-, ** data provided by Stantec the infiltration target (m 3 /a)= -8,755 *** figures from Tables H-1 and H-2 Table H-8a
219 WATER BALANCE CALCULATIONS th Avenue, Markham PROJECT No TABLE H-8b Water Balance - WEST DRAFT PLAN BRUCE CATCHMENT AREA - Existing Conditions and Post-Development with Mitigation (LIDs) th Avenue, Markham Catchment Area Approx. Land Area* (m 2 ) Estimated Impervious Fraction for Land Use** Estimated Impervious Area (m 2 ) Runoff Runoff from Volume from Impervious Impervious Area*** (m/a) Area (m 3 /a) Estimated Pervious Area (m 2 ) Runoff from Pervious Area*** (m/a) Runoff Volume from Pervious Area (m 3 /a) Infiltration from Pervious Area*** (m/a) Infiltration Volume from Pervious Area (m 3 /a) Total Runoff Volume (m 3 /a) Total Infiltration Volume (m 3 /a) West Draft Plan Bruce Catchment Area - Exising Land Use Grass Area Solid Path Buildings Gravel Area Ponds Woodlot TOTAL PRE-DEVELOPMENT 462, , , ,869 64,618 52,869 10, , , , , , , , , , , ,493 5,313 6, ,800 34,620 25, ,180 69,987 59,409 95,088 59,409 West Draft Plan Bruce Catchment Area - Post-Development Land Use Residential - Single Detached or Laneway Homes Residential - Town Homes or Laneway Homes Residential - Stacked Towns Block Less Rear Yards and Roof Areas (described below) Rear Yard Amended Soils Roof to Grass - 25% infiltration Roof to Infiltration - designed for 25 mm storm (~ 93% of total rainfall) Less Rear Yards and Roof Areas (described below) Rear Yard Amended Soils Roof to Grass - 25% infiltration Stormwater Management Pond Blocks ROW Parks Roof to Infiltration - designed for 25 mm storm (~ 93% of total rainfall) Less Roof Areas (described below) Roof to Infiltration - designed for 25 mm storm (~ 93% of total rainfall) 54, , ,077 24, , ,165 24,241 3,165 10, , , ,424 1,165 1,424 11, , ,193 NA NA NA NA NA 6,145 2,048 17, , ,326 NA NA NA NA NA ,463 7, , ,309 4, , NA NA NA NA NA , , ,903 NA NA NA NA NA 553 7,350 23, , ,010 2, , , , ,266 NA NA NA NA NA 579 7,687 17, , ,681 1, , , , ,693 22, , ,869 30,563 2,869 3, , Open Space Ponds Woodlot TOTAL POST- DEVELOPMENT West Draft Plan Roof Runoff from East Draft Plan to Area E 264, , , ,626 33,626 33,626 NA NA NA NA NA NA NA NA NA NA 1,831 1,831 4, , , , , , , ,493 5,313 6, , , , ,640 47,656 49, ,112 79,612 % Change from Pre to Post Effect of development (with mitigation) 1.5 times increase in runoff 34% increase in infiltration * data provided by the mbtw group To balance pre- to post-, ** data provided by Stantec the infiltration target (m 3 /a)= -20,203 *** figures from Tables H-1 and H-2 Table H-8b
220 WATER BALANCE CALCULATIONS th Avenue, Markham PROJECT No TABLE H-9 Feature Based Water Balance - WOODLOT/WETLAND FEATURE - Existing Conditions and Post-Development with LIDs th Avenue, Markham Catchment Area Approx. Land Area* (m 2 ) Estimated Impervious Fraction for Land Use** Estimated Impervious Area (m 2 ) Runoff from Impervious Area*** (m/a) Runoff Volume from Impervious Area (m 3 /a) Estimated Pervious Area (m 2 ) Runoff from Pervious Area*** (m/a) Runoff Volume from Pervious Area (m 3 /a) Infiltration from Pervious Area*** (m/a) Infiltration Volume from Pervious Area (m 3 /a) Total Runoff Volume to Feature (m 3 /a) Woodlot/Wetland Feature - Existing Land Use Woodlot Wetland Feature Wetland 11, , , ,268 1,550 Woodlot 32, , , ,342 3,553 Existing External Drainage Area to Feature TOTAL PRE-DEVELOPMENT 29, , , ,393 4,147 72, ,900 9,250 9,004 9,250 Woodlot/Wetland Feature - Post-Development Land Use Woodlot Wetland Feature Wetland 11, , , ,268 1,550 Woodlot 32, , , ,342 3,553 Type B Lots Type C Lots Type E Lots Rear Yard Amended Soils Roof to Grass - 75% runoff Rear Yard Amended Soils Roof to Grass - 75% runoff Rear Yard Amended Soils Roof to Grass - 75% runoff 1, , , , ,237 NA NA NA NA NA 2, , , ,544 NA NA NA NA NA 1, NA NA NA NA NA 183 TOTAL POST-DEVELOPMENT 52,833 6,931 5,025 45,902 5,412 5,988 9,181 % Change from Pre to Post 99 Effect of development (with no mitigation) 1% decrease in runoff * data provided by the mbtw group ** data provided by Stantec *** figures from Tables H-1 and H-2 Table H-9


221 OPEN SPACE WOODLOT/WETLAND (FEATURE 1) 4.32 Ha EXISTING EXTERNAL DRAINAGE AREA TO FEATURE 2.97 Ha EXISTING DRAINAGE PLAN PROPOSED EXTERNAL DRAINAGE AREA TO FEATURE 0.90 Ha OPEN SPACE WOODLOT/WETLAND (FEATURE 1) 4.32 Ha PROPOSED DRAINAGE PLAN FIGURE 2.14 WOODLOT/WETLAND FEATURE 1 DRAINAGE PLAN August 2016