Marinette County Lower Peshtigo River Watershed Management Plan
|
|
|
- Sheena Greene
- 5 years ago
- Views:
Transcription
1 Marinette County Lower Peshtigo River Watershed Management Plan MARINETTE COUNTY S EXPERIENCES CREATING A NINE KEY ELEMENT PLAN
2 Plan Goals Learn more about the biota, environmental health, and human health risks in the watershed Reduce NPS pollution impacts on human health Deal with other environmental stressors in the watershed Minimize the risk of acute manure and runoff events and the amount of Phosphorus reaching Green Bay Provide information in support of plan goals; make the connection between land use and environmental quality Improve communication with and between producers; publicize progress and increase acceptance; improve BMP operation and maintenance

3 Watershed boundary in Upper Green Bay Basin Integrated Watershed Mgmt. Plan Watershed boundary at the WDNR Surface Water Viewer and Healthy Watershed Assessment site

4

5
6

7

8

9 From 2005 to 2015, the number of commercial farms dropped from 124 to 30

10

11
12

13 Spreadsheet Tool for Estimating Pollutant Load (STEPL) tool calculates nutrient and sediment loads from different land uses and load reductions resulting from implementation of various BMPs. It computes watershed surface runoff; nutrient loads, including nitrogen, phosphorus, and 5-day biological oxygen demand; and sediment delivery based on various land uses and management practices. The annual sediment load (sheet and rill erosion only) is based on the Universal Soil Loss Equation and the sediment delivery ratio. Sediment and pollutant load reductions are computed using known BMP efficiencies.
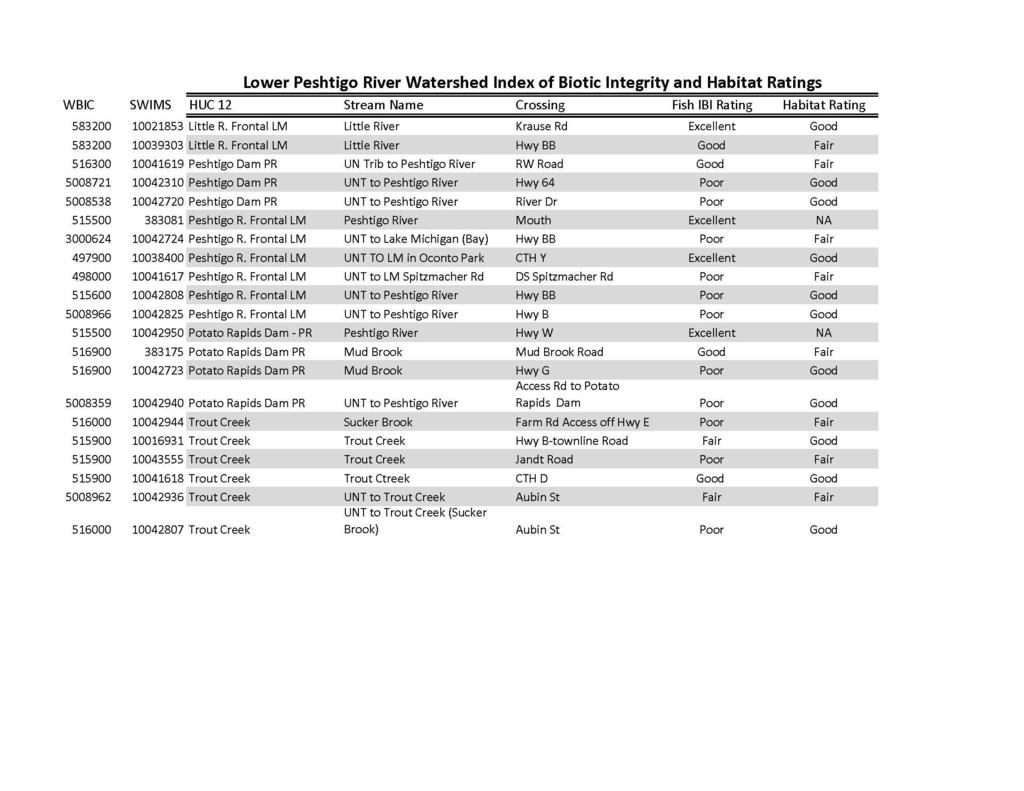
14 Figure 4-5 Estimated Reductions in Phosphorus Loads from BMP Installations HUC 12 Pre-Project P Post-Project P P Reduction % P Reduced lb/year lb/year lb/year % Gravelly Brook 5, , , % Little R. Frontal -LM 1, % Peshtigo Dam Peshtigo R. 3, , , % Peshtigo R- Frontal LM 7, , , % Potato Rapids Dam 8, , , % Thomas Slough 22, , % Trout Creek 16, , , % Total 65, , , % Figure 4-6 Estimated Reductions in Sediment Loads from BMP Installations HUC 12 Pre-Project Sediment Post-Project Sediment Sediment Reduction % Sediment Reduced t/year t/year t/year % Gravelly Brook % Little R. Frontal -LM % Peshtigo Dam Peshtigo R % Peshtigo R- Frontal LM % Potato Rapids Dam 1, % Thomas Slough 1, , % Trout Creek 1, , % Total 6, , , % The STEPL model estimates Pre-Project agricultural lands and practices will generate a total of 65,237.1 pounds of Phosphorus from 27,861 acres of cropland and feedlots. This equates to Phosphorus loads of approximately 2.34 pounds of per acre. For sediment, the same Pre-Project acres will generate a load of 0.23 Tons per acre. Upon project completion, the total cropland and feedlot phosphorus load will be reduced by 20,440.1 pounds, equating to an estimated 1.6 pounds per acre. For sediment, the estimated Post-Project load per acre is 0.15 Tons per acre.
15 Figure Planned Activities and Schedule (Plan Element 6 and 7) Goal Activity LWCD Partners and/or Funding Sources Milestone(s) Time Frame Prevention, control and eradication of Exotic Invasive Species WDNR, WRISC, NRCS, Local Gov ts One aquatic, and one terrestrial project per year 2016 to 2026 Deal with other environmental stressors in the watershed Prevent and/or repair fish passage problems Proper Culvert Installations Repair blockages USFWS, Local Gov ts Installation Workshop One per year 2019, 2023 As resources are obtained Restore wetland habitat, especially Northern Pike spawning and nursery areas WDNR, NRCS, USFWS, GLRI One project per year As willing landowners and funding are found
16 What I learned Get with the plan approval folks earlier than I did Look at approved NKE plans from similar counties, but not too closely Know what you don t know Don t be afraid to ask for help Models are only as good as the data you have put into them
17 Any questions?
18 Plan requirements 1. Identification of impairment causes and pollutant sources. 2. Estimate of the load reductions expected from management measures. 3. Critical area descriptions and the management measures needed to achieve element 2 load reductions. 4. Technical and financial assistance needed, costs and/or sources, and authorities relied upon. 5. Information and education component to enhance public understanding of the plan and encourage participation.. 6. A reasonably expeditious implementation schedule for management measures identified in this plan. 7. A description of measurable milestones for determining whether management measures are being implemented. 8. Criteria to determine loading reductions are being achieved and substantial progress is being made. 9. Component to evaluate the implementation effectiveness, measured against element 8 criteria.
19
20
21 Plan Element Existing Staff working on Agricultural Non-Point Source pollution What needs to be done Applying for grants, administering existing programs, designing and supervising BMP s installation, O&M and compliance checks Yearly Estimated Resources Needed 1 Source $115,087 DATCP, LWCD End winter spreading of Manure Ensure compliance with new NRCS 590 standard Ensure farms are not a pollution source or safety risk when operations cease Investigate individual catchments given low scores by the Healthy Watershed Assessment (HWA) Tool Habitat protection and restoration Repair impaired catchments identified by the HWA Human health protection Run EVAAL assessment on the watershed All education efforts Incorporate 2014 and 15 monitoring data into plan implementation Surface and ground water monitoring Install manure storage facilities and associated practices All watershed crop land under fully implemented nutrient management plans Properly: abandon hard practices; decommission abandoned wells; $400,000 in cost sharing $56K cost sharing; add at least a half time ($54 - $107K) nutrient management planner WDNR, NRCS, DATCP, GLRI, LWCD NRCS, DATCP, LWCD $15,000 DATCP, NRCS, LWCD Participate in Clean Sweeps as offered $12,000 DATCP, LWCD Verify conditions are as modeled; determine corrective measures needed Completed by current staff DATCP, LWCD Repair fish passage issues $15,000 USFWS,?? Restore habitat $10,000 NRCS, WDNR Investigation, obtain resources; train staff if necessary; implement prescribed actions Systematically monitor private wells and map data Incorporate LiDAR into County GIS, train staff on EVAAL, gather additional data as required NWJ, direct mailings, workshops, website, social media Complete data gathering; obtain results; organize and analyze data Phosphorus monitoring, aquatic insect, and fish IBI s, well water testing Totals $5,000 - $30,000 $2,000 - $5,000 WDNR, DATCP, USFWS, GLRI, LWCD, Landowners, LWCD, UWSP, Local Gov ts $10,000 for three years DATCP, LWCD $4,000 LWCD, DATCP,?? Completed by current staff DNR, LWCD $11,000 DNR, LWCD $709K to $790K for first year; there should be a significant drop in costs after year three as initial mapping, auditing, modelling, etc. are completed