Energy & Sustainability. Lecture 10: Electric Power Generation And Distribution February 10, 2009
|
|
|
- Bruno Pope
- 5 years ago
- Views:
Transcription


1 Energy & Sustainability Lecture 10: Electric Power Generation And Distribution February 10, 2009
2 Running the system The tasks of a grid: technical control: keeping the grid voltage and frequency within tight specific limits Keeping supply and demand matched at all times Keeping the lights on and carrying out a black start in the event of a grid failure Optimizing resources in the supply of electricity
3 The Grid Tasks: A few more words Example: If customers switch on more lights and the demand goes up the voltage falls as a result. This is sensed by an automatic control and more steam will be be put through a turbine in the plant to hold the voltage up to the required level ( ad 1 and 2) Remark: The first three tasks are largely a matter of engineering, the fourth is a problem that has challenged the minds of engineers, economists and politicians.
4 4. Optimizing resources in the supply of electricity: What is being optimized? The environmentalist: The whole system would need to be run to minimize pollution, but doing so at a reasonable cost (embedded or distributed generation, small scale CHP, electricity conservation etc) The free marketeer: Electricity is just a product and the aim is to maximize sales at minimum financial costs through a competitive market while obeying any pollution regulations by the government ( leave it to the market ) The middle: Long history of state involvement, optimization requires taking into account not just fuel costs, capital expenditure and the consequences of anti pollution legislation, but also wider notions of national self sufficiency and expectations of economic growth

5 CHP: Combined Heat and power Electricity generation process produces very large amounts of low temperature waste heat Small scale CHP: e.g. small reciprocating engine at a hospital or large hotel, lower electricity generation efficiency than large power stations, but ability to use waste heat makes it more energy efficient overall Large scale CHP with community heating: distribute waste heat as hot water from existing or specially adapted power stations via thermally insulated pipes to local buildings. Producing water at sufficiently high temperature (85 95 deg) does involve some losses in electricity generation efficiency but this is made up for by large amounts of useful heat
6 Another optimization: The power plant A modern 660 MW turbine in a plant uses steam at 600 deg C and 250 atm pressures This requires the use of expensive high quality steel in the boiler and turbine blades Since 1960s: most large stations in the US have limited temperatures to below 550 deg C and pressures to 160 atm > long station life with cheaper steel Matter of a trade off of energy efficiency against the capital costs of a plant
7 The Electricity System In the US: Organized on a state by state bases Privately owned utilities and generators Publicly appointed regulators Centrally controlled power pool (spot market): an hour by hour competitive market How it should work: Computer models estimate what the demand will be in the next few hours and invites bids Power station owners reply Cheapest offer accepted System adjusted to bring the appropriate stations online

8 California electricity crisis Energy prices were regulated This forced suppliers to ration their electricity supply rather than expand production. Utilities had no financial incentive to expand production, as long term price were capped. Peak demand continued to rise California passed partial deregulation (under Gov. Wilson) Investor Owned Utilities, IOUs, had to sell off a significant part of their power generation to wholly private, unregulated companies such as Enron. They got offers well above the market price The buyers of those power plants then became the wholesalers from which the utilities needed to buy the electricity that they used to own themselves.
9 What was the point of It was intended to lower prices Deregulation The idea was to make sure that there would be competition for the California energy market. The legislators expected that many suppliers would crowd into the California market, build or acquire power plants, and attempt to sell energy. And it was that competition that held out the promise of lowered electricity costs What they didn t count on: People must have electricity to live, so they will pay almost any price, no matter how outrageous, to make sure they have the electricity they need. The California bidding process was designed to develop a competitive generation market and take advantage of a surplus of power. Unfortunately, this bidding system produces extremely high prices when generation resources are in short supply
10 By the end of 2000, no new power plants had been built in California for a decade The population was rocketing upward, economic activity had picked up, and only 3000 MW of power plants had been built in the 1990s, during a time while demand in the region went up by 12,000 MW To make matters worse there was a century drought in the Pacific Northwest The extended Pacific Coast drought led to a 2001 river flow that was as low as any in the last 25 years, Columbia River dams have typically supplied California with about 10% of its energy in a typical summer

11 Columbia River Dams
12 California electricity crisis Energy prices from out of state were unregulated Companies created shortages to force utilities to buy peak power at outrageous prices Wholesalers such as Enron manipulated the market to force utility companies into daily spot markets by creating shortages The Federal Energy Regulatory Commission (FERC) was supposed to prevent market manipulation and price manipulation of energy market, but they didn t. They used a technique known as megawatt laundering, wholesalers bought up electricity in California at below cap price to sell out of state, creating shortages. In some instances, wholesalers scheduled power transmission to create congestion and drive up prices.
13 California electricity crisis! 1996! California begins to loosen controls on its energy market and takes measures to increase competition.! April 1998 Spot market for energy begins operation.! May 2000 "! June 14, 2000! Significant energy price rises.! Blackouts affect 97,000 customers in San Francisco Bay area during a heat wave.! August 2000! San Diego Gas & Electric Company files a complaint alleging manipulation of the markets.! January 17-18, 2001! Blackouts affect several hundred thousand customers.!
14 California electricity crisis January 17-18, 2001 " Blackouts affect several hundred thousand customers.! January 17, 2001! March 19-20, 2001! April 2001! May 7-8, 2001! Governor Davis declares a state of emergency.! Blackouts affect 1.5 million customers.! Pacific Gas & Electric Co. files for bankruptcy.! Blackouts affect upwards of 167,000 customers.!
15 California electricity crisis September 2001 " "! Energy prices normalize.! December 2001! February 2002! Winter 2002! November 13, 2003! Following the bankruptcy of Enron, it is alleged that energy prices were manipulated by Enron.! Federal Energy Regulatory Commission begins investigation of Enron's involvement.! The Enron Tapes scandal begins to surface.! Governor Davis ends the state of emergency.!
16 Price Manipulation Average marginal production costs of electricity is ~ $20 $30/MWHr (2 3 cents/kwhr) Electricity typically sold for ~$40/MWHr (transmission and other cost drive it up to the typical $100/MWHr we pay as consumers) California law was set up so the last energy sold determined the price paid for all the energy purchased from all the suppliers! Utilities took units offline and forced IOUs to buy spot power: All of a sudden on July 9, 1998, the cost went to $2,500, then to $5,000/MWHr. Three hours later, it returned to its original cost. On July 13, the price rose to $9,999 for four hours before falling (profit during those 4hrs was 1,000 times normal > 6mo profit in 4 hrs) This was basically all due to manipulation (as later determined by the federal government)
17 October 2002 Former Enron director was charged in a San Francisco court with submitting false trading information and bids to the officials who ran the California power market and electricity grid Pleaded guilty to conspiracy to commit fraud, paid $2.1 million Told the judge he did it to maximize profit for Enron. Estimates: California was overcharged by $9 billion

18 Example of Correlated Demand
19 Pumped Storage Hydroelectricity Grid energy storage: electric energy producers send excess electricity over the grid to temporary electricity storage sites Temporary storage sites become electricity producers when demand is greater Production optimization by storing off peak power for use during peak times Different ways of storing energy: Batteries, compressed air, thermal, flywheels, superconducting magnets, pumped water Example: Photovoltaic Cells and Wind turbines can be connected to the grid instead of a local battery using the grid as a giant battery

20 Capacity Factor and Demand
21 Balancing Supply and Demand: Merit Order Base load: lowest running costs, usually nuclear or large coal fired stations (>600 MW), thermal efficiency of ~ 40%, but takes 8 hours to ramp up Middle merit order or intermediate: smaller coalfired stations with lower thermal efficiencies Peaking plants: simple gas turbines, thermal efficiency under 30%, possible fuels (natural gas or kerosene) are likely to be more expensive, but can be ramped up in the matter of minutes
22 Another example : Large Nuclear or Coal Fired Power Plant Run at full power 24/7 The cheap nightly electricity is used by a pumped storage hydroelectric power plant to push water hundreds of feet uphill, from a lower storage lake to an upper storage lake Pumped storage water plant becomes producer of electricity when releasing water downhill through a turbine When? In the afternoon, when demand goes up or whenever rapid adjustments are needed


23 Canadian Load Durations US has less hydro as a fraction and more nuclear in our baseload
24 Pumped storage hydroelectricity Over 90 GW of pumped storage in operation, or 3% of the global generation capacity Pumped storage recovers about 75% of the energy consumed (exposed water surface, conversion losses Currently the most effective form of mass storage Problems: location, requires two nearby reservoirs at considerable height Considerable capital expenditure

25 Pumped storage hydroelectricity More common than pumped storage: traditional hydroelectric dam: Release is delayed until needed Net effect the same, but without the round trip efficiency loss Example: Hoover dam output capacity of 1.3 GW

26 Pumped storage hydroelectricity Another example: Three Gorges Dam in China Construction started in 1994, to become fully operational in 2011 Damming the Yangtze river: length 2,335 m, height 101 m Costs: estimated $39 billion Capacity: 18 GW Social and environmental impacts: highly controversial (relocation of 2 million people)

27 Pumped storage hydroelectricity New concept: energy storing wind dam

28 Pumped storage hydroelectricity Diagram of the TVA power plant at Racoon Mountain. It is an underground power station in Marion County, just west of Chattanooga, Tennessee. The plant has a capacity of 1600 MW of electricity and can generate for a up to 22 hours
29 Work, Potential, and Kinetic Energy Force: F = m a, m: mass, a: acceleration Gravitational Force: W = m g, W: weight, m: mass, g = 9.81 m s 2 10 m s 2, acceleration due to gravity Work: W = force distance change in potential energy, when raising an object: work = force distance = W H = m g H, H: height Energy conservation: potential energy lost by a freely falling object appears as gain in kinetic energy, so an object that falls from rest (zero kinetic energy) through a height H will acquire kinetic energy equal to m g H Kinetic energy: ½ mv 2 = mgh
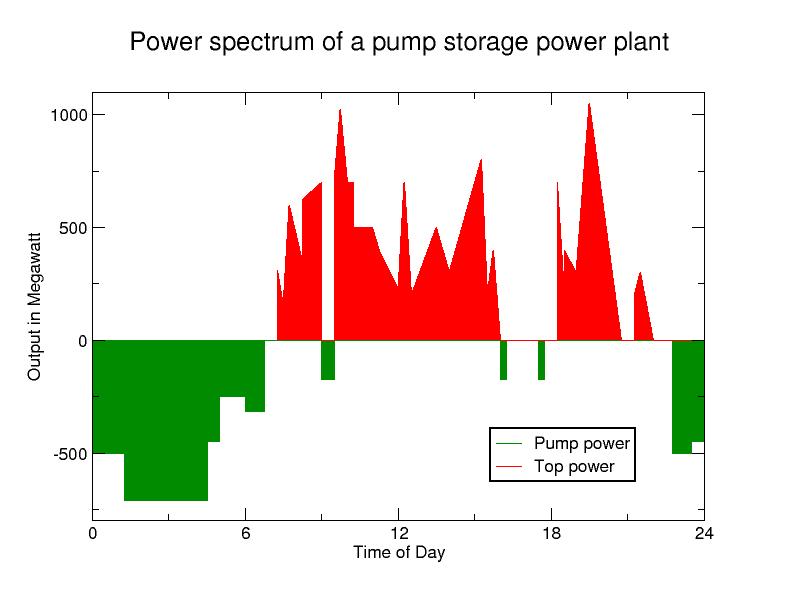
30 Pumped storage hydroelectricity
31 Pump storage in the US and Europe US 2000 : 19.5 GW storage capacity, 2.5 % of baseload generation capacity EU 1999: 32 GW capacity, 5.5 % of total electrical capacity