Cost Savings from Operational Energy Efficiency: A Case Study from WCSU. Tom Arnold Vice President, Energy Efficiency & Carbon Solutions
|
|
|
- Tyler Austen French
- 5 years ago
- Views:
Transcription

1 Cost Savings from Operational Energy Efficiency: A Case Study from WCSU Tom Arnold Vice President, Energy Efficiency & Carbon Solutions 1
2 EnerNOC Overview Founded in 2001, EnerNOC provides energy solutions that save money, reduce energy usage, and mitigate energy risk. Our customers save 10-20% off their annual energy spend. Demand Response Over 3,000 MW of demand response capacity from over 5,000 customer sites. Full service solutions provider with many flexible programs that bridge Utility and Grid Operator needs with C&I Customer capabilities Operational Energy efficiency Monitoring Based Commissioning (MBCx) Real time energy visibility for the enterprise Energy Procurement Services and peak billing management Significant resources Human capital Deep management team experience in energy and technology management over 350 employees Financial Strong balance sheet and impressive financial track record; publicly traded on the U.S. NASDAQ (ENOC) as of May 18,

3 3


4 You ve Probably Heard All This Before Closing our national electric productivity gap could curtail up to 30% of our power consumption. - Rocky Mountain Institute The average commercial building uses 26% more energy than needed. - DOE / Energy Star Less than 5% of commercial buildings in the US are actually commissioned after construction. - BCS Partners 4
5 Common Barriers We Hear From Clients We hear (and are focused on solving) the following barriers to operational energy efficiency at C&I sites: Resources & Workflow Inadequate resources to continuously watch over energy usage Time and performance management are focused on reactive maintenance calls No organized workflow focused on Energy Efficiency Technology Metering and Building Management Systems not integrated No data to view and analyze all of energy cost drivers Long feedback cycle from changes to measurable/viewable results Business Model Lack of capital to invest in upfront capex projects, even at controls levels But, limited success and trust of the Performance Contracting model 5

6 Beta Case Study Western Connecticut State University WCSU spends over $2m/year on energy. They were initially skeptical that significant savings could be achieved through MBCx but were open to trying it. Two campuses, with 25 buildings: Buildings include 283,000 square feet Academic (classroom) Buildings Library Student Center Admin Building 6
7 Savings from the Approach: WCSU WCSU faced common energy management challenges, all of which were budget-busting. Energy Costs: CT energy prices spiked by 40% in 2006, busting the budget. Scope: Two campuses with 25 buildings for a total of 283,000 square feet. Lack of Visibility: No site-specific reporting of energy use/profile to perform building-to-building or year-to-year comparisons. Lack of Integration: Disparate systems monitoring building energy usage, no integrated platform. Lack of Support: University understaffed, so a detailed evaluation of the BMS not a priority. Shrinking budget, capital expenditures hard to justify. Ideal Opportunity for Monitoring-Based Commissioning 7
8 What is EnerNOC MBCx? MBCx combines advanced metering technology with sophisticated analysis software to provide actionable insights. MBCx seamlessly integrates data from disparate energy management systems and provides a clear window into overall energy use. Advanced filtering technology processes energy-related data to identify potential opportunities for efficiency. MBCx energy analysts review data to provide a set of clear and actionable recommendations helping reduce energy consumption, prioritize maintenance issues and enhance occupant comfort. Customer Energy Scorecard & Recommendations Facilities Recommendations 8
9 MBCx Goes Beyond Retro-Commissioning Unlike retro-commissioning, which heavily depends on a boots-on-the-ground approach, MBCx focuses on technological innovation to generate value. Energy Savings Operational Impact Retro-Commissioning One-time effort No M&V beyond Commissioning Popped tiles, sensors, dirty boots EnerNOC MBCx Constant Commissioning Integrated M&V One time walkthrough and audit, then all remote Data Set Temporary Samples Permanent & Exhaustive Economics Energy Visibility Upfront investment Only high priority problem buildings are addressed None Monthly Fee Shared savings pricing means covers entire facilities Integration with meter data, full campus visibility for workflow prioritization 9
10 10

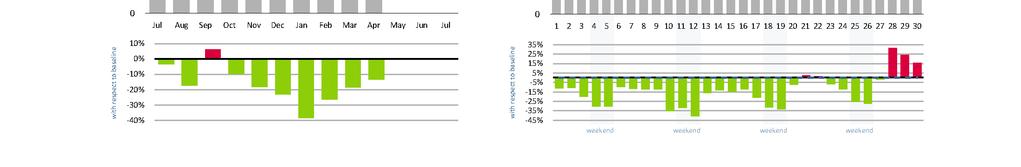
11 Examples Air Handling Schedules Facility managers often don t have the time to identify maintenance issues like equipment operating during off-hours. Increased costs are an undetected result. In this example, the change in schedule represents an annual savings of $21,000 and 102-Metric Tons of CO 2 avoidance. Savings Category: No Cost Action Recommended: Enable auto-control. This unit was habitually overridden, but from continuous monitoring, each incidence was caught with minimal loss in energy savings. As a result of this measure new protocols were established for requesting off-hours usage to further limit this issue from re-occurring. 11
12 Continuous application of commissioning assures permanence, higher savings 125% 120% Recomissioning (without MBCx) Normalized Energy Usage 115% 110% 105% 100% 95% Traditional, periodic recomissioning Monitoring-Based Comissioning (MBCx) Lost Opportunity 90% Time 12


13 Commissioning getting national policy attention You can imagine real time commissioning in the same sense that a microprocessor is constantly tuning a modern engine. It notices what the temperature of the engine is, the temperature of the air, and its constantly tuning up Just like your garage mechanic can t tune your car anymore.. its ok, you take it in, the computers talk to each other and everybody s happy -Steven Chu Compton Lecture at MIT, May 13,

14 14
15 Examples Chilled Water Reset A chiller will often show the ΔT of supply and return to be, at best, 6ºF and on average 3ºF. Optimizing ΔT for varying occupancy creates significant efficiencies. Chilled Water ΔT % 10% 20% 30% 39% 49% 59% 69% 79% 88% 98% % of Run-Hours in the Month In this example, the change in control strategy, to factor in varying occupancy throughout the year represents an annual savings (occurring over three months) of $4,500 and 21-mTons of CO 2 avoidance. Savings Category: No Cost Action Recommended: Reprogram the chiller controls to reset the supply temperature up in order to maintain the highest ΔT between the supply and the return chilled water temperatures. 15
16 EnerNOC Deliverables Filters We continuously collect and store data on a five minute basis, filter the data using proprietary technology, and serve it to our energy analysts for assessment. Global Fault Detection & Tracking Set-point Error Tracking Sensor range checking Operating parameter out of range Pinned or flat-lined sensor Actual vs. Intended Schedule Analysis Equipment Manual Override Detection Cooling Plant Chiller Performance analysis - kw/ton Optimum Chilled Water Supply Temperature Optimum Staging Optimum Condenser Water Supply Temperature Cooling Tower Fan Efficiency Low/High Temperature Differential Analysis Optimum Flow analysis Optimum Pump Utilization Optimum Thermal Storage Utilization Air Handling Units Economizer Operation Simultaneous Heating and Cooling Excessive or inadequate ventilation Demand Ventilation Air starvation Static pressure analysis Heating/Cooling Coil Efficiency Leaking Valve Optimum Start/Stop Analysis Air Filter Analysis- Dirty Filter Zones Set-point Analysis Heating Setback Cooling Set-forward Air Starvation Analysis Zone Comfort Analysis Indoor Air Quality Analysis Heating Plant Boiler Sequencing Optimization Boiler Combustion Controls Boiler Economizer Boiler Combustion Efficiency Boiler Burners Performance Boiler Blowdown Low/High Temperature Differential Analysis Boiler Efficiency Optimum Pump Utilization Terminal Units Variable Air Volume Analysis Zone Reheat VAV Box Damper Modulation Excessive Cycling Analysis 16
17 Scale and Nature of Operating EE Problem 75 B sq ft Commercial Space, 2.5M buildings above 5K sq ft A few to 50 thousands points per building 5 minute interval data Hundreds of Filters ~ 2x10 13 Records A computing problem, not a human discovery problem 17

18 18

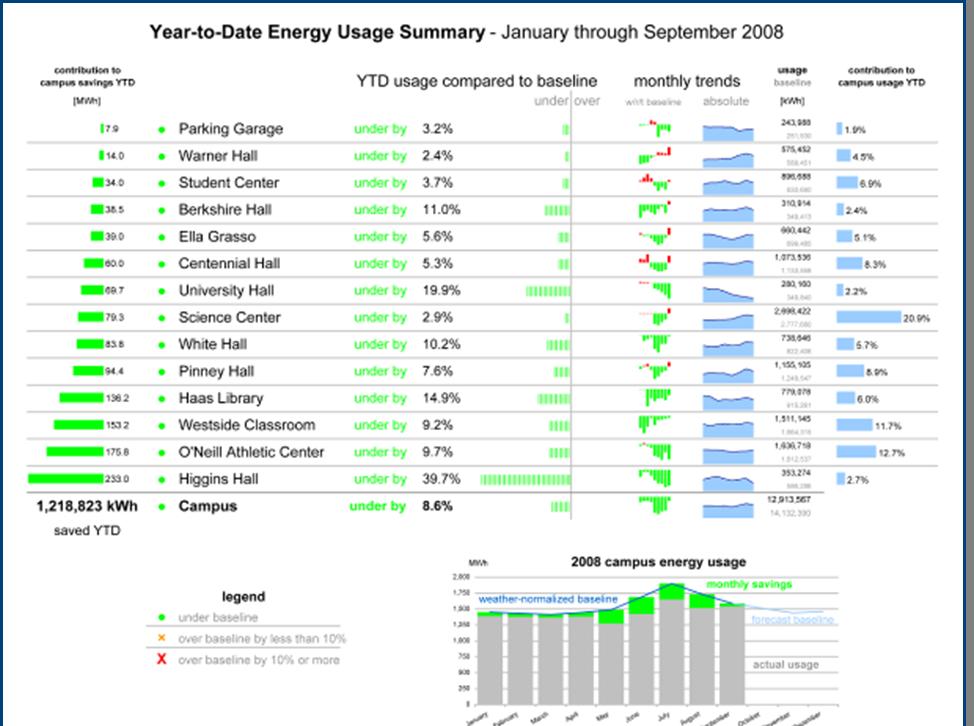
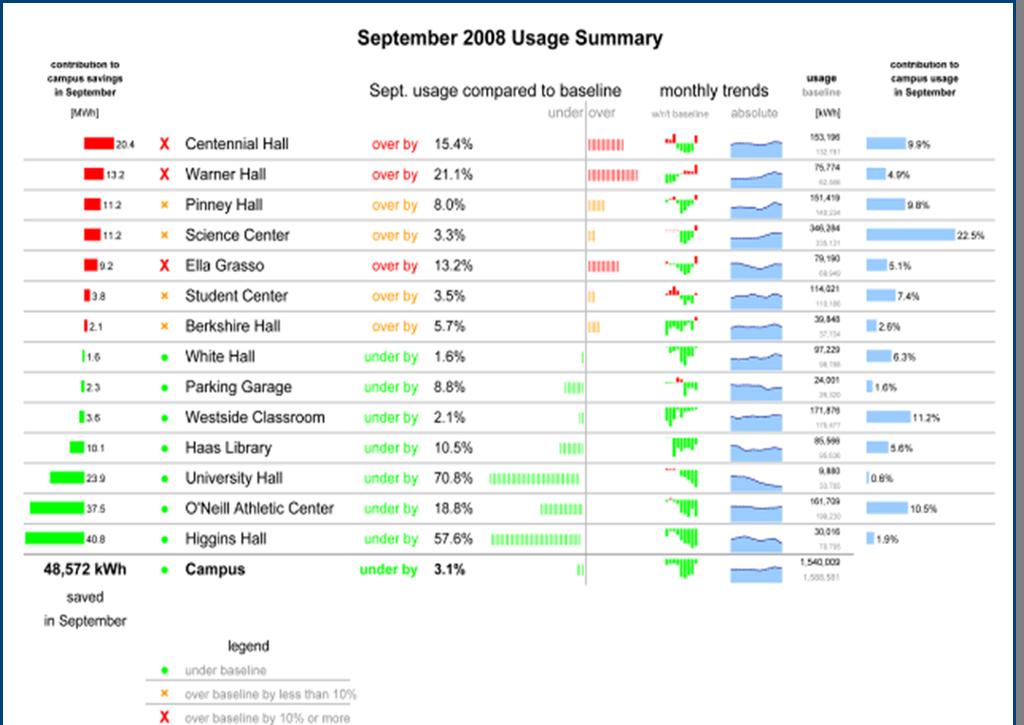
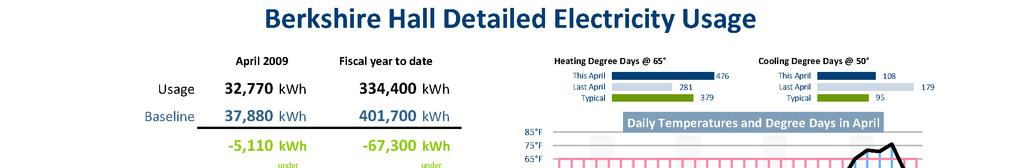
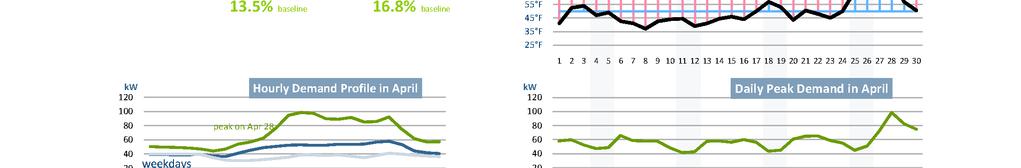
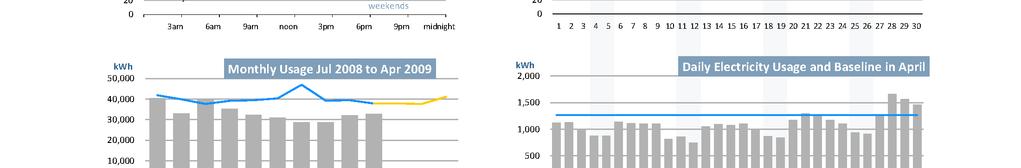
19 EnerNOC Deliverables MBCx Scorecard Opportunities are summarized in a monthly report that lets your team focus on the highest value opportunities that fit into your capital budgeting process. 19
20 20
21 21


22 22
23 23
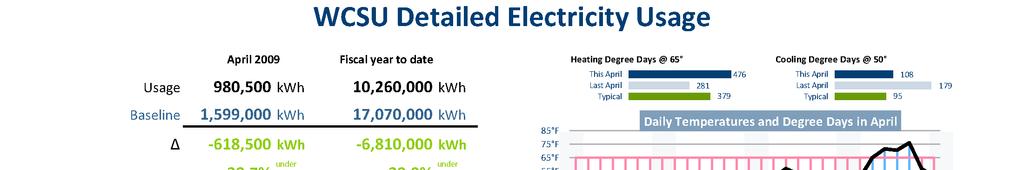
24 What MBCx can save In first 12 months WCSU identified over $275,000 in annualized energy savings 13% of annual spend. Currently at 18%. In first 12 months WCSU implemented measures with an actual M&V d savings of nearly $110,000 with an annual run rate of $170,000 8% of annual spend. To date, WCSU has saved nearly 200K therms and 900 MWh since the inception of the agreement. Operational Cost Savings $300,000 $250,000 $200,000 $150,000 $100,000 $50,000 $0 March 07 MBCx Operational Cost Savings - All Fuels Cumulative Implementation Rate: 62% April 07 May 07 June 07 July 07 Aug 07 Sept 07 Oct 07 Nov 07 Dec 07 Jan 08 Feb 08 WCSU was recognized for this effort in an award for best energy management project from the New England chapter of the Association of Energy Engineers. There was no capital outlay on the part of WCSU services were paid through deductions from Demand Response payments. 24


25 Tom Arnold Vice President, Energy Efficiency & Carbon Solutions 25