Wilbur-Ellis Company. Carl Bruice - National Nutrition Technical Manager
|
|
|
- Rebecca Gibbs
- 5 years ago
- Views:
Transcription


1 Wilbur-Ellis Company Carl Bruice - National Nutrition Technical Manager

")
 Lime deposits")
 Iron deposits")

2 Potential Effects of Water Chemistry Total salt accumulation Specific ion toxicity (B, Na, Cl) Reduced infiltration (Na and ECw) Lime deposits (aesthetics, surface crusts) Iron deposits (aesthetics) Nutrient contribution (nitrate/sulfate) Micro-irrigation systems
3 Potential Effects of Water Chemistry OVER TIME SOIL WILL REFLECT QUALITY OF IRRIGATION WATER USED ON THAT LAND
 * Valid differences in")
4 Soil and Water Reports First Step in Assessing Potential Impact * Chemistry is everyone's favorite subject Lack of clear instruction on how to effectively interpret reports Lack of instruction on how to construct effective recommendations * Too much reliance on lab interpretations * Prevalence of misinformation (suppliers, consultants) * Valid differences in opinion
5 Soil and Water Quality Are Complex and Interrelated Acidic soils Alkaline soils Sodic or alkali soils Saline soils Specific ion toxicities Physical problems How bad is bad, how to correct, how much and what to use? What problem, ph vs sodium, amendment sources, speed of response, expectations? How to interpret, how to correct? Source, management, hazard, how to correct? Na, Cl, B, source, hazard, how to correct? Crusting, compaction, infiltration, textural layers, fluctuating water tables, so what? Water quality affects all of the above
6 When and How often Should Water Samples be Collected? Prior to first time use New well Spring vs. late summer Trouble shooting Otherwise every other year is acceptable Wait until pump has been operating for > 30 minutes Fill container no head space Do NOT use glass (some leak B) Keep in cool location until shipped Always use a clean container
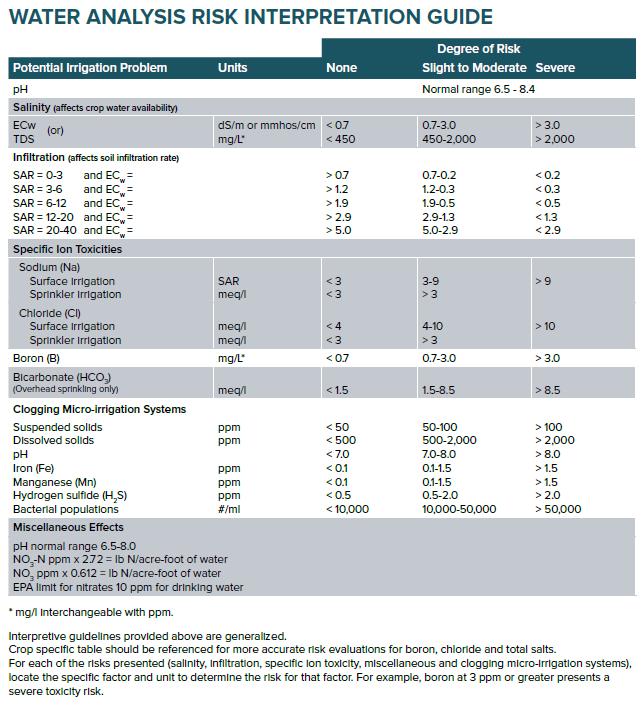
7 Water Analysis: Not All Waters are Created Equal ph Salinity Sodium Boron Chloride Calcium:Magnesium Nitrate Sulfate Carbonate/Bicarbonate Iron/Manganese Will vary by source, use history, seasonality and year. Don t assume!
8 Accumulation of Salts and Toxic Elements Parts per million in irrigation water X 2.72 = pounds applied per acre-foot of water ECw of 1.0 = 640 ppm Do the math and consider years and years of application Assuming 3-feet of irrigation water applied annually: EC of 1.0 ds/m = 5,000 lb salt applied to soil each year! 350 ppm Cl will load the soil with nearly 30,000 lbs Cl over a 10 year period
. 2. Form of stress 3.")
9 Saline Soils Soils which have a electrical conductivity of the saturation extract greater than 4 ds/m (or mmhos/cm). 1. As soil salts increase, plants require more energy to absorb clean water against a concentration gradient. = osmotic potential (drinking from a long straw). 2. Form of stress 3. At higher salt concentrations soil becomes physiologically dry even when physically wet. - cell destruction - desiccation - death 4. Accumulation of specific elements to toxic levels - species specific - sodium, chloride and boron 5. Seedlings and perennial crops with greater sensitivity
 > 3x ECw (irrigation water) then suspect insufficient leaching fraction or problem with internal drainage. 6.")
10 Saline Soils Sources and Considerations 1. Natural, marine deposits. 2. Change in water source as in new well test FIRST! 3. Seasonal changes in groundwater quality drought vs. wet year. 4. Subsurface salt deposits move to surface due to changed water table. 5. If ECe (soil) > 3x ECw (irrigation water) then suspect insufficient leaching fraction or problem with internal drainage. 6. If ECe higher in shallow soil than deeper soil, then suspect shallow water table, restrictive soil layer or insufficient leaching fraction. Portable water salinity meter:

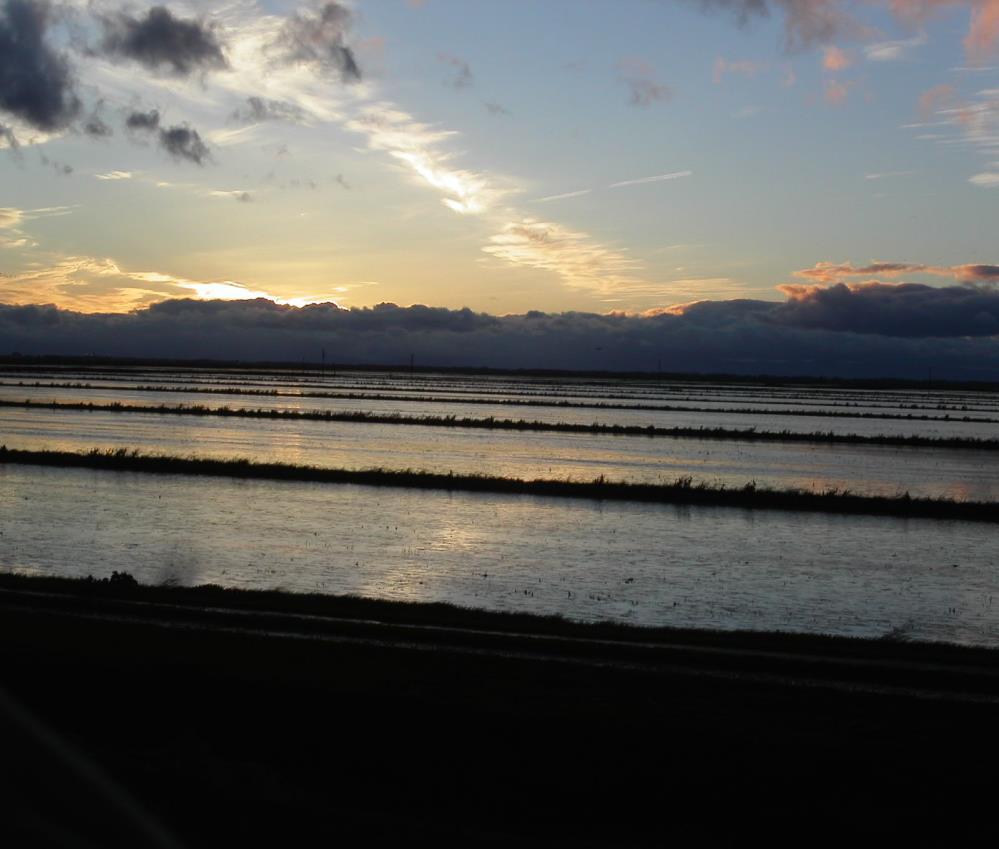
11 Change in water table moved previously undetected salts into root zone of wine grapes creating irregularly shaped areas suffering acute salt toxicity.
12 Generalized Crop Water Use Pattern Schematic diagram illustrating general crop water use pattern of 40%, 30%, 20% and 10% used in each quarter of the root zone. By maintaining adequate soil moisture and safe salinity levels in the top 50% of the root zone, crops will preferentially obtain their water from the less saltier, shallow water. Only when shallow soil moisture becomes depleted will crops rely on deeper, saltier water that requires greater amounts of energy to absorb.
13 Crop Management in a Saline Environment It s a Matter of Moving Salts Out of the Root Zone 1. Sprinkler and rainfall best moves salts down. 2. Repeated wet-drain cycles better than continuous ponding saturated flow less effective at moving salts than unsaturated flow. 3. Soil salinity will never be lower than salt concentration of irrigation water. 4. Don t force crop to forage for saltier water deeper in profile keep shallow soil moisture adequate. 5. Avoid use of chloride containing fertilizers 6. Remember, fertilizer are salts use judiciously 7. Minimize salt accumulation in root zone during early stages of plant growth General Rule of Thumb 6 of water moving through the soil will leach approx. 50% of the salts from the top foot 12 80% 24 90%
14 Specific Ion Toxicities Chloride very mobile in soil solution - manage same as soil salts leaching and drainage - do not use potassium chloride Boron - much lower soil mobility (3x water required to leach than Cl) - lime to raise ph (reduce availability) or gypsum may reduce uptake or improve soil drainage inconsistent - check water source and change if possible. - do not use foliar B to enhance fruit set where naturally occurring boron levels are high Cl and B Toxicity threshold values for soil or irrigation water have not been established for all crops. Use tissue analysis to confirm cause of suspected toxicity situation.
15 Sodium A. The Sodium and Bicarbonate Link Displacement Series: H > Ca > Mg > K > Na
16 Sodium A. The Sodium and Bicarbonate Link Ca + 2HCO 3 Upon drying CaCO 3 + CO 2 + H 2 O
17 Low risk high risk Sodium Adsorption Ratio B. The Sodium and Salinity Link - Infiltration Severe reduction in Infiltration rate Slight to moderate reduction in rate of infiltration No reduction in infiltration rate Salinity of Applied Water in ds/m high risk low risk
 causes leaching of calcium from soil surface.")
18 Physical Soil Quality Rearrangement of Soil Particles A. Structural Crust Surface run-off and ponding indicating poor infiltration is common where very pure, low-salt irrigation water is used. Description: Rainfall or irrigation containing very low levels of dissolved salts (<0.3 ds/m) causes leaching of calcium from soil surface. Lack of calcium causes soil to collapse sealing off soil surface. Crusts usually very thin (< ). Distribution: Common where snowmelt irrigation water is used. Less common on coast, coastal valleys and arid interior. Solution: Adding salt (gypsum) to irrigation water or on soil surface to be dissolved by irrigation water. Do not incorporate.
19 Water and Nutrient Management Considerations Quality Quantity Positional Availability
20 Nutrients Contained in Irrigation Water Nitrate, sulfate, calcium, magnesium, boron and chloride contribution may be significant ppm x 4 = lb/acre-foot of water P, K, Zn, Fe, Mn, Cu, Mo usually not contained at significant levels
21 Potassium Factors Affecting Availability 1. High Cation Exchange Capacity: * Larger magnet fixes K aggressively * Heavy soils have higher CEC than lighter textured soils 2. High Shrink-Swell Soils: * Clay particles swell when wet, shrink when dry * K trapped between lattice upon shrinking * For 2:1 clays only (montmorillonite, illite) 3. Extremes in Soil Moisture: * Saturation excludes oxygen required for root activity * Dry soil means no nutrients in solution 4. Compaction or hard pan: * Restricts root exploration of soil smaller root mass * Common when wet ground mechanically tilled 5. Excess Magnesium or Sodium * Cation competition 6. Root Damage 7. Excess N Rates
22 Water Quality Considerations for Low Volume Irrigation Systems Don t Assume Test First! Due to the low volume of irrigation water applied and the reduced volume of soil wetted, problems associated with water quality are usually exaggerated under drip: * Total dissolved solids (TDS = ECw x 640) * Chloride * Boron * Sodium In addition low volume irrigation presents challenges unique to this form of irrigation management: * Bicarbonate and calcium * Iron and manganese * Algae, bacterial slimes, suspended solids * Fertilizer injection

23 Problems Unique to Low Volume Irrigation Mineral Precipitation Limestone formation leading to plugging of emitters upon drying Ca + 2HCO CaCO 3 + CO 2 + H 2 O Plugged emitter with cover removed to show precipitate formed in flow channels. Regular injection of acids to prevent precipitate formation (ph ) or periodic acid shock treatments to dissolve precipitates (ph 3-4) are the prescribed remedies.
24 Problems Unique to Low Volume Irrigation Mineral Precipitation Iron or manganese at very low concentrations may form troublesome precipitates when water is aerated. Usually restricted to well waters. Iron and manganese precipitate are tenacious and difficult to remove. Avoidance is best remedy. Test water before designing system. If iron or manganese are over ppm, then aeration and settling ponds provide the most reliable and trouble free solution. Scale inhibitor compounds injected on a continuous basis offer some promise.

25 Phosphorous Reaction with Calcium Liquid P injected in buried drip system reacts with calcium carried in the irrigation water forming insoluble mono calcium phosphate. Injecting to maintain P 2 O 5 below 200 ppm may minimize or negate formation of calcium phosphate precipitate. *Can be avoided by dual acid injection (ph < 4.5)

26 Calcium Phosphates also Called Rock Phosphate

27 Phosphate Fertilizer Precipitation Test Hard water = immediate fall-out

28 Phosphate Fertilizer Precipitation Test Soft water or non-reactive phosphate = no reaction
29 Water Analysis by the Numbers Factor Effect Prefered Range ECw Poor infiltration > 0.5 mmhos/cm Salt toxicity < 1.0 mmhos/cm TDS Poor infiltration > 320 ppm Salt toxicity < 640 ppm
30 Water Analysis by the Numbers Factor Effect Prefered Range SAR Infiltration < 3 Toxicity < 3
31 Water Analysis by the Numbers Factor Effect Prefered Range Chloride Toxicity < 5 meq/l < 175 ppm Boron Toxicity < 0.5 ppm
32 Water Analysis by the Numbers Factor Effect Prefered Range Bicarbonate Speckling < 1.5 meq/l < 90 ppm
33 Water Analysis by the Numbers Factor Effect Prefered Range Ca:Mg:K Soil structure, nutrition 4:2:1 as meq/l
34 Water Analysis by the Numbers Factor Effect Prefered Range Calcium Clogging emitters < 2 meq/l < 40 ppm Bicarbonate Iron Manganese Hydrogen sulfide Bacterial populations < 2 meq/l < 120 ppm < 0.3 ppm < 0.3 ppm < 0.5 ppm < 10,000/ml
35


36