Demand Response Association of Energy Engineers. Presenter: David Wylie, P.E. ASWB Engineering
|
|
|
- Winifred Bell
- 5 years ago
- Views:
Transcription


1 Demand Response 2015 Association of Energy Engineers Presenter: David Wylie, P.E. ASWB Engineering


2 National Energy Peak Leveling Program
3 National Energy Peak Leveling Program


4 When Demand Meets Supply 4

5 Four Years of Drought in CA 100% of CA in severe drought ; 2015 water year worst one on record Lake Shasta. Current level is 50% of capacity 5

6 2015 Summer Hydro Outlook California gets about 14% of its power from hydroelectric power plants 2015 CA hydro outlook is poor; reservoirs at 48% of capacity; estimated loss (derate) of 2,700 MW in generating capacity CA snowpack virtually gone for 2015 CA can buy hydro power from Pacific Northwest, Hoover Dam, and others Regardless, there will be adequate power supplies for meeting summer peak conditions despite well below average hydroelectric supply 6

7 2015 Operating Reserve Margins Overall reserve margins in northern and southern California remain healthy 7
8 What is Demand Response? 8


9 Renewable Resources Wind and solar are intermittent and stability is more challenging When renewable resources are down, DR can serve as backup California can generate about 7% of its electricity from wind

10 Wind and Solar Profiles 10
11 What s the Duck Curve? 11

12 Flexible Resources Will Be Essential to Meeting the Net Load Demand Curve 12

13 Sustainable? 13


14 Integrated Demand Side Management (IDSM) 14


15 Supply vs. Demand Side Management Generation (supply) Load (demand) 15
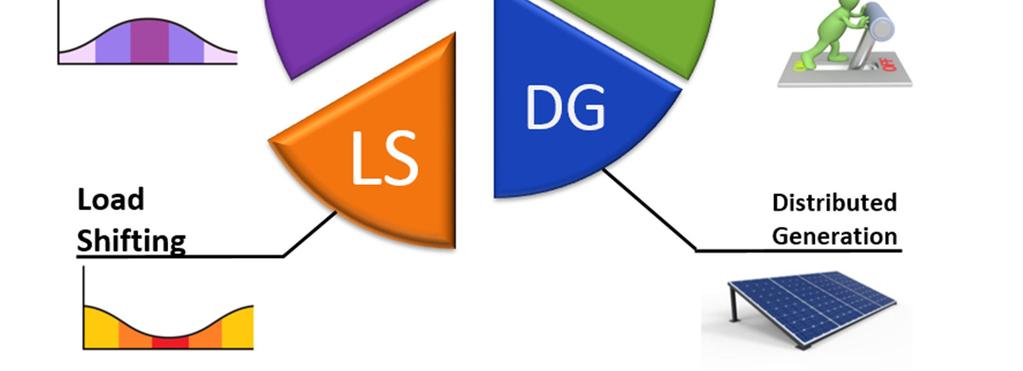
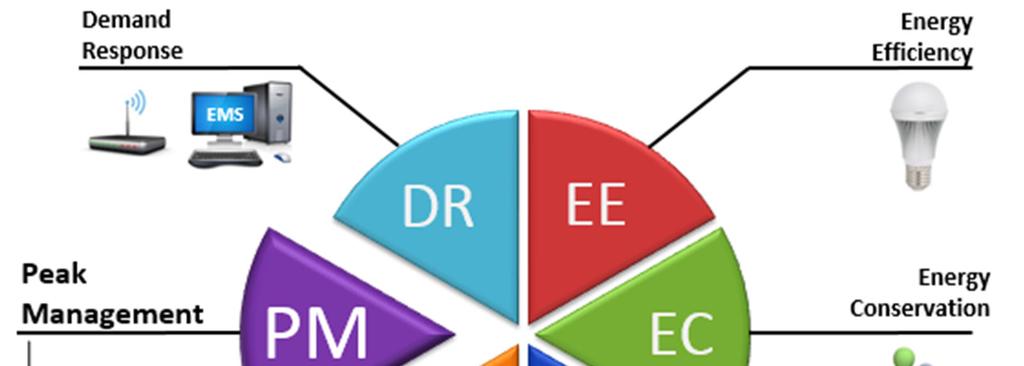
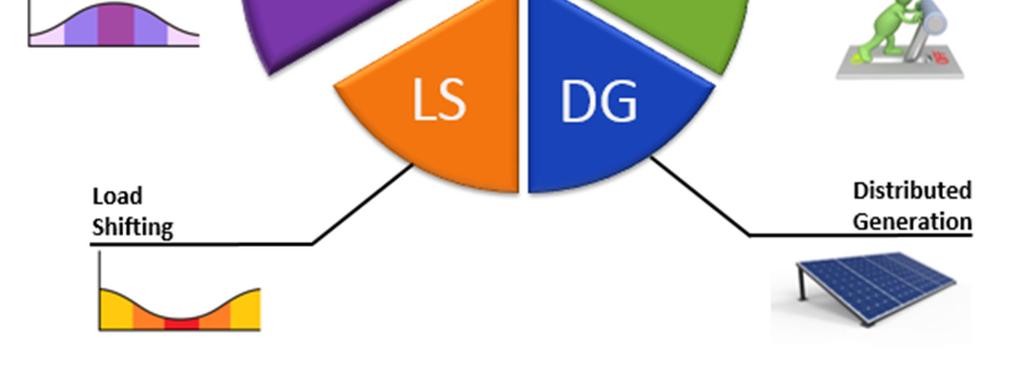
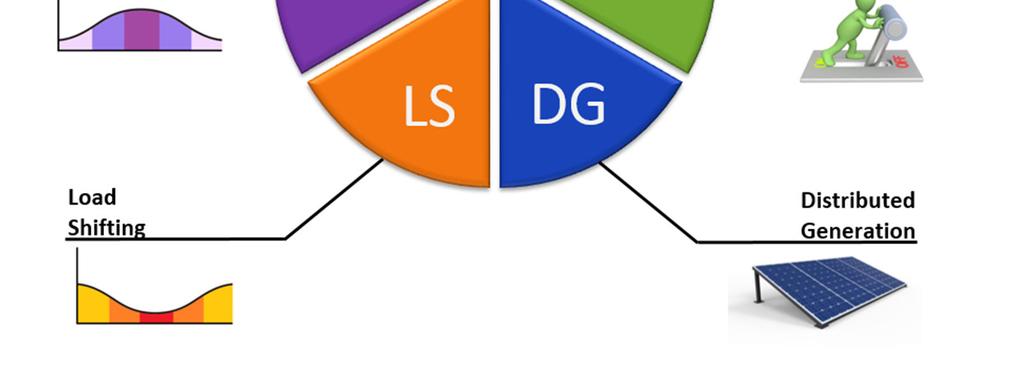
16 DSM Strategies Energy Conservation (EC) Energy Efficiency (EE) Distributed Generation (DG) Behavioral; reduction in use of energyconsuming devices Reduce kwh or therms by using more efficient equipment Self-generation of power Can be employed year-round or as needed Load Shifting (LS) Energy use is shifted to off-peak periods Peak Management (PM) Demand Response (DR) Manage loads to reduce overall peak demand Reduce load when requested for DR events Occasional (up to 10x/year), called by utility or grid 16

17 Load Shifting (LS) 17
18 Load Shifting with Thermal Energy Storage (TES) Peak Demand Without Load Shift: 1400 kw Peak Demand With Load Shift: 900 kw kw Demand kw Demand Chiller Cooling Cooling Misc. Fans & Pumps TES charging Misc. Fans & Pumps TES chg. 500 Lights 500 Lights 0 Base Load 0 Base Load Time of Day Time of Day

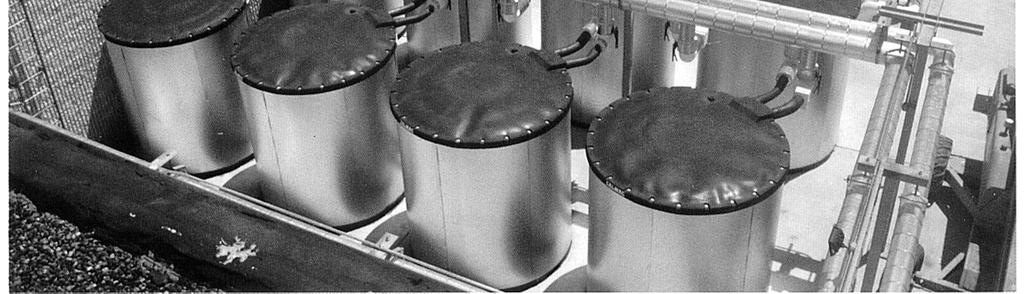
19 Brine Ice Building 19
20 Peak Management (PM) 20
21 Demand Limiting kw Monthly set limit Load without demand limiting Demand Limiting Peak Period No demand limit on this milder day Load with demand limiting e Time of day (24 hr) 21

22 Demand Response (DR) 22

23 What is Demand Response? 23

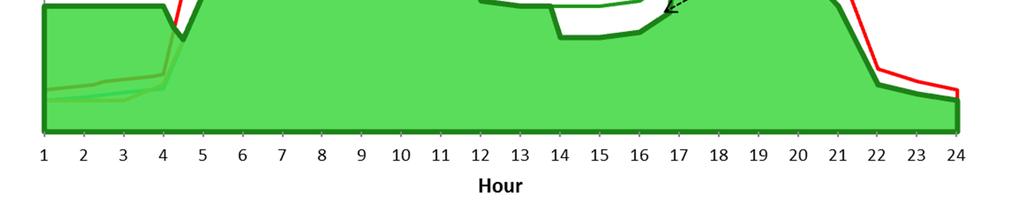
24 IDSM Loadshape 24
25 Efficiency and Demand Energy Efficiency A reduction in kwh throughout the year 8,760 hours Daily Load Shift Actions taken to reduce or shift load during time-of-use on-peak hours (kwh and kw) up to 900 hours during the summer Demand Response Reduce load (kw) when requested during unusual events Occasional, called by the utility 25
26 Reliability Response DR Programs Reliability programs: Keep the lights on Are activated after price response programs to meet emergency energy needs Reliability programs: Agricultural/Pumping Interruptible (AP-I) Base Interruptible Program (BIP) Summer Discount Plan (SDP) 26
27 Price Response Programs Price response programs: Summer Advantage Incentive (SAI) [aka Critical Peak Pricing (CPP)] SAI Light Demand Bidding Program (DBP) Capacity Bidding Program (CBP) Demand Response Contracts (DRC) Aggregator Managed Portfolio (AMP) Real Time Pricing (RTP) Summer Discount Plan (SDP) 27
; capable of remotely using EMS to increase cooling temperature by 4 degrees or more As DR capable lighting and HVAC controls become baseline requirements in the")
28 2013 Title 24 Code Requirements for DR Lighting DR controls for buildings larger than 10,000 square feet, must be capable of lowering lighting by at least 15% HVAC DR controls requires Occupant Controlled Smart Thermostats (OCST); capable of remotely using EMS to increase cooling temperature by 4 degrees or more As DR capable lighting and HVAC controls become baseline requirements in the code, they become ineligible for incentives 28


29 Title 24 and Auto-DR Communication pathway or Internet EMS Demand Response Automation Server (DRAS) Wired HVAC Lighting Machines Gateway Cloud service on Internet Facility Wi-Fi OCST HVAC Two types of load-control pathways from DRAS: Direct to site through Internet Through cloud-based service provider through Internet Either path can implement wired or wireless solutions: Direct pathway devices typically use open protocols Cloud service providers typically use proprietary protocols Business


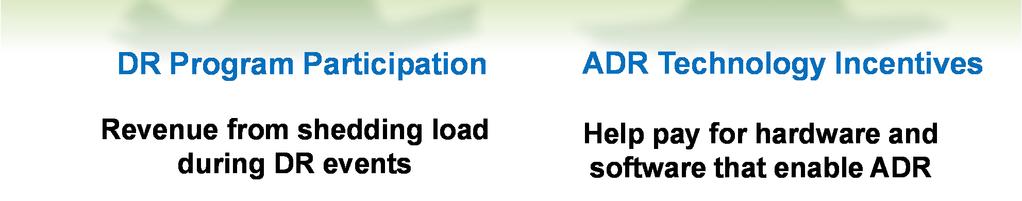
30 Two Sources of Funds for DR 30


31 North American Regional Transmission Organizations (RTO) Source: Created in Energy Velocity 31

32 WECC Transmission Grid 32


33 The Electric Grid Wholesale System Operator Generation power plant Generation power plant High voltage transmission High voltage transmission Distribution lines Load Substation Power voltage is stepped down for distribution Retail 33
34 Sources for Power Procurement CAISO markets Day-ahead market Real-time market Procurement SCE-owned generation and power purchase agreements 34
35 Major Factors Affecting Supply Economy Resource additions and retirements Demography Local generation Weather Demand Supply Generator outage Line outage Demand Response Interruptibles Target reserve margin Operating reserve margin Fuel availability Net import Supply adequacy 35

36 Procuring Power 36
 Regulation reserve Spinning reserve")

37 Specific Ancillary Services Approximate response time (minutes) Regulation reserve Spinning reserve Non-spinning reserve Supplemental reserve Demand response Metered information availability (minutes) 37
38 ISO Types of Fast and Flexible Capability Operational Needs Definition Benefit Continuous ramping Flexible Load following Regulation Fast Faster Ability to sustain continuous upward or downward ramps Respond to ISO 5-minute dispatch and meet expected operating levels within an hour Follow 4-second ISO control signals and meet performance expectations Ensures sufficient ramping capacity to meet the ISO s largest continuous ramp and multiple ramp conditions Ensures enough capacity with ramping capability available to be dispatched on a 5-minute basis through the ISO real-time dispatch market Ensures the ability to balance net loads and continuously maintain system frequency 38
39 CAISO DR Market Products Participating Load an entity providing Curtailable Demand Proxy Demand Resource (PDR) Reliability Demand Response Resource (RDRR) Non-Generator Resource (NGR) 39


40 CAISO Day-Ahead Market Determines unit commitments Analyzes unit must-run needs and mitigates bids if necessary Produces the least cost energy while meeting reliability needs Determines hourly market clearing prices at DLAP and pnode 40
41 Non-Generator Resource (NGR) A new ISO resource type that can operate continuously between generation and load Modeled as a generator with positive and negative energy Are constrained by an upper and lower capacity (MW) limit to inject or withdraw energy at a sustainable rate (ramp rate) Are constrained by an energy (MWh) limit to inject or withdraw energy on a continuous basis 41

42 Ramping up, ramping down Recognizes a resource can move from load to generation 42
43 Energy Storage Technologies Energy storage technology examples: Flywheel Lithium Ion battery Sodium Sulfur battery Flow batteries Compressed air energy storage Pumped hydro Electric Vehicles 43

44 Batteries Batteries and controls are getting more efficient Battery prices are expected to fall rapidly Programs need to accommodate batteries on the grid 44
45 California s Energy Storage Targets Procurement targets resulted in approximately 2,000 MW of storage projects in the ISO interconnection queue. Source: CPUC, Decision Adopting Energy Storage Procurement Framework and Design Program 45
46 DR Value Categories Services Energy Environmental Other categories Reliability Ancillary Services (and distribution equivalents) Grid support (Voltage, VAR, phase balancing) Resiliency Improved capacity factors (e.g., more MWh) Avoided peak energy costs Avoided greenhouse gasses (GHG) Avoided Renewable Energy Credits (RECs) Avoided emission permits Fuel price hedging value Clean Air Act compliance Avoided physical impact on habitats Secondary value of resources (e.g., EVs providing DR) o Value of combining DER (portfolio optimization) o Facilitating the growth of other preferred resources Energy and water security Avoided O&M costs Matching load to generation profiles Avoided overgeneration due to renewables Social, e.g., economic and employment benefits 46
47 Thank You! David Wylie, P.E. ASWB Engineering 47